2026-03-12
Home
Japanese

Omega Investment Co., Ltd.
KYODO PUBLIC RELATIONS (Investment report – 4Q update)
| Share price (5/1) | ¥754 | Dividend Yield (25/12 CE) | 1.9 % |
| 52weeks high/low | ¥430/940 | ROE(24/12) | 16.5 % |
| Avg Vol (3 month) | 23.9 thou shrs | Operating margin (24/12) | 14.7 % |
| Market Cap | ¥6.64 bn | Beta (5Y Monthly) | -0.27 |
| Enterprise Value | ¥3.84 bn | Shares Outstanding | 8.809 mn shrs |
| PER (25/12 CE) | 9.0 X | Listed market | TSE Standard |
| PBR (24/12 act) | 1.9 X |
| Click here for the PDF version of this page |
| PDF version |
Breaking Away from Traditional PR—Transforming into a Media & DX Company Through Integration of Influencer Marketing and AI
FY12/2024 Earnings Highlights:
Record-High Revenue and Profit Levels Sustained by a Virtuous Cycle Between Core and New Businesses
KYODO PUBLIC RELATIONS CO., LTD. (hereinafter, “Kyodo PR”) announced its full-year results for FY12/2024 on March 27, 2025. The company achieved near-record levels in both revenue and profit, further solidifying its growth trajectory at the consolidated level.
Net sales reached 7.323 billion yen (+6.2% YoY), operating profit was 1.074 billion yen (+27.8%), ordinary profit came in at 1.082 billion yen (+25.4%), and net income totaled 526 million yen (+7.9%). Both operating and ordinary profit saw double-digit growth, underscoring significant improvement in profitability.
By segment, the core PR business maintained sales growth of +3.1% YoY. The share of long-term retainer contracts rose to 64.6% (from 60.3% the previous year), supporting steady performance along with increased contract unit prices. Notably, the company expanded its footprint in growth industries, such as IT, government agencies, real estate, and automotive, with tangible results from its partnership with a U.S.-based lobbying firm and the opening of a new branch in Osaka.
The most significant contributor to profit growth was the influencer marketing business led by subsidiary VAZ. Sales rose to 986 million yen (+17.8% YoY), while operating profit more than doubled (+106.8%). Media revenue and tie-up projects from YouTube channels like “Mellpuchi” and “MelTV” expanded significantly, especially among Gen Z audiences, and a multi-layered monetization structure centered on social media advertising is now taking shape. In particular, the “Mellpuchi Senbatsu 2024” campaign exemplified the successful combination of stronger fan engagement and improved monetization.
The AI & Big Data Solutions segment reported 891 million yen in sales (+14.9% YoY). Core products like the scraping tool “Shtock Data” and monitoring platform “CERVN” continued to grow steadily, helping the company establish a stable stock-revenue model. New initiatives, such as business intelligence (BI) consulting for Dataiku and Tableau, were also launched to meet the increasing B2B demand for data integration and visualization.
From a financial standpoint, total assets stood at 5.81 billion yen (+7.0%), and the equity ratio improved to 58.8% (+5.7pt). The 570 million yen increase in cash and deposits reflected expanded working capital requirements from business growth, indicating demand-driven expansion. Profitability improved without compromising financial stability, marking a significant step forward in the company’s management structure.
The double-digit profit growth driven by both the influencer and AI segments signals a break from the company’s former pure-play PR model. With an operating margin rising to 14.7%, a continued shift toward high-value-added businesses could lead to a favorable market revaluation. In particular, its SNS media strategy and subscription-based AI services are expected to drive sustainable growth and business differentiation. Depending on next year’s guidance, this could be a catalyst for share price appreciation.
Segment Analysis:
Core PR Business Continues Steady Growth, While Influencer and AI Segments Emerge as New Profit Drivers
Kyodo PR’s operations are divided into three reportable segments:
1.PR Business
2.Influencer Marketing
3.AI & Big Data Solutions Each segment targets a distinct customer base and features a different revenue model and growth profile.
① PR Business (Net Sales: 5.445 billion yen, +3.1% YoY)
The company’s mainstay segment accounts for approximately 74% of total sales. Services include publicity support through media relations, press conference operations, crisis communication, and integrated PR using digital channels for corporate and public sector clients.
The segment is characterized by a high proportion of long-term retainer contracts, which provide a stable revenue base. In FY12/2024, retainer contracts made up 64.6% of PR segment sales (+4.3pt YoY), while foreign-affiliated clients accounted for a strong 35.4%. The company also took steps to expand geographically, forming a partnership with the U.S.-based lobbying firm Ballard Partners in August and opening a new office in Osaka in September.
② Influencer Marketing (Net Sales: 986 million yen, +17.8% YoY)
This segment, centered around subsidiary VAZ, leverages creators across YouTube, Instagram, and other social media platforms to execute tie-up campaigns and produce branded content. Advertising and sponsorship revenue from proprietary media channels such as “Mellpuchi” and “MelTV” surged during the year. Operating profit more than doubled (+106.8%), making this the most significant contributor to profit growth within the group.
The “Mellpuchi Senbatsu 2024” campaign drew over 230,000 votes, demonstrating the potential of fan engagement–based PR as a new revenue model. Going forward, the Company aims to implement a “multi-creator strategy” and expand into new areas such as corporate social media account management.
③ AI & Big Data Solutions (Net Sales: 891 million yen, +14.9% YoY)
Led by subsidiary Keywalker, this segment offers web crawling and data analysis services. Core offerings include subscription-based platforms like “Shtock Data” (AI scraping) and “CERVN” (automated monitoring), which have steadily increased recurring revenue and contributed to higher profitability. Operating margin remains high, with the stock-based model enhancing stability.
In 2024, the company launched a new AI development support service for enterprise clients under the Dataiku brand and began integrating it with BI tools like Tableau. These initiatives are designed to capture the growing demand for data-driven decision-making in B2B digital marketing.
FY2025 Earnings Forecast:
Third Consecutive Year of Operating Profit Growth—Momentum Building for Continued Expansion
Kyodo PR has announced its full-year forecast for FY12/2025, projecting sustained growth and high profit margins similar to the previous fiscal year. The company expects:
・Net sales of 8.5 billion yen (+16.1% YoY)
・Operating profit of 1.28 billion yen (+19.1%)
・Ordinary profit of 1.28 billion yen (+18.3%)
・Net income of 730 million yen (+38.7%)
This would mark a third straight year of double-digit operating profit growth, underscoring the companys solid trajectory of structural earnings improvement and scalable growth.
Each segment contributes strategically to this forecast. In the PR business, demand for outsourced corporate PR and crisis communication services remains firm. Long-term retainer contracts continue to form the revenue base, while integrated PR solutions that transcend B2B and B2C boundaries are gaining traction, especially in foreign-affiliated, IT, and government accounts. Rising contract unit prices and the growing potential of securing large-scale contracts through international partnerships support the company’s backlog and forward growth visibility.
In the influencer marketing segment, VAZ remains the main growth driver. The company is focused on increasing the monetization power of its affiliated creators and building a multi-layered revenue model. In addition to one-time tie-up campaigns, revenue from content reuse, owned-channel advertising, and public-sector SNS branding initiatives is all expanding. For FY2025, the company expects improved profitability and recurring revenue streams in this segment.
The AI & Big Data Solutions business continues to increase the share of subscription-based revenue, contributing to stable profitability. With the full-scale implementation of the “Dataiku” and “Tableau” integration services launched in 2024, larger and more sophisticated data analysis and DX consulting projects are on the horizon. The company is evolving from a SaaS product provider to a comprehensive DX solutions partner that supports clients’ data infrastructure needs.
Progress on the company’s mid-term management plan (FY2024–FY2026) is steady. While specific quantitative targets remain undisclosed, the company has delivered results in all three pillars of its strategy: business diversification, high profitability, and financial soundness. With a record-high operating margin of 14.7% previous year, there is ample room for market revaluation should these performance levels persist.
Financially, the company remains strong with an equity ratio of 58.8% and minimal dependence on interest-bearing debt, ensuring resilience against macroeconomic shifts.
The outlook for three consecutive years of profit growth reflects increasing contributions from newer segments, such as VAZ and AI services. If operating margins remain stable at around 15%, a market re-rating—both in terms of PER expansion and dividend policy upgrades—would be justified. Investors will closely watch for KPI disclosures in the influencer and AI segments (e.g., contract count, churn rate, ARPU), as well as progress in PR business digitization. Greater transparency on these metrics would further strengthen the revaluation narrative.
Stock Price Trends and Key Points to Watch
Kyodo PR Caught Between Momentum Shift and Valuation Reassessment—A Phase Where Market Sentiment and Fundamentals Begin to Align
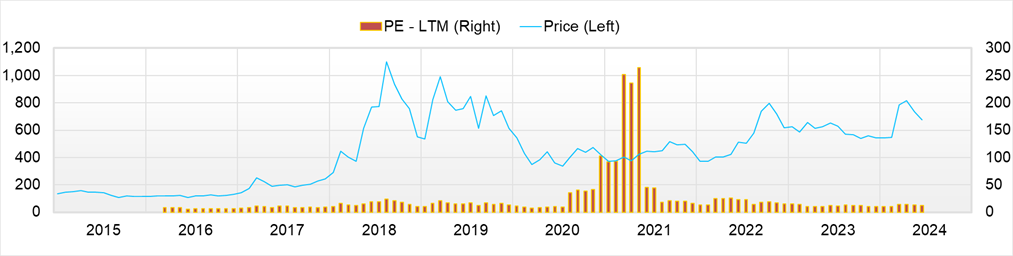
Between early 2024 and the end of March 2025, the share price of Kyodo PR (TSE: 2436) fluctuated within a range of 430 yen to 940 yen. The FY12/2024 results, announced on 13 February 2025, came in strong with net sales of 7.327 billion yen (+6.2% YoY) and operating profit of 1.074 billion yen (+27.8% YoY), approaching record highs. However, the share price remained relatively stable after the announcement, trading around 800 yen. With a current PER of 8.9x, PBR of 1.9x, and ROE of 16.5%, the stock appears significantly undervalued relative to its profitability, leaving substantial room for revaluation.
This valuation gap stems in part from the company’s steady earnings foundation in its core PR business and the growing contribution from high-growth segments such as influencer marketing and AI/big data solutions. These structural growth areas have yet to be fully priced in by the broader market. The company’s operating profit structure is rapidly evolving, driven particularly by the influencer segment, where VAZ’s standalone operating profit has more than doubled year on year. The growth is attributable primarily to the expansion of SNS-based tie-up campaigns leveraging in-house creators targeting Generation Z, and the multi-layered revenue streams from advertising and licensing businesses.
From a technical perspective, as of April 2025, the stock is trading above its 5-day and 25-day moving averages, while the 75-day line has also started to turn upward. This is seen as a sign of momentum recovery for the first time since June of the previous year, and the chart pattern appears to be forming a “bottoming-out” formation. MACD crossed above the zero line in late March, signaling a bullish crossover and strengthening short-term upward bias. The RSI hovers around 60, indicating a buying advantage without signs of overheating. Furthermore, Bollinger Bands have shifted from contraction to expansion, suggesting the stock is entering a phase of increased volatility.
On the weekly chart, the 900 yen level has served as a support line on multiple occasions over the past two years and is recognized as a psychological and supply-demand-based floor. Trading volume has also shown a gradual recovery since the correction phase in January, pointing to a shift in market tone from neutral to positive. These technical factors suggest an immediate upside target of 1,000 yen, and whether the price can break above this level convincingly will likely serve as the next trigger for a broader trend reversal.
In terms of short-term price reactions, news related to the growth of VAZ’s creator network or the strong performance of Gen Z-targeted media platforms like “Mellpuchi” and “MelTV” has led to temporary share price spikes of 3–5%. This indicates the market’s high sensitivity to the company’s expansion into new strategic domains.
One notable example of sharp price movement occurred on 6 January 2025, when news broke of a strategic partnership with U.S.-based lobbying firm Ballard Partners, known for ties to the Trump administration. The stock surged 129 yen (+16%) on the day to 911 yen, reflecting investor enthusiasm about potential entry into the U.S. market. Similarly, a report published by Branc on 2 September 2024 regarding a possible IPO and business recovery at VAZ sparked a multi-day rebound in the share price. In March 2025, Mellpuchi also announced its participation in “Cinderella Fest 2025,” one of Japan’s most significant youth events, again leading to a temporary spike in volume and price. These reactions confirm that influencer-related developments and overseas expansion news remain major short-term share price volatility drivers.
In January 2025, it was announced that VAZ, a company subsidiary, absorbed the entertainment-focused startup KOLTECH. This has enabled cross-sector media initiatives involving talents and entertainment influencers and the existing creator strategy, further enhancing its appeal in the B2C domain. The diversification of affiliated creators’ genres through this merger has significantly strengthened the ability to propose packages to advertisers, serving as an essential factor in promoting higher project unit prices and improved profit margins in the VAZ segment.
Thus, the company is currently experiencing favorable conditions in both business structural reforms such as mergers and policy support, entering a phase of structural revaluation.
Points of Interest Going Forward
A key point of interest moving forward is whether the sales and profits of the influencer and AI segments continue to expand in the first quarter of the fiscal year ending December 2025, scheduled to be announced in mid-May. Particularly, if it is confirmed that profit margins have further improved compared to the same period of the previous year, the market may perceive that the earnings structure has been completely transformed, adding credibility to a potential breakout above key resistance levels. Additionally, if shareholder return measures such as dividend increases or share buybacks are implemented, the stock price will likely transition to a new range, along with a recovery of the PBR to 1x.
Technically, the stock is exhibiting a favorable combination of indicators: a bullish MACD crossover, a strong RSI, and an expanding Bollinger Bandwidth. On the fundamentals side, the earning power of the segments is structurally strengthening. Moreover, with continued support from mergers and policies in the news, the stock price could experience an unexpected sharp rise at the moment these triggers align.
Company profile
◇ From a Traditional PR Firm to a DX-Integrated Communication Company
Kyodo Public Relations Co., Ltd. (Securities Code: 2436), founded in 1964, is one of Japan’s oldest public relations firms. Today, as a corporate group comprising four consolidated subsidiaries and two second-tier subsidiaries, it operates in three core businesses: PR, influencer marketing, and AI and big data solutions. The company is headquartered in Tsukiji, Chuo-ku, Tokyo. As of the end of the fiscal year ending December 2024, it employed 345 people on a consolidated basis (including temporary staff) and 211 on a non-consolidated basis.
Kyodo PR is listed on the Tokyo Stock Exchange Standard Market with a capitalization of 553.81 million yen. In terms of revenue composition, the PR business is its central pillar, accounting for approximately 74% of total sales, with AI solutions and influencer-related businesses complementing the rest. Notably, the influencer marketing business operated by subsidiary VAZ is emerging as a growth engine. VAZ is gaining an increasing presence in both media monetization and client PR projects through YouTube channels targeting Gen Z audiences, such as “Mell Puchi” and “MelTV.”
In the AI and big data solutions segment, the company offers a range of services powered by proprietary web crawlers and analytics engines. These services support marketing through collected data and provide seamless integration, visualization, and analysis with in-house corporate data, thereby strengthening competitiveness in the DX domain. Backed by this diversification strategy, the company achieved record-high performance on both a non-consolidated and consolidated basis.
Key financial data
| Unit: million yen | 2020/12 | 2021/12 | 2022/12 | 2023/12 | 2024/12 | 2025/12 CE |
| Sales | 4,990 | 5,610 | 5,265 | 6,896 | 7,324 | 8,500 |
| EBIT (Operating Income) | 157 | 381 | 720 | 841 | 1,075 | 1,280 |
| Pretax Income | 70 | 288 | 768 | 862 | 1,034 | |
| Net Profit Attributable to Owner of Parent | 13 | 132 | 520 | 488 | 526 | 730 |
| Cash & Short-Term Investments | 1,531 | 1,943 | 2,318 | 2,691 | 3,260 | |
| Total assets | 3,068 | 3,572 | 5,044 | 5,428 | 5,810 | |
| Total Debt | 531 | 591 | 967 | 767 | 539 | |
| Net Debt | -1,000 | -1,352 | -1,351 | -1,925 | -2,721 | |
| Total liabilities | 1,254 | 1,630 | 2,267 | 2,097 | 1,921 | |
| Total Shareholders’ Equity | 1,814 | 1,942 | 2,595 | 3,090 | 3,553 | |
| Net Operating Cash Flow | 384 | 442 | 546 | 771 | 911 | |
| Capital Expenditure | 30 | 155 | 67 | 54 | 33 | |
| Net Investing Cash Flow | -102 | -26 | -397 | -35 | -37 | |
| Net Financing Cash Flow | 242 | 16 | 220 | -375 | -311 | |
| Free Cash Flow | 355 | 286 | 479 | 717 | 878 | |
| ROA (%) | 0.43 | 3.97 | 12.08 | 9.31 | 9.36 | |
| ROE (%) | 0.68 | 7.03 | 22.94 | 17.15 | 15.84 | |
| EPS (Yen) | 1.6 | 16.3 | 61.2 | 56.6 | 60.6 | 84.1 |
| BPS (Yen) | 229.8 | 236.1 | 299.5 | 356.7 | 408.2 | |
| Dividend per Share (Yen) | 6.00 | 7.00 | 8.00 | 10.00 | 12.00 | 14.00 |
| Shares Outstanding (Million shrs) | 8.18 | 8.64 | 8.74 | 8.78 | 8.79 |
Source: Omega Investment from company data, rounded to the nearest whole number.
Share price
Financial data (quarterly basis)
| Unit: million yen | 2023/12 | 2024/12 | ||||||
| 1Q | 2Q | 3Q | 4Q | 1Q | 2Q | 3Q | 4Q | |
| (Income Statement) | ||||||||
| Sales | 1,649 | 1,615 | 1,689 | 1,943 | 1,788 | 1,779 | 1,716 | 2,041 |
| Year-on-year | 52.4% | 43.3% | 21.3% | 16.8% | 8.4% | 10.2% | 1.6% | 5.0% |
| Cost of Goods Sold (COGS) | 907 | 903 | 956 | 1,128 | 972 | 966 | 925 | 1,147 |
| Gross Income | 742 | 712 | 734 | 815 | 816 | 814 | 791 | 894 |
| Gross Income Margin | 45.0% | 44.1% | 43.4% | 42.0% | 45.6% | 45.7% | 46.1% | 43.8% |
| SG&A Expense | 474 | 532 | 540 | 616 | 519 | 545 | 530 | 646 |
| EBIT (Operating Income) | 267 | 180 | 194 | 200 | 297 | 269 | 261 | 248 |
| Year-on-year | 13.2% | -7.1% | 26.6% | 45.6% | 11.2% | 49.2% | 34.4% | 24.4% |
| Operating Income Margin | 16.2% | 11.2% | 11.5% | 10.3% | 16.6% | 15.1% | 15.2% | 12.2% |
| EBITDA | 318 | 235 | 251 | 254 | 349 | 319 | 312 | 298 |
| Pretax Income | 265 | 189 | 202 | 206 | 277 | 271 | 230 | 256 |
| Consolidated Net Income | 160 | 108 | 126 | 152 | 147 | 177 | 147 | 150 |
| Minority Interest | 16 | 9 | 19 | 15 | 31 | 28 | 26 | 10 |
| Net Income ATOP | 144 | 99 | 106 | 137 | 116 | 148 | 121 | 141 |
| Year-on-year | -6.0% | -45.5% | 24.1% | 39.3% | -19.5% | 49.1% | 13.6% | 2.5% |
| Net Income Margin | 8.8% | 6.2% | 6.3% | 7.1% | 6.5% | 8.3% | 7.0% | 6.9% |
| (Balance Sheet) | ||||||||
| Cash & Short-Term Investments | 2,113 | 2,310 | 2,327 | 2,691 | 2,657 | 2,980 | 2,946 | 3,260 |
| Total assets | 4,786 | 4,940 | 4,905 | 5,428 | 5,286 | 5,448 | 5,342 | 5,810 |
| Total Debt | 886 | 885 | 826 | 767 | 707 | 647 | 586 | 539 |
| Net Debt | -1,226 | -1,426 | -1,500 | -1,925 | -1,950 | -2,333 | -2,360 | -2,721 |
| Total liabilities | 1,944 | 1,945 | 1,771 | 2,097 | 1,885 | 1,855 | 1,615 | 1,921 |
| Total Sharehjolders’ Equity | 2,644 | 2,788 | 2,908 | 3,090 | 3,129 | 3,293 | 3,401 | 3,553 |
| (Profitability %) | ||||||||
| ROA | 12.02 | 8.53 | 9.03 | 9.31 | 9.12 | 9.79 | 10.20 | 9.36 |
| ROE | 21.74 | 16.43 | 16.52 | 17.15 | 15.92 | 16.72 | 16.57 | 15.84 |
| (Per-share) Unit: JPY | ||||||||
| EPS | 16.8 | 11.5 | 12.3 | 15.9 | 13.4 | 17.1 | 13.9 | 16.2 |
| BPS | 307.8 | 323.6 | 337.0 | 356.7 | 361.1 | 379.0 | 391.4 | 408.2 |
| Dividend per Share | 0.00 | 0.00 | 0.00 | 10.00 | 0.00 | 0.00 | 0.00 | 12.00 |
| Shares Outstanding(million shrs) | 8.74 | 8.75 | 8.75 | 8.78 | 8.79 | 8.79 | 8.79 | 8.79 |
Financial data (full-year basis)
| Unit: million yen | 2014 | 2015 | 2016 | 2017 | 2018 | 2019 | 2020 | 2021 | 2022 | 2023 | 2024 |
| (Income Statement) | |||||||||||
| Sales | 4,063 | 3,705 | 4,100 | 4,379 | 5,318 | 5,758 | 4,990 | 5,610 | 5,265 | 6,896 | 7,324 |
| Year-on-year | 1.1% | -8.8% | 10.7% | 6.8% | 21.4% | 8.3% | -13.3% | 12.4% | -6.1% | 31.0% | 6.2% |
| Cost of Goods Sold | 2,223 | 1,385 | 1,703 | 1,822 | 2,546 | 2,879 | 2,367 | 2,614 | 2,843 | 3,894 | 4,010 |
| Gross Income | 1,840 | 2,320 | 2,396 | 2,558 | 2,772 | 2,879 | 2,623 | 2,996 | 2,422 | 3,002 | 3,314 |
| Gross Income Margin | 45.3% | 62.6% | 58.5% | 58.4% | 52.1% | 50.0% | 52.6% | 53.4% | 46.0% | 43.5% | 45.3% |
| SG&A Expense | 569 | 597 | 2,216 | 2,293 | 2,324 | 2,374 | 2,456 | 2,597 | 1,685 | 2,147 | 2,225 |
| EBIT (Operating Income) | 1,271 | 1,723 | 180 | 265 | 444 | 502 | 157 | 381 | 720 | 841 | 1,075 |
| Year-on-year | -34.0% | 35.5% | -89.5% | 46.7% | 68.0% | 12.9% | -68.8% | 143.8% | 88.7% | 16.8% | 27.8% |
| Operating Income Margin | 31.3% | 46.5% | 4.4% | 6.0% | 8.4% | 8.7% | 3.1% | 6.8% | 13.7% | 12.2% | 14.7% |
| EBITDA | 1,282 | 1,733 | 195 | 284 | 468 | 534 | 202 | 447 | 857 | 1,059 | 1,279 |
| Pretax Income | -386 | 132 | 181 | 257 | 432 | 502 | 70 | 288 | 768 | 862 | 1,034 |
| Consolidated Net Income | -515 | 108 | 163 | 221 | 366 | 372 | 13 | 132 | 539 | 546 | 621 |
| Minority Interest | 0 | 0 | 0 | 0 | 0 | 0 | 0 | 0 | 18 | 58 | 95 |
| Net Income ATOP | -515 | 108 | 163 | 221 | 366 | 372 | 13 | 132 | 520 | 488 | 526 |
| Year-on-year | 803.1% | -121.0% | 51.2% | 35.3% | 65.8% | 1.5% | -96.6% | 943.0% | 294.4% | -6.3% | 7.9% |
| Net Income Margin | -12.7% | 2.9% | 4.0% | 5.0% | 6.9% | 6.5% | 0.3% | 2.4% | 9.9% | 7.1% | 7.2% |
| (Balance Sheet) | |||||||||||
| Cash & Short-Term Investments | 851 | 473 | 611 | 659 | 1,012 | 1,032 | 1,531 | 1,943 | 2,318 | 2,691 | 3,260 |
| Total assets | 2,408 | 2,247 | 1,784 | 2,113 | 2,637 | 2,831 | 3,068 | 3,572 | 5,044 | 5,428 | 5,810 |
| Total Debt | 478 | 402 | 462 | 390 | 280 | 163 | 531 | 591 | 967 | 767 | 539 |
| Net Debt | -373 | -71 | -149 | -269 | -732 | -869 | -1,000 | -1,352 | -1,351 | -1,925 | -2,721 |
| Total liabilities | 1,910 | 1,622 | 1,003 | 1,105 | 1,109 | 930 | 1,254 | 1,630 | 2,267 | 2,097 | 1,921 |
| Total Sharehjolders’ Equity | 498 | 625 | 782 | 1,008 | 1,528 | 1,901 | 1,814 | 1,942 | 2,595 | 3,090 | 3,553 |
| (Cash Flow) | |||||||||||
| Net Operating Cash Flow | 76 | -260 | 125 | 152 | 437 | 274 | 384 | 442 | 546 | 771 | 911 |
| Capital Expenditure | 9 | 8 | 13 | 9 | 15 | 36 | 30 | 155 | 67 | 54 | 33 |
| Net Investing Cash Flow | 8 | -68 | -16 | -15 | -131 | -123 | -102 | -26 | -397 | -35 | -37 |
| Net Financing Cash Flow | 68 | -79 | 31 | -89 | 47 | -132 | 242 | 16 | 220 | -375 | -311 |
| Free Cash Flow | 67 | -264 | 112 | 144 | 422 | 238 | 355 | 286 | 479 | 717 | 878 |
| (Profitability %) | |||||||||||
| ROA | -22.91 | 4.64 | 8.11 | 11.34 | 15.43 | 13.60 | 0.43 | 3.97 | 12.08 | 9.31 | 9.36 |
| ROE | -69.43 | 19.25 | 23.24 | 24.69 | 28.89 | 21.69 | 0.68 | 7.03 | 22.94 | 17.15 | 15.84 |
| Net Margin | -12.68 | 2.92 | 3.99 | 5.05 | 6.89 | 6.46 | 0.25 | 2.35 | 9.89 | 7.07 | 7.18 |
| Asset Turn | 1.81 | 1.59 | 2.03 | 2.25 | 2.24 | 2.11 | 1.69 | 1.69 | 1.22 | 1.32 | 1.30 |
| Assets/Equity | 3.03 | 4.15 | 2.87 | 2.18 | 1.87 | 1.59 | 1.59 | 1.77 | 1.90 | 1.84 | 1.69 |
| (Per-share) Unit: JPY | |||||||||||
| EPS | -69.9 | 14.7 | 22.2 | 30.0 | 46.6 | 46.6 | 1.6 | 16.3 | 61.2 | 56.6 | 60.6 |
| BPS | 67.5 | 84.7 | 106.0 | 136.7 | 191.9 | 237.9 | 229.8 | 236.1 | 299.5 | 356.7 | 408.2 |
| Dividend per Share | 0.00 | 0.00 | 0.00 | 0.00 | 2.50 | 5.00 | 6.00 | 7.00 | 8.00 | 10.00 | 12.00 |
| Shares Outstanding(million shrs) | 7.56 | 7.56 | 7.56 | 7.56 | 8.15 | 8.17 | 8.18 | 8.64 | 8.74 | 8.78 | 8.79 |
Source: Omega Investment from company materials