2026-03-12
Home
Japanese

Omega Investment Co., Ltd.
Ricksoft (Investment Report – Basic)
| Share price (6/23) | ¥811 | Dividend Yield (26/2 CE) | 0.0 % |
| 52weeks high/low | ¥738/2,144 | ROE(25/2 act) | 12.3% |
| Avg Vol (3 month) | 6.8 thou shrs | Operating margin (TTM) | 5.1 % |
| Market Cap | ¥3.69 bn | Beta (5Y Monthly) | -0.01 |
| Enterprise Value | ¥0.35 bn | Shares Outstanding | 4.550 mn shrs |
| PER (26/2 CE) | 11.5 X | Listed market | TSE Growth |
| PBR (25/2 act) | 1.2 X |
| Click here for the PDF version of this page |
| PDF version |
Revaluation potential for a growth company amid structural reform – Ricksoft’s investment strategy is built on restoring profitability and balancing capital efficiency
Investment Decision
“Reigniting profitability” as the key to the next growth phase: a turning point demanding improved profit quality and efficiency
Ricksoft Co., Ltd. (hereinafter referred to as “the Company”) is a global B2B software service provider centered around Atlassian product-based tool solutions. While the Company grew rapidly in the early 2020s with a license sales-centered model, it is currently in a transitional phase toward its next growth stage.
In the FY2/2025, net sales rose by 20.7% YoY to 9.04 billion yen, continuing steady expansion. However, operating profit declined by 31.1% YoY to 458 million yen, and EBITDA also trended downward, signaling a slowdown in profit growth. Operating margin fell from 8.9% in FY2023 to 5.1% in FY2025, indicating that changes in the profit structure are weighing on profitability.
The decline in profit is attributed to intensified price competition, resulting in lower license margins and issues with SI’s sales strategy and support services. In its FY2025 presentation materials, the Company acknowledged it had “failed to focus on its inherent strength: providing added value” and has since embarked on business structure reforms.
While operating cash flow improved significantly to 377 million yen (+276% YoY), both investing and financing cash flows turned negative, revealing some instability in capital circulation. Return on equity (ROE) was 12.3%, and return on invested capital (ROIC) is around 10.5%, both stagnating compared to previous years. Enhancing capital efficiency remains a management issue.
On a positive note, the Company launched its mid-to-long-term vision “Reignite 2030” in April 2025, focusing on returning to high-value-added professional services, strengthening proprietary products, and expanding in Asian and U.S. markets. Notably, its transition to a “strategic partner” model aimed at building long-term enterprise relationships can potentially improve the quality of profits.
From a valuation perspective, the stock appears undervalued, with a forward PER of 11.3x and actual PBR of 1.18x. If the structural transformation progresses successfully, significant upside potential remains. With the share price hovering around 800 yen and technical indicators (RSI and Bollinger Bands) in neutral territory, there is room for mid-to-long-term revaluation despite short-term adjustment risks.
The Company faces an asymmetric phase of “growing sales and stagnant profits.” While its credibility and financial soundness are intact, urgent reform of the profit-generating model is needed. A neutral stance is appropriate at this stage, with investment decisions best made in phases over the medium to long term, based on progress in structural reforms and earnings recovery.
1. Company overview
Global expansion centered on Atlassian products : a cloud solutions firm specialized in b2b
The Company is a B2B software firm offering technology solutions centered on Atlassian products. Since its establishment in 2005, its core businesses have been the sale, implementation support, and in-house development of cloud tools to improve productivity in project management, information sharing, and agile development.
Headquartered in Chiyoda-ku, Tokyo, the Company has domestic offices in Tokyo and Nagoya, and an overseas subsidiary in San Francisco, U.S. (Ricksoft, Inc.). As of the end of February 2025, it had 145 employees and a capital of 350 million yen.
Its operations are divided into three main segments: (1) “Technology Solutions” centered on the sale of Atlassian licenses (81.9% of sales), (2) “Professional Services” providing system implementation and training support (10.1%), and (3) “In-house Products” offering applications developed in-house (8.0%).
The Company excels in supporting enterprise cloud migration using Atlassian products such as Jira, Confluence, and Bitbucket and proposing productivity-enhancing solutions in the DevOps context. Its client base includes major firms in finance, manufacturing, and IT. Another distinguishing feature is its global sales: approximately 70% of revenue from in-house software comes from overseas, primarily via the Atlassian Marketplace.
In recent years, the Company has expanded its solutions to AI and automation and shifted toward sector-specific responses and a strategic partner-type model.
Although the Company discloses its financials as a single segment, from the fiscal year ending February 2025 onward, it reorganized its services into the three aforementioned categories. This move, intended to better align with growth investment and KPI management, reflects an increasing emphasis on transparency and mid-to-long-term strategy.
As noted earlier, while sales growth remains steady, profitability is in a correction phase. However, through its “Reignite 2030” initiative, the Company is promoting structural reform, entering a phase where a renewed capacity to generate corporate value is expected.
2. Business characteristics and activities
Differentiation strategy through “Atlassian-focused dx support” : Pursuing competitive advantage in high-value-added domains
The company specializes in technical implementation support and professional services for Atlassian software and has established an integrated B2B model that combines tool implementation, DX support, and in-house software development. The company’s business consists of a three-tier structure designed to support the DX initiatives of its customers.
The first and largest is the “Technology Solutions” segment (81.9% of FY2/2025 sales, +22.1% YoY), centered on the sales and implementation of Atlassian licenses. The Company has long maintained a close partnership with Atlassian and was awarded “Atlassian Partner of the Year 2023: Cloud Migration Services” in recognition of its achievements in cloud migration across the Asia-Pacific region.
The second, the “Professional Services” segment (10.1% of sales, +24.7% YoY), offers system integration (SI), paid training, and support services. Its strength lies in highly tailored responses by industry-specific teams (e.g., finance, manufacturing, IT), with a shift toward a “strategic partner” model focusing on client-specific proposals and continuous support.
The third, the “In-house Products” segment (8.0% of sales, +27.9% YoY), focuses on developing and selling enhancement applications for Atlassian products via the Atlassian Marketplace. Notably, about 70% of its revenue in this segment comes from overseas clients. These offerings include advanced products such as extensions for Jira and automation tools tailored to enterprise needs.
Meanwhile, the previously core “Managed Services” (1.9% of sales, −36.0% YoY) have seen profitability decline due to pricing pressures and operational structure issues and are currently under review. Overall, the Company is shifting strategy with a focus on “reducing reliance on license sales,” “expanding high-margin solutions,” and “stabilizing mid-to-long-term revenue,” refocusing on its founding strength of client-centric service.
The Company plans to evolve its solutions by incorporating AI, BPO capabilities, and industry-specific templates, transitioning from traditional SI to scalable, replicable service models. These efforts enhance revenue stability and profit quality, forming the foundation for the next growth phase.
In sum, the Company is evolving beyond a tool vendor into a strategic partner deeply engaged in solving client business and management issues. This transformation is expected to enhance the quality of its revenue structure and improve capital efficiency in the medium to long term.
3. Major shareholders and investment trends
Founder control and long-term institutional investors coexist : stable shareholder structure and low liquidity suggest investment behavior
As of May 2025, the Company’s shareholder structure shows that the founder and related parties retain strong control, contributing to a high proportion of stable shareholders. The largest shareholder, HS Inc. (effectively controlled by founder Hiroshi Onuki), owns 43.95% (2.00 million shares) of the outstanding stock, with no change over the past six months.
In addition, Mr. Onuki personally holds 3.20% (146,000 shares), and co-founder Norio Hattori owns 2.32% (106,000 shares), supporting board stability and consistent decision-making.
The Company also holds 1.54% (70,000 shares) as treasury stock. Combined, management and related parties control over 51% of the shares.
On the other hand, the stock’s low free float makes it susceptible to liquidity constraints. From a supply-demand perspective, investors should adopt a medium—to long-term holding strategy rather than short-term trading.
Institutional investor activity is also notable. SPARX Asset Management holds 3.72% (169,000 shares), including the Sparx Japan Small Cap Fund, indicating that the Company is recognized as a small-cap growth stock. However, some selling occurred in the latter half of 2024 (a reduction of 73,000 shares over six months), suggesting a potential reassessment.
Hikari Tsushin Inc. has newly acquired 3.91% (175,000 shares), becoming a significant shareholder. Known for focusing on financial soundness and cash flow generation, this investment reflects confidence in the Company’s restructuring and stable B2B business model. Their stake has been gradually increasing, potentially signaling a medium-term positioning for revaluation.
SBI Securities (nominee) also continues to hold shares, with 4.46% (199,000 shares) as of February 2025. This likely represents dispersed holdings by retail investors aggregated in trust accounts, indicating certain interest levels and support from the retail investor base.
Long-term domestic investors such as the Sawakami Fund (1.91%) and Daiwa Asset Management (1.36%) also hold stakes, suggesting the Company is being recognized as a “maturing growth stock.”
Given these characteristics, Ricksoft’s stock is unlikely to exhibit extreme volatility due to supply-demand imbalance, but it retains strong potential for revaluation tied to structural reforms or earnings recovery. With room for share buybacks, the stock is also positioned for future shareholder returns.
Overall, the shareholder structure aligns well with investors seeking stability in management and mid- to long-term returns. Developments in capital policy merit attention moving forward.
4. Medium-term business plan
Reignite 2030: revitalizing growth : Transition to structural reform and value-added strategies
In April 2025, the Company unveiled its medium-term management plan titled “Reignite 2030,” steering its growth strategy toward business structure transformation and enhanced value-added services. The key term “Reignite” embodies the Company’s resolve to leverage strengths cultivated during its high-growth period while adapting to customer needs and external environment shifts.
The backdrop to this initiative includes limitations in the previous growth model that relied heavily on Atlassian license sales. This dependence became apparent through declining profit margins and intensified price competition. Although net sales rose 20.7% YoY to 9.04 billion yen in FY2025, operating profit fell by 31.1% to 458 million yen, with the operating margin dropping to 5.1%, thereby exposing structural fragility in the Company’s earnings.
The medium-term plan highlights a shift “from quantity to quality,” focusing on three key strategies. First is the “value-added transformation of Professional Services.” The Company aims to build strategic partner-type revenue models by establishing dedicated industry teams and offering specialized SI and training solutions.
Second is the “positioning of in-house products as core revenue drivers.” Cloud app sales via the Atlassian Marketplace grew by 27.9% YoY in FY2/2025, with overseas revenue comprising around 70%. These metrics underscore the urgent need to scale this segment as a global earnings pillar.
Third is the “redefinition and reorganization of service categories.” From FY2/2026 onward, the Company plans to restructure its three conventional business segments (license/SI/proprietary software) into “Technology Solutions,” “Professional Services,” and “In-house Products,” with a focus on clarifying KPI management and accountability for profitability.
The plan also calls for strengthening support for advanced technologies such as AI, automation, and cloud migration. The Company seeks to improve unit prices and contract retention rates by promoting upselling and cross-selling strategies to existing clients.
While specific numerical targets have not been disclosed, the Company has focused on enhancing the quality of profits and improving capital efficiency (ROIC > WACC), signaling a shift toward aligning financial and growth strategies.
The medium-term plan outlines a clear direction for structural reform and recognizes the challenges ahead. It serves as a bridge from a growth to a maturation phase. Going forward, investors should closely monitor the quality and execution of the plan and assess its progress through quantitative KPIs.
5. International business
Proprietary product expansion in north America leads the way : Overseas business contributing to diversified revenue despite its limited scale
While primarily focused on the domestic market, the Company secures a certain revenue base from overseas, particularly through its proprietary products. In FY2/2025, sales from the proprietary software development business reached 720 million yen (+27.9% YoY), with approximately 70% derived from international clients.
Most of this overseas revenue comes from cloud application sales via the Atlassian Marketplace, resulting in a diversified revenue structure not heavily dependent on specific geographic regions. Utilization is particularly high in the North American market (mainly English-speaking countries), where localization efforts, such as globally compatible UI, well-developed documentation, and employment of native English-speaking staff, have supported business growth.
Ricksoft, Inc., a U.S. subsidiary established in San Francisco in 2017, has been central to building the Company’s global sales and customer support infrastructure. In 2024, the Company received official global partner certification, suggesting recognition from Atlassian at a certain level.
That said, License Sales, SI, and Professional Services remain primarily domestic, and the international business likely accounts for only a small single-digit percentage of total revenue. Therefore, the international business’s current positioning remains as a “complementary growth axis” rather than a core growth driver.
Nonetheless, the Company’s recent medium-term strategy emphasizes strengthened overseas expansion. Planned initiatives include broadening alliances in English-speaking markets, developing globally compatible applications, and enhancing overseas subscription models with its cloud product expansion.
The Company is also leveraging its alignment with Atlassian’s growth in the Asia-Pacific region (CAGR 35 %+), pursuing partnerships and localization strategies in those markets. These initiatives are expected to contribute to stable cash flow and a reinforced revenue base through currency diversification and market dispersion.
In summary, while still a supplementary component of the Company’s overall business, international expansion, particularly through proprietary product sales and the strategic use of its U.S. subsidiary, can enhance profit margins and revenue diversification in the medium term. Disclosing explicit numerical targets and regional strategies will serve as valuable evaluation metrics for investors.
6. Long-term business performance
Upward trend in sales, fluctuating profits : A decade marked by both growth and restructuring
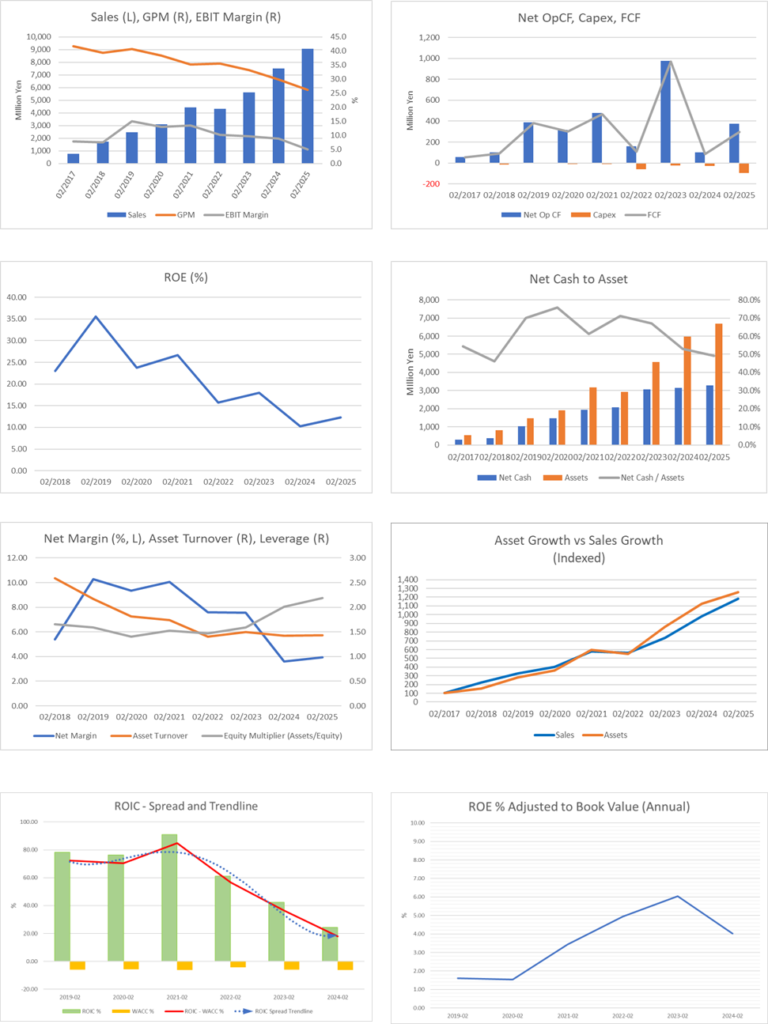
Over the past 10 years, the Company has consistently demonstrated upward momentum in revenue, while profit levels have shown considerable volatility, reflecting a transitional phase from growth to stability.
Of particular note is the steady rise in net sales. In FY2/2017, revenue stood at approximately 3.0 billion yen. By FY2/2021, it had surpassed 5.0 billion yen; by FY2/2025, it reached 9.04 billion yen, representing a CAGR of roughly 24%. This expansion was supported by the growth of the professional services segment centered on Atlassian license sales and the overseas development of proprietary applications.
However, profit indicators have not followed the same upward trajectory. While operating profit reached 546 million yen in FY2/2023, it amounted to 665 million yen in FY2/2024 on sales of 749 million yen (an operating margin of 8.9%). Still, it declined to 458 million yen (margin of 5.1%) in FY2025. This downturn was mainly due to underperformance in Managed Services, reduced license margins, and increased SG&A expenses tied to hiring and R&D.
Similar patterns were observed in EBITDA and net income, indicating that the Company’s profit-generating structure remains unstable. In response, the Company has clearly stated its intent to improve the quality of profits through the “Reignite 2030” initiative and reorient toward higher value-added services.
On the financial side, while capital reserves have increased over the long term, capital efficiency metrics such as ROE and ROIC have fluctuated year by year. ROE, which once exceeded 10%, stood at 12.3% in FY2/2025. However, the consistency of returns on invested capital remains an area for improvement.
The Company’s free cash flow (FCF) has also shown significant year-to-year variation. Although operating cash flow turned positive, outflows associated with growth investments and rising personnel costs remain substantial, leaving room for improvement in cash flow stability.
In summary, the Company has established a long-term trend of sales growth. However, profit and cash flow volatility reflect a company seeking optimal transformation between growth and maturity. Moving forward, stabilization of quantitative KPIs and sustained improvements in capital efficiency will be critical to enhancing long-term corporate value.
7. Most recent financial results
Revenue exceeds forecasts, profit down despite outperformance : Urgent need for profit structure rebuilding
In the FY2/2025, the Company achieved consolidated net sales of 9.04 billion yen (+20.7% YoY), surpassing the January forecast of 8.83 billion yen. This upside was driven by a recovery in the utilization rate of Atlassian licenses and SI services and stronger-than-expected proprietary software sales.
However, operating profit fell sharply to 458 million yen (–31.1% YoY), with an operating margin of 5.1%, down 3.8 percentage points from the previous year’s 8.9%. Gross margin also declined from 29.9% to 26.3%, with the drop in license margins and deteriorating profitability in support services cited as key causes.
By segment, License Sales grew solidly to 7.41 billion yen (+22.1% YoY), and SI sales rose to 745 million yen (+24.7% YoY), maintaining high growth. In contrast, Managed services declined significantly to 168 million yen (–36.0% YoY), resulting in an imbalanced revenue composition. In-house product sales remained strong at 723 million yen (+27.9% YoY), underscoring growth in the Company’s value-added domains.
Selling, general, and administrative expenses amounted to 1.91 billion yen (+21.5% YoY), rising in line with revenue growth. This reflects investments in headcount, R&D, and recruitment. While these costs are intended to enhance mid-term competitiveness, they place downward pressure on profits.
From a financial perspective, ROE stood at 12.3%, and operating cash flow improved significantly to 377 million yen (+276% YoY). Nevertheless, continued cash outflows from investing activities resulted in a relatively fragile free cash flow structure.
In summary, while revenue continues to grow, worsening profit margins have emerged as a structural issue, and improving the quality of earnings has become imperative. The sharp decline in operating profit highlights the limits of the Company’s legacy license-dependent model, reinforcing the need for a revamped profit structure.
The Company has already begun restructuring under the CEO’s leadership, advancing efforts to evolve toward a strategic partner model, establish proprietary products as profit pillars, and invest in disruptive growth opportunities. The success of these initiatives will be critical to profit recovery and capital efficiency improvement in FY2/2026.
8. Full-year performance forecast
Revenue growth, profit decline : A phase to test initial results and execution of structural reform
For the fiscal year ending February 2026, the Company forecasts consolidated net sales of 10.168 billion yen (+12.4% YoY) and operating profit of 410 million yen (–10.3% YoY). This year is the inaugural period of the mid-term management plan “Reignite 2030.” It represents a critical phase in which investors will evaluate the progress of structural earnings reform.
Sales growth is expected to be driven primarily by expanding professional services (including SI and training support) and proprietary products, reflecting a strategy to reduce reliance on license-based revenues. In particular, the Company is transitioning toward long-term contracts with strategic clients (such as major financial institutions and manufacturers), which is expected to enhance earnings visibility.
On the profitability front, efforts to improve cost-effectiveness are anticipated to yield partial results. Specifically, the following are cited as drivers of profit improvement: (1) scaling down and reviewing low-margin managed services; (2) improving SG&A efficiency through operational streamlining and automation; and (3) focusing more on high-value-added services.
While the projected profit decline (–11.1% YoY) is relatively modest, the plan still reflects a cautious approach to profit recovery. This is due to the Company’s growth strategy, which maintains upfront cost burdens, including rising personnel costs from securing engineering talent and continued investment in product development. As a result, a gap remains between the pace of sales growth and profit growth.
The Company has also stated its intention to maintain sound financial health, aiming for mid-term cash flow stabilization along with improvements in ROE and ROIC. While it plans to keep operating cash flow in positive territory and balance growth investments with shareholder returns, it has not disclosed specific cash flow forecasts or ROIC forecasts. This makes the quantitative evaluation of progress somewhat difficult.
In addition, starting in FY2026, the Company will reorganize its service categories into three axes—Technology Solutions, Professional Services, and Proprietary Products—with the aim of clarifying KPI management and profit accountability. This may lead to easier business profitability evaluations and improve the Company’s standing in the capital markets.
In conclusion, while the Company’s full-year forecast appears to be realistic and achievable, it also represents a critical juncture in which the success of structural reforms and investor confidence in execution will be tested. The success or failure of this initial year under the mid-term plan will directly impact the stock’s medium-term valuation outlook, making quarterly updates particularly important going forward.
9. Growth strategy and risk
Redesigning for quality growth : Success of three-pillar strategy and execution risks in focus
Under its April 2025 “Reignite 2030” initiative, the Company is shifting its growth strategy from quantitative to qualitative expansion. It is restructuring its business around three core pillars: (1) value-added Professional Services, (2) global monetization of in-house products, and (3) vertical industry-specific solution expansion.
The first pillar, professional services, aims to deepen industry engagement and deploy dedicated teams to increase unit prices and boost contract retention. By transitioning to a strategic partner model, particularly with enterprise clients, the Company expects to smooth revenue streams and stabilize profitability. This segment grew by 24.7% YoY in FY2/2025, establishing itself as a second revenue pillar.
The second pillar centers on strengthening overseas sales of proprietary applications. With more than 70% of sales from this segment coming from international clients, the business benefits from exchange rate resilience and scalability. Further evolution into a higher-margin model is expected through broader adoption of subscription billing, multilingual support, and added features for enterprise clients.
The third pillar involves enhancing industry-specific solution proposals for finance, manufacturing, and IT verticals. The Company is shifting from a simple tool-supply model to one grounded in solving business issues, enabling integrated offerings that combine SI and BPO services. This has opened opportunities for cross-selling and upselling.
However, several execution risks must be considered. The most prominent is resource constraints. Expanding high-value services and developing proprietary software require skilled engineers and pre-sales personnel, but tight labor market conditions heighten the risks of hiring difficulty and rising labor costs.
Another challenge lies in potential short-term earnings volatility stemming from portfolio restructuring. While scaling down inefficient and low-profit services is the right direction, it may lead to temporary revenue and profit declines. Moreover, proprietary products are susceptible to changes in market sentiment and Atlassian platform specifications, underscoring the need for resilience to external factors.
In addition, the shift in the revenue model could impact customer relationships. Price revisions or redefined service scopes may trigger churn among existing clients.
Although the growth strategy is conceptually coherent, its execution hinges on resource allocation and precise change management. Investors must monitor the Company’s quarterly disclosures for KPI-based updates and track measurable progress.
10. Stock price trends and valuation
A rebuilding growth stock left at a discount : Execution visibility as the key to revaluation
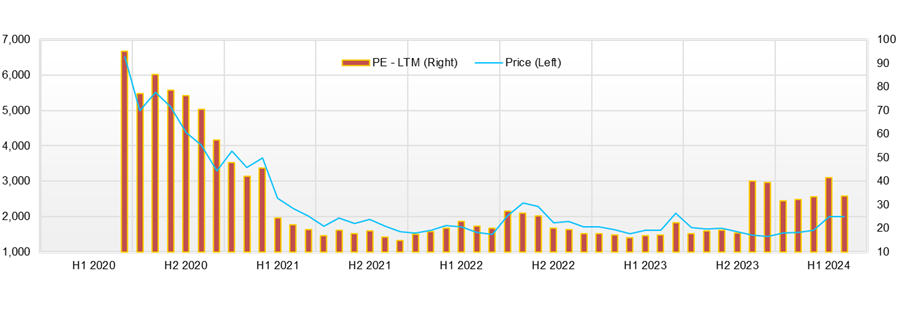
As of May 2025, the Company’s stock price has been trading in the low 800-yen range, with a year-to-date movement showing a mostly sideways to slightly downward trend. Technical indicators reveal that the RSI is hovering in the high 40s to around 50, indicating a neutral zone with neither signs of overheating nor excessive selling pressure. While the stock continues to trade slightly below its 25-day moving average, its position near the midline of the Bollinger Bands reflects both earnings uncertainty and the market’s cautious stance.
From a valuation perspective, the stock appears notably undervalued using PER and PBR with a forward PER of 11.35x and a trailing PBR of 1.18x. In particular, considering that PER multiples in the cloud services and IT professional services space typically range from 20x to 30x, the Company’s stock is significantly discounted as a “transitional phase company undergoing structural reform.”
With a market capitalization of approximately 3.6 billion yen, the Company is categorized as a small-cap, and institutional investor coverage is limited. However, given its strong cash flow generation capacity, ROE of 12.3%, and ROIC of around 10%, considerable room remains for upward valuation revision.
Short-term risks to the stock price include the following three factors:
First is the possibility of continued stagnation in profit growth. In FY2025, operating profit declined significantly by 31.1% YoY, exposing the Company’s profit structure instability. While FY2026 guidance projects a recovery to 410 million yen, if results underperform, there is a risk of renewed market disappointment.
Second is the “execution risk” related to structural reform. While the direction of Reignite 2030—focused on nurturing proprietary products and increasing the value-add of professional services—is sound, it involves multifaceted transformations across business, organizational, and human resource dimensions. Short-term friction or efficiency losses may materialize. Notably, intensifying competition for engineering hires and restructuring contract models with existing clients could result in revenue fluctuations.
Third is the issue of liquidity and supply-demand risk. With most shares held by HS Inc. and founding stakeholders, the stock has a low free float, making it more susceptible to sharp price swings driven by short-term capital flows. In volatile markets, liquidity may drive stock price movement more than fundamentals.
That said, from a mid-to-long-term perspective, the stock has substantial revaluation potential. If operating cash flow recovery, a high equity ratio (around 45%), and profit quality improvement via business portfolio restructuring progress as planned, a rerating of PER toward the 15x–20x range is within reach. The current market cap is underpinned by the Company’s proprietary global product sales alone (exceeding 500 million yen annually with high margins), suggesting the potential for a story-driven valuation uplift as segment-level disclosure improves.
In summary, the current stock price heavily reflects uncertainty from the structural reform phase. However, even without assuming a V-shaped earnings recovery, enhanced execution visibility and improvements in capital efficiency could justify a valuation re-rating. For mid- to long-term investors who can tolerate short-term volatility, the stock represents an attractive entry point with a favorable risk-return profile.
11. Conclusion from performance and valuation review
Market at a crossroads in assessing re-growth foundation : Structural shift holds the key to mid-to-long-term returns
As a technology solutions provider centered on Atlassian products, the Company has achieved consistent revenue growth over the past decade. However, since peaking in 2023, operating profit, EBITDA, and net income have slowed, placing the Company at a transitional phase marked by “revenue expansion and profit instability.”
In FY2025, revenue remained strong at 9.04 billion yen (+20.7% YoY), while operating profit declined significantly to 458 million yen (–31.1% YoY). This highlighted the urgent need for structural reform to improve earnings quality and rebuild the profit model. The Company also faces challenges in stabilizing cash flow and capital efficiency, making creating a sustainable profit model the core management priority.
To this end, the Company has initiated the “Reignite 2030” initiative, focusing on three pillars: (1) value-added Professional Services, (2) in-house products as core profit drivers, and (3) vertical solution enhancement. Strategic partner-type contracts and global sales expansion via the Atlassian Marketplace are key levers to improve profit quality and generate sustainable cash flow.
Nonetheless, near-term risks remain. These include hiring and retaining talent, navigating customer transitions amid changes to the revenue model, and external uncertainties such as currency fluctuations. Risk management will be essential across business, organizational, and market layers.
From a valuation perspective, the stock trades at a forward PER of 11.35x, PBR of 1.18x, and an ROE of 12.3%, reflecting significant market skepticism regarding growth and reform. However, a re-rating toward a PER of 15x–20x is plausible as structural transformation progresses and becomes more visible. The current 3.6 billion yen market cap is underpinned by the Company’s proprietary software segment alone, suggesting misalignment between share price and corporate value.
Overall, the Company stands at a midpoint between earnings uncertainty and revaluation potential. Investors are encouraged to adopt a phased, mid-to-long-term investment approach, monitoring the progress of structural reform and profit recovery. Should key indicators such as improved profit quality or ROIC trends emerge quarterly, a shift in market sentiment and stock rerating could materialize rapidly.
12. ROE trend and current assessment
ROE maintains double-digit levels : Sustainability hinges on structural improvement in profit quality
The Company’s return on equity (ROE) has remained above 10% in recent years, reaching 12.3% in FY2025—a relatively high level among peer-listed software firms of similar size. This suggests the Company is generating adequate returns on equity despite slowing profit growth.
Looking at long-term trends, ROE fluctuated between 18% and 24% in the early 2020s. Even after operating profit peaked in FY2/2024 and declined, ROE remained in double digits, demonstrating a balance between profitability and capital efficiency.
However, this strong ROE is partly the result of controlled equity expansion. The Company maintains a sound financial structure, with an equity ratio in the mid-45% range and essentially zero interest-bearing debt, resulting in a robust cash position. Therefore, the current ROE level is also influenced by the efficient use of cash and prudent capital accumulation. For a more accurate assessment of capital efficiency, it is essential to examine metrics such as ROIC and EVA alongside ROE.
A DuPont analysis of FY2/2025 indicates that while net profit margins declined, the ROE level was sustained by stable asset turnover and financial leverage. Although this reflects structural strength, future deterioration in profit margins could jeopardize ROE sustainability.
That said, the “Reignite 2030” plan aims to improve capital efficiency through a shift toward high-margin business models, particularly strategic partner services. This may maintain and potentially lift ROE into an upward trend if successful.
In conclusion, the Company’s current ROE is healthy and above market averages, partly supported by past profit structures and a strong cash balance. The sustainability of this performance will depend on the qualitative improvement in earnings and effective execution of the growth strategy. Monitoring changes in profit margins and free cash flow quarterly will be key to making a real-time assessment of ROE going forward.
13. ROIC and WACC-based value creation analysis
ROIC exceeds WACC, but margin is modest — company enters stage where value-added quality is critical
An evaluation of the Company’s capital efficiency using return on invested capital (ROIC) and weighted average cost of capital (WACC) shows that ROIC is estimated at approximately 10–11%, modestly exceeding the estimated WACC of around 7–8%. This indicates that the Company is generating positive economic value added (EVA), but the spread is still limited and does not yet reflect a robust excess return capacity.
Based on recent figures, the Company’s operating profit (NOPAT) after tax is estimated at approximately 320 million yen (applying a 30% effective tax rate to 458 million yen in operating profit). With invested capital (working capital + fixed assets – operating liabilities) estimated at around 3.0 billion yen, ROIC is roughly 10.7%. This level surpasses capital costs but does not provide sufficient justification to claim strong, sustained value creation.
As for WACC, considering the Company’s virtually debt-free management and an equity ratio of approximately 45%, the cost of capital is attributable primarily to equity. Assuming a beta of roughly 0.85, a risk-free rate of 1%, and a market return of about 6%, the cost of equity is estimated between 6.25% and 7.1%, making the WACC approximately the same range.
The positive difference between ROIC and WACC results in a positive EVA. However, due to the limited spread, the Company’s ability to recover its growth investments is not yet fully visualized. Rising SG&A expenses and the evolving revenue mix cast some uncertainty on the durability of ROIC going forward.
The medium-term plan aims to increase ROIC through structural reform—raising the share of high-margin proprietary products, phasing out inefficient businesses, and transitioning from project-based SI to recurring-revenue contracts. As a company whose value is primarily driven by intangible assets (human capital, brand, technical IP), demonstrating a clear correlation between capital input and excess return will be critical for earning long-term market trust.
In summary, while the Company currently exceeds WACC and creates economic value, the spread remains narrow, and more substantial evidence of sustainable competitive advantage is needed. In the quarters ahead, it will be essential to track ROIC levels, EVA growth, and reinvestment efficiency to assess the Company’s intrinsic value.
14. Free cash flow and corporate value creation from a capital allocation perspective
Free cash flow trending toward recovery but highly volatile : Precision in strategic investment and capital allocation is key
The Company’s free cash flow (FCF) significantly recovered in FY2025, with operating cash flow reaching 377 million yen (+276% YoY). However, investment cash flow and financing cash flow remained negative, resulting in continued large fluctuations in overall cash flow from year to year. This FCF volatility reflects earnings variability and the timing concentration of investments, raising concerns about the stability of value creation from a corporate valuation standpoint.
The improvement in operating cash flow was likely driven by increased revenue, tighter accounts receivable management, and cost control measures such as SG&A efficiency. However, these improvements are seen as short-term in nature, and without fundamental improvement in “profit quality,” sustained cash generation will be difficult.
Meanwhile, investment cash flow remains negative due to ongoing strategic expenditures, including investments in proprietary product development, IT infrastructure for operational foundations, and talent acquisition strengthening. While these growth investments are forward-looking and aimed at future monetization, extending the investment payback period could temporarily pressure FCF and weigh on market valuation.
As for financing cash flow, the Company has adopted a capital accumulation strategy focused on internal reserves, with limited shareholder returns such as buybacks or dividends. While the Company effectively operates debt-free and maintains high financial safety, future focus will be on how efficiently capital is redeployed to generate returns exceeding the cost of capital.
In its mid-term management plan “Reignite 2030,” announced in April 2025, the Company emphasized both “sustainable improvement in ROIC” and “linking financial strategy with growth strategy.” This suggests that a more deliberate capital allocation approach may be adopted. If the outlook for cash flow improves, the Company may consider options such as share buybacks, dividend hikes, or M&A, which could further enhance corporate value.
While free cash flow is on a recovery path, instability in the revenue model and the weight of strategic investments continue to obscure steady value creation. Through the execution of its mid-term plan, the Company must improve the linkage between profits, cash flow, and investment and achieve capital allocation optimization—this will be critical to future assessments of corporate value.
15. Shareholder returns: future potential and assessment of past practices
Cautious dividend policy and internal reserve-oriented capital strategy : Ample room for enhanced returns
Currently, the Company has limited experience with share buybacks, and the overall variety of shareholder return measures is narrow. As of the end of February 2025, treasury stock accounted for approximately 1.5% of shares outstanding (70,000 shares), with no record of proactive repurchases. This reflects a capital policy that prioritizes strengthening the financial base and preparing for future investments, characterized by a growth strategy reliant on building internal reserves.
The Company maintains a virtually debt-free financial structure, with a high equity ratio of 45%, ensuring strong economic stability. With free cash flow also on a recovery trend, there is significant potential for the Company to adopt more proactive return measures, such as raising the payout ratio or initiating share buybacks.
Although the mid-term management plan “Reignite 2030” does not specify numerical targets or concrete policies for shareholder returns, it emphasizes the balanced pursuit of capital efficiency and shareholder value. Depending on the pace of financial improvement, the Company may gradually introduce greater flexibility in its return policy.
In particular, once the current phase of growth investment stabilizes and earnings and cash flow become more predictable, a shift toward return distribution could enhance the Company’s market valuation. The Company’s historically cautious approach to shareholder returns may be seen in another light as “accumulated capacity for implementation.” If a more agile return policy were introduced, it could significantly impact investor sentiment.
While shareholder returns remain conservative, continued progress in strengthening the balance sheet and improving free cash flow makes dividend increases and share repurchases increasingly realistic. For mid-to-long-term investors, the Company’s return policy’s evolution is approaching a phase where it could serve as a meaningful catalyst for return generation.
16. Corporate valuation (DCF, PER, AND PBR analysis)
DCF indicates undervaluation, multiples remain below market averages : Success in structural reform may trigger a valuation reassessment
Based on the Company’s current performance levels and growth prospects, various valuation methods suggest that the stock is undervalued. The PER (price-to-earnings ratio) stands at 11.35x, and the PBR (price-to-book ratio) at 1.18x—both well below the averages for comparable IT services and cloud services firms listed on the TSE Growth Market, where PER typically ranges in the 20x range and PBR around 2x.
The current PER level of around 11x is interpreted as the market pricing in past periods of profit decline and concerns over growth potential. However, if operating profit and ROE show signs of recovery from FY2026 onward, a valuation rerating toward the 15x–18x range is certainly achievable. For instance, applying a PER of 15x to the FY2026 net income forecast of approximately 320 million yen yields an estimated share price of around 1,040 yen, implying a market cap of about 5.0 billion yen, suggesting meaningful upside potential from the current level.
Regarding PBR, with an ROE of 12.3%, capital efficiency is within an acceptable range compared to a cost of equity estimated at 7–8%. If structural reforms and capital policy execution become more visible, a rise in PBR toward 1.5x is also reasonable. Under this assumption, the theoretical share price would be roughly 1,050 to 1,100 yen, representing a gap of more than 30% relative to the current price in the low 800-yen range.
The Company’s DCF (Discounted Cash Flow) valuation also supports this view based on the following assumptions:
- WACC: 7.0%
- Terminal growth rate: 1.0%
- First-year FCFF: Adjusted from the operating cash flow of 380 million yen
- FCF after growth investments: Approx. 250 million yen
- Forecast FCF growth rate: 5% per year (conservative)
Based on these assumptions, corporate value is estimated at around 4.5–5.0 billion yen, suggesting a 20–30% discount relative to the current market capitalization of approximately 3.6 billion yen. Even with sensitivity analysis applied to the DCF model, valuation could expand if FCF stabilizes and WACC declines (due to improved shareholder confidence).
The current market valuation heavily reflects “execution risk during structural reform.” However, if a recovery in earnings, improved capital efficiency, and evolution in return policy all materialize, there is a high probability of rerating in both PER and PBR. On a DCF basis, the stock also appears to be priced near the lower end of its fair value range. From a mid- to long-term perspective, the Company offers considerable room for valuation normalization.
17. Peer multiple comparison analysis
Growth comparable to peers, yet profitability and multiples remain depressed : Revaluation hinges on stabilizing earnings structure
When benchmarked against peer companies, the Company demonstrates growth potential that aligns with mid-sized cloud service firms. However, its profitability and multiples suggest it trades at a significant discount.
A comparative analysis of key multiples (as of May 2025) with listed companies of similar business structures reveals the following:
| Company name | PER (Forecast) |
PBR (Actual) |
ROE | OP Margin | Sales growth rate |
Market capitalization (billion yen) |
| Ricksoft | 11.3 X | 1.18 X | 12.3% | 5.1% | +20.7% | Approx. 3.6 |
| Cybozu (4776) | Over 40 X | Over 8.0 X | 12〜15% | 6〜8% | +18-20% | Approx. 120 |
| RAKUS (3923) | Approx. 70 X | Approx.10 X | Over 20% | Over 25% | Over +25% | Approx. 600 |
| JUSTSYSTEMS (4686) | Approx. 20 X | Approx. 3.5 X | Approx. 18% | Approx. 30% | +15-20% | Approx. 200 |
| AVANT GROUP (3836) | Approx. 15X | Approx. 2 X | Approx. 13% | Approx. 10% | Approx. +10% | Approx. 50 |
- The Company’s revenue growth rate of +20.7% is on par with or slightly above industry peers.
- In contrast, its operating margin stands at 5.1%, well below peer averages of 15–30%, as seen in highly profitable models such as RAKUS and JUSTSYSTEMS.
- Its forward PER ratio in the 11x range and PBR ratio of 1.18x are markedly lower than industry norms, indicating market skepticism about earnings quality and sustainability.
With an ROE of 12.3%, the Company maintains a healthy level of capital efficiency, comparable to other cloud and IT service providers of similar scale. However, doubts about sustaining this capital efficiency will likely persist unless operating margins improve from the current 5% level.
From a valuation perspective, the Company’s PBR of 1.18x suggests it is over-discounting shareholder capital costs. Peer firms often trade at PBR multiples of 3x to 10x. If the Company’s structural reforms succeed, its revaluation potential remains substantial.
Another notable gap lies in market capitalization. While companies with similar growth profiles in proprietary products or global cloud markets are valued in the tens to hundreds of billions of yen, Ricksoft’s market cap remains just 3.6 billion yen. This reflects cautious market sentiment amid ongoing restructuring and implies significant potential for rerating if execution improves and visibility increases.
In conclusion, the Company’s peer comparison reveals a three-fold situation: growth on par, weaker profitability, and deeply undervalued equity. For investors, a constructive stance involves monitoring stabilization of earnings structure and stronger KPI disclosure through IR efforts, as these will serve as catalysts for rebuilding valuation multiples.
Key stock price data
Key financial data
| Unit: million yen | 2021/2 | 2022/2 | 2023/2 | 2024/2 | 2025/2 | 2026/2 CE |
| Sales | 4,431 | 4,308 | 5,623 | 7,491 | 9,044 | 10,168 |
| EBIT (Operating Income) | 602 | 437 | 547 | 666 | 459 | 411 |
| Pretax Income | 601 | 450 | 567 | 350 | 462 | 411 |
| Net Profit Attributable to Owner of Parent | 446 | 327 | 424 | 269 | 356 | 315 |
| Cash & Short-Term Investments | 1,944 | 2,089 | 3,071 | 3,158 | 3,297 | |
| Total assets | 3,180 | 2,939 | 4,577 | 5,971 | 6,687 | |
| Total Debt | 0 | 0 | 0 | 0 | 0 | |
| Net Debt | -1,944 | -2,089 | -3,071 | -3,158 | -3,297 | |
| Total liabilities | 1,279 | 684 | 2,103 | 3,203 | 3,658 | |
| Total Shareholders’ Equity | 1,901 | 2,255 | 2,474 | 2,768 | 3,029 | |
| Net Operating Cash Flow | 478 | 161 | 978 | 100 | 377 | |
| Capital Expenditure | 9 | 61 | 25 | 30 | 95 | |
| Net Investing Cash Flow | -8 | -47 | -27 | -37 | -140 | |
| Net Financing Cash Flow | 19 | 23 | 18 | 7 | -91 | |
| Free Cash Flow | 469 | 110 | 968 | 86 | 298 | |
| ROA (%) | 17.47 | 10.69 | 11.28 | 5.10 | 5.62 | |
| ROE (%) | 26.70 | 15.73 | 17.92 | 10.26 | 12.27 | |
| EPS (Yen) | 103.6 | 74.5 | 94.4 | 59.2 | 78.6 | 70.5 |
| BPS (Yen) | 436.6 | 507.2 | 547.4 | 608.3 | 676.1 | |
| Dividend per Share (Yen) | 0.00 | 0.00 | 0.00 | 0.00 | 0.00 | 0.00 |
| Shares Outstanding (Million shares) | 4.29 | 4.37 | 4.51 | 4.55 | 4.55 |
Source: Omega Investment from company data, rounded to the nearest whole number.
Share price
Financial data (quarterly basis)
| Unit: million yen | 2024/2 | 2025/2 | ||||||
| 1Q | 2Q | 3Q | 4Q | 1Q | 2Q | 3Q | 4Q | |
| (Income Statement) | ||||||||
| Sales | 1,572 | 1,907 | 1,819 | 2,193 | 2,047 | 2,263 | 2,289 | 2,445 |
| Year-on-year | 0.6% | 62.5% | 50.3% | 30.8% | 30.2% | 18.7% | 25.8% | 11.5% |
| Cost of Goods Sold (COGS) | 1,056 | 1,383 | 1,258 | 1,553 | 1,429 | 1,703 | 1,711 | 1,826 |
| Gross Income | 515 | 525 | 561 | 641 | 617 | 560 | 577 | 619 |
| Gross Income Margin | 32.8% | 27.5% | 30.9% | 29.2% | 30.2% | 24.7% | 25.2% | 25.3% |
| SG&A Expense | 369 | 379 | 415 | 413 | 470 | 485 | 493 | 468 |
| EBIT (Operating Income) | 146 | 145 | 146 | 228 | 148 | 76 | 84 | 151 |
| Year-on-year | -13.2% | 30.7% | 37.0% | 42.0% | 0.7% | -48.0% | -42.3% | -33.5% |
| Operating Income Margin | 9.3% | 7.6% | 8.0% | 10.4% | 7.2% | 3.3% | 3.7% | 6.2% |
| EBITDA | 152 | 151 | 153 | 235 | 155 | 83 | 97 | 167 |
| Pretax Income | 145 | -209 | 179 | 236 | 155 | 77 | 85 | 145 |
| Consolidated Net Income | 103 | -142 | 131 | 177 | 115 | 62 | 68 | 111 |
| Minority Interest | 0 | 0 | 0 | 0 | 0 | 0 | 0 | 0 |
| Net Income ATOP | 103 | -142 | 131 | 177 | 115 | 62 | 68 | 111 |
| Year-on-year | -22.7% | -262.0% | 69.3% | 40.8% | 11.9% | -143.6% | -48.5% | -37.3% |
| Net Income Margin | 6.5% | -7.4% | 7.2% | 8.1% | 5.6% | 2.7% | 3.0% | 4.5% |
| (Balance Sheet) | ||||||||
| Cash & Short-Term Investments | 2,821 | 2,838 | 3,047 | 3,158 | 3,375 | 3,442 | 3,192 | 3,297 |
| Total assets | 4,983 | 4,788 | 5,830 | 5,971 | 6,291 | 6,588 | 6,004 | 6,687 |
| Total Debt | 0 | 0 | 0 | 0 | 0 | 0 | 0 | 0 |
| Net Debt | -2,821 | -2,838 | -3,047 | -3,158 | -3,375 | -3,442 | -3,192 | -3,297 |
| Total liabilities | 2,396 | 2,336 | 3,246 | 3,203 | 3,398 | 3,661 | 3,083 | 3,658 |
| Total Shareholders’ Equity | 2,588 | 2,452 | 2,585 | 2,768 | 2,893 | 2,927 | 2,921 | 3,029 |
| (Profitability %) | ||||||||
| ROA | 9.20 | 3.88 | 4.47 | 5.10 | 4.99 | 8.53 | 7.12 | 5.62 |
| ROE | 16.57 | 6.96 | 8.83 | 10.26 | 10.26 | 18.03 | 15.31 | 12.27 |
| (Per-share) Unit: JPY | ||||||||
| EPS | 22.7 | -31.2 | 28.8 | 38.9 | 25.3 | 13.6 | 15.1 | 24.8 |
| BPS | 568.7 | 538.9 | 568.0 | 608.3 | 635.7 | 643.9 | 652.0 | 676.1 |
| Dividend per Share | 0.00 | 0.00 | 0.00 | 0.00 | 0.00 | 0.00 | 0.00 | 0.00 |
| Shares Outstanding (million shrs) |
4.54 | 4.55 | 4.55 | 4.55 | 4.55 | 4.55 | 4.55 | 4.55 |
Source: Omega Investment from company materials
Financial data (full-year basis)
| Unit: million yen | 2020/2 | 2021/2 | 2022/2 | 2023/2 | 2024/2 | 2025/2 |
| (Income Statement) | ||||||
| Sales | 3,089 | 4,431 | 4,308 | 5,623 | 7,491 | 9,044 |
| Year-on-year | 24.4% | 43.5% | -2.8% | 30.5% | 33.2% | 20.7% |
| Cost of Goods Sold | 1,904 | 2,868 | 2,779 | 3,759 | 5,249 | 6,670 |
| Gross Income | 1,184 | 1,563 | 1,529 | 1,864 | 2,242 | 2,374 |
| Gross Income Margin | 38.3% | 35.3% | 35.5% | 33.1% | 29.9% | 26.2% |
| SG&A Expense | 782 | 961 | 1,091 | 1,317 | 1,576 | 1,915 |
| EBIT (Operating Income) | 402 | 602 | 437 | 547 | 666 | 459 |
| Year-on-year | 8.3% | 49.6% | -27.3% | 25.0% | 21.7% | -31.1% |
| Operating Income Margin | 13.0% | 13.6% | 10.2% | 9.7% | 8.9% | 5.1% |
| EBITDA | 416 | 617 | 467 | 566 | 691 | 502 |
| Pretax Income | 403 | 601 | 450 | 567 | 350 | 462 |
| Consolidated Net Income | 289 | 446 | 327 | 424 | 269 | 356 |
| Minority Interest | 0 | 0 | 0 | 0 | 0 | 0 |
| Net Income ATOP | 289 | 446 | 327 | 424 | 269 | 356 |
| Year-on-year | 13.0% | 54.3% | -26.7% | 29.7% | -36.5% | 32.2% |
| Net Income Margin | 9.4% | 10.1% | 7.6% | 7.5% | 3.6% | 3.9% |
| (Balance Sheet) | ||||||
| Cash & Short-Term Investments | 1,458 | 1,944 | 2,089 | 3,071 | 3,158 | 3,297 |
| Total assets | 1,922 | 3,180 | 2,939 | 4,577 | 5,971 | 6,687 |
| Total Debt | 0 | 0 | 0 | 0 | 0 | 0 |
| Net Debt | -1,458 | -1,944 | -2,089 | -3,071 | -3,158 | -3,297 |
| Total liabilities | 484 | 1,279 | 684 | 2,103 | 3,203 | 3,658 |
| Total Shareholders’ Equity | 1,437 | 1,901 | 2,255 | 2,474 | 2,768 | 3,029 |
| (Cash Flow) | ||||||
| Net Operating Cash Flow | 316 | 478 | 161 | 978 | 100 | 377 |
| Capital Expenditure | 13 | 9 | 61 | 25 | 30 | 95 |
| Net Investing Cash Flow | -43 | -8 | -47 | -27 | -37 | -140 |
| Net Financing Cash Flow | 152 | 19 | 23 | 18 | 7 | -91 |
| Free Cash Flow | 303 | 469 | 110 | 968 | 86 | 298 |
| (Profitability %) | ||||||
| ROA | 16.97 | 17.47 | 10.69 | 11.28 | 5.10 | 5.62 |
| ROE | 23.80 | 26.70 | 15.73 | 17.92 | 10.26 | 12.27 |
| Net profit margin | 9.35 | 10.06 | 7.59 | 7.54 | 3.59 | 3.93 |
| Asset turnover ratio | 1.81 | 1.74 | 1.41 | 1.50 | 1.42 | 1.43 |
| Financial leverage | 1.40 | 1.53 | 1.47 | 1.59 | 2.01 | 2.18 |
| (Per-share) Unit: JPY | ||||||
| EPS | 68.5 | 103.6 | 74.5 | 94.4 | 59.2 | 78.6 |
| BPS | 336.0 | 436.6 | 507.2 | 547.4 | 608.3 | 676.1 |
| Dividend per Share | 0.00 | 0.00 | 0.00 | 0.00 | 0.00 | 0.00 |
| Shares Outstanding (million shrs) | 4.20 | 4.29 | 4.37 | 4.51 | 4.55 | 4.55 |
Source: Omega Investment from company materials