2026-03-12
Home
Japanese

Omega Investment Co., Ltd.
Cosmo Bio (Company note – 1Q update)

| Share price (6/25) | ¥1,160 | Dividend Yield (25/12 CE) | 4.3 % |
| 52weeks high/low | ¥888/1,229 | ROE(24/12) | 3.0 % |
| Avg Vol (3 month) | 3.2 thou shrs | Operating margin (24/12) | 3.2 % |
| Market Cap | ¥7.02 bn | Beta (5Y Monthly) | 0.1 |
| Enterprise Value | ¥3.91 bn | Shares Outstanding | 6.048 mn shrs |
| PER (25/12 CE) | 15.4 X | Listed market | TSE Standard |
| PBR (24/12 act) | 0.8 X |
| Click here for the PDF version of this page |
| PDF version |
1Q FY12/2025: Higher revenue but lower profit, generally in line with the plan. Earnings improvement is expected through productivity enhancement.
◇ Highlights of 1Q FY12/2025 results
Cosmo Bio announced its 1Q FY12/2025 results on May 9, 2025. While the results showed an increase in revenue and a decrease in profit, they were generally in line with the company’s plan.
Net sales was 3.09 billion yen (+5% YoY), operating profit was 270 million yen (-10% YoY), ordinary profit was 290 million yen (-2% YoY), and net profit attributable to owner of parent was 210 million yen (-7% YoY).
Revenue was supported by continued solid domestic demand for life science-related products and the contribution from the start of sales in the U.S. of products from the Institute of Medical Science, announced in November last year. Although the yen depreciated compared to the same period last year (actual rate: 152 yen/USD vs. 146 yen/USD in 1Q FY12/2024; full-year assumption: 152 yen/USD), the gross profit margin improved to 34.2% (+0.7pt YoY) thanks to price revisions and a higher ratio of value-added products. On the other hand, selling, general, and administrative expenses increased as expected, mainly due to personnel costs, resulting in a decline in operating profit. There were no major changes in the balance sheet, including inventories.
◇ 1H and Full-Year FY12/2025 Earnings forecasts unchanged
The company has maintained its forecasts for both the first half and full year.
Assuming an exchange rate of 152 yen/USD (vs. 149 yen/USD in FY12/2024), the company forecasts for the first half:
- Net sales of 5.5 billion yen (+7% YoY)
- Operating profit of 290 million yen (-10% YoY)
- Ordinary profit of 360 million yen (+6% YoY)
- Net profit attributable to owner of parent of 280 million yen (+8% YoY)
For the full year, the forecasts are:
- Net sales of 10.7 billion yen (+6% YoY)
- Operating profit of 490 million yen (+53% YoY)
- Ordinary profit of 580 million yen (+59% YoY)
- Net profit attributable to owner of parent of 430 million yen (+64% YoY)
The underlying assumption is that the weaker yen’s negative impact on the cost ratio and increased SG&A expenses will be offset by productivity improvements through DX, resulting in higher profits.
Dividend forecasts are also unchanged (interim dividend of 25 yen, year-end dividend of 25 yen), and the company continues its share buyback program.
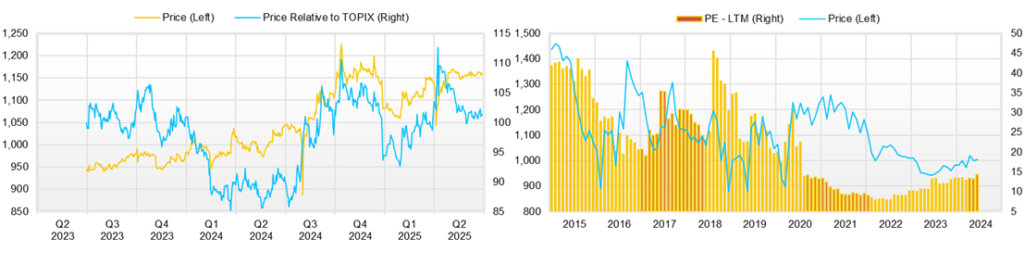
◇ Stock price trends and points to watch
The company’s stock price has been rising steadily since August 5, 2024, when initiatives set forth in “to achieve management conscious of capital costs and stock prices” were announced. Except for a temporary sharp market decline after the FY12/2024 results announcement on February 14, 2025, the share price has continued to show a gradual upward trend. It is currently trading stably around 1,150 yen.
This reflects the lack of concern about downside risk in valuation, with a reasonable forecast PER of 15.4x, a PBR of 0.7x, and a forecast dividend yield of 4.3%. Additionally, initiatives to restrain the denominator of ROE—such as a stable dividend policy and share buybacks—are underway.
Company profile
Cosmo Bio Co., Ltd. is a trading company specializing in biotechnology with the objective of ‘contributing to the advancement of life science’. It is one of the leading providers of life science research reagents, offering as many as 12 million items from approximately 500 manufacturers worldwide. In recent years, it has expanded its trading company functions globally and entered into contract services and proprietary manufacturing and sales business. Expectations are high for this contribution to earnings, improved capital efficiency and higher PBR.
Going forward, attention will shift to expanding the numerator of ROE, i.e., profits, toward achieving an ROE of 8%.
In the near term, key points include trends in the dollar-yen exchange rate (currently more favorable than assumed) and whether productivity improvements in the second half will lead to a profit recovery trend.
Furthermore, expectations are high for:
- The globalization of the trading company business using IT (strengthening exports to expand profits and reduce foreign exchange risk),
- The launch of “Scientist3,” a matching site for commissioned services
- The visualization of the potential of the Chicken Egg bioreactor business.
As these factors come together, the share price is expected to begin undergoing a valuation adjustment toward a PBR of 1x, with an ROE of 8% in sight.
Key financial data
| Unit: million yen | 2020/12 | 2021/12 | 2022/12 | 2023/12 | 2024/12 | 2025/12CE |
| Sales | 8,092 | 9,231 | 9,553 | 9,340 | 10,037 | 10,700 |
| EBIT (Operating Income) | 753 | 1,050 | 817 | 521 | 319 | 490 |
| Pretax Income | 1,008 | 1,099 | 790 | 653 | 369 | 580 |
| Net Profit Attributable to Owner of Parent | 674 | 737 | 517 | 442 | 262 | 430 |
| Cash & Short-Term Investments | 3,259 | 3,555 | 3,036 | 3,025 | 2,693 | |
| Total assets | 9,640 | 10,072 | 10,313 | 10,872 | 11,723 | |
| Total Debt | 20 | 28 | 27 | 25 | 23 | |
| Net Debt | -3,239 | -3,527 | -3,009 | -3,000 | -2,670 | |
| Total liabilities | 1,776 | 1,750 | 1,693 | 1,844 | 2,166 | |
| Total Shareholders’ Equity | 7,358 | 7,787 | 8,052 | 8,445 | 8,968 | |
| Net Operating Cash Flow | 803 | 648 | 306 | 744 | 241 | |
| Capital Expenditure | 76 | 156 | 119 | 120 | 319 | |
| Net Investing Cash Flow | 42 | -145 | -313 | -766 | -217 | |
| Net Financing Cash Flow | -97 | -420 | -236 | -201 | -479 | |
| Free Cash Flow | 767 | 617 | 251 | 677 | 25 | |
| ROA (%) | 7.27 | 7.48 | 5.07 | 4.17 | 2.32 | |
| ROE (%) | 9.49 | 9.73 | 6.53 | 5.36 | 3.01 | |
| EPS (Yen) | 113.7 | 126.9 | 89.1 | 75.8 | 45.0 | 75.5 |
| BPS (Yen) | 1,241.2 | 1,344.5 | 1,385.1 | 1,447.2 | 1,565.0 | |
| Dividend per Share (Yen) | 34.00 | 36.00 | 36.00 | 30.00 | 50.00 | 50.00 |
| Shares Outstanding (Million shrs) | 6.05 | 6.05 | 6.05 | 6.05 | 6.05 |
Source: Omega Investment from company data, rounded to the nearest whole number.
Share price
Financial data (quarterly basis)
| Unit: million yen | 2023/12 | 2024/12 | 2025/12 | ||||||
| 1Q | 2Q | 3Q | 4Q | 1Q | 2Q | 3Q | 4Q | 1Q | |
| (Income Statement) | |||||||||
| Sales | 2,828 | 1,999 | 2,050 | 2,463 | 2,943 | 2,186 | 2,280 | 2,628 | 3,093 |
| Year-on-year | -7.2% | -3.1% | 1.7% | 1.5% | 4.1% | 9.4% | 11.2% | 6.7% | 5.1% |
| Cost of Goods Sold (COGS) | 1,789 | 1,273 | 1,350 | 1,678 | 1,956 | 1,460 | 1,522 | 1,770 | 2,034 |
| Gross Income | 1,039 | 726 | 700 | 785 | 987 | 726 | 758 | 858 | 1,059 |
| Gross Income Margin | 36.7% | 36.3% | 34.1% | 31.9% | 33.5% | 33.2% | 33.2% | 32.6% | 34.2% |
| SG&A Expense | 638 | 668 | 711 | 712 | 681 | 708 | 713 | 908 | 785 |
| EBIT (Operating Income) | 401 | 58 | -11 | 73 | 306 | 18 | 45 | -50 | 274 |
| Year-on-year | -30.9% | 23.4% | -114.5% | -36.0% | -23.7% | -69.0% | -509.1% | -168.5% | -10.5% |
| Operating Income Margin | 14.2% | 2.9% | -0.5% | 3.0% | 10.4% | 0.8% | 2.0% | -1.9% | 8.9% |
| EBITDA | 435 | 94 | 28 | 112 | 336 | 50 | 79 | -10 | 308 |
| Pretax Income | 416 | 136 | 2 | 99 | 353 | 37 | 48 | -69 | 321 |
| Consolidated Net Income | 279 | 98 | 1 | 83 | 240 | 27 | 34 | -32 | 220 |
| Minority Interest | 15 | 1 | -5 | 8 | 10 | -2 | 2 | -3 | 7 |
| Net Income ATOP | 264 | 97 | 5 | 76 | 230 | 28 | 33 | -29 | 212 |
| Year-on-year | -27.9% | 136.6% | -89.4% | 20.6% | -12.9% | -71.1% | 560.0% | -138.2% | -7.8% |
| Net Income Margin | 9.3% | 4.9% | 0.2% | 3.1% | 7.8% | 1.3% | 1.4% | -1.1% | 6.9% |
| (Balance Sheet) | |||||||||
| Cash & Short-Term Investments | 3,026 | 3,852 | 3,637 | 3,025 | 2,813 | 3,224 | 3,044 | 2,693 | 2,497 |
| Total assets | 10,695 | 10,852 | 10,773 | 10,872 | 11,594 | 11,739 | 11,333 | 11,723 | 11,516 |
| Total Debt | 183 | 228 | 219 | 25 | 316 | 418 | 370 | 23 | 345 |
| Net Debt | -2,843 | -3,624 | -3,418 | -3,000 | -2,497 | -2,806 | -2,674 | -2,670 | -2,152 |
| Total liabilities | 1,865 | 1,762 | 1,772 | 1,844 | 2,101 | 1,953 | 1,853 | 2,166 | 2,160 |
| Total Shareholders’ Equity | 8,250 | 8,509 | 8,426 | 8,445 | 8,903 | 9,197 | 8,889 | 8,968 | 8,763 |
| (Profitability %) | |||||||||
| ROA | 3.91 | 4.44 | 4.12 | 4.17 | 3.66 | 3.01 | 3.31 | 2.32 | 2.12 |
| ROE | 5.13 | 5.69 | 5.24 | 5.36 | 4.76 | 3.84 | 4.23 | 3.01 | 2.77 |
| (Per-share) Unit: JPY | |||||||||
| EPS | 45.4 | 16.6 | 0.9 | 13.0 | 39.4 | 4.8 | 5.7 | -5.1 | 37.1 |
| BPS | 1,419.2 | 1,458.0 | 1,443.9 | 1,447.2 | 1,525.8 | 1,569.7 | 1,532.0 | 1,565.0 | 1,536.8 |
| Dividend per Share | 0.00 | 14.00 | 0.00 | 16.00 | 0.00 | 14.00 | 0.00 | 36.00 | 0.00 |
| Shares Outstanding(million shrs) | 6.05 | 6.05 | 6.05 | 6.05 | 6.05 | 6.05 | 6.05 | 6.05 | 6.05 |
Source: Omega Investment from company materials
Financial data (full-year basis)
| Unit: million yen | 2015/12 | 2016/12 | 2017/12 | 2018/12 | 2019/12 | 2020/12 | 2021/12 | 2022/12 | 2023/12 | 2024/12 |
| (Income Statement) | ||||||||||
| Sales | 7,357 | 7,427 | 7,068 | 7,261 | 7,590 | 8,092 | 9,231 | 9,553 | 9,340 | 10,037 |
| Year-on-year | 1.7% | 1.0% | -4.8% | 2.7% | 4.5% | 6.6% | 14.1% | 3.5% | -2.2% | 7.5% |
| Cost of Goods Sold | 4,976 | 4,655 | 4,535 | 4,607 | 4,710 | 4,940 | 5,572 | 6,112 | 6,090 | 6,708 |
| Gross Income | 2,381 | 2,772 | 2,533 | 2,654 | 2,880 | 3,152 | 3,659 | 3,441 | 3,250 | 3,329 |
| Gross Income Margin | 32.4% | 37.3% | 35.8% | 36.6% | 37.9% | 39.0% | 39.6% | 36.0% | 34.8% | 33.2% |
| SG&A Expense | 2,181 | 2,257 | 2,339 | 2,330 | 2,474 | 2,399 | 2,609 | 2,624 | 2,729 | 3,010 |
| EBIT (Operating Income) | 200 | 515 | 194 | 324 | 406 | 753 | 1,050 | 817 | 521 | 319 |
| Year-on-year | 23.5% | 157.5% | -62.3% | 67.0% | 25.3% | 85.5% | 39.4% | -22.2% | -36.2% | -38.8% |
| Operating Income Margin | 2.7% | 6.9% | 2.7% | 4.5% | 5.3% | 9.3% | 11.4% | 8.6% | 5.6% | 3.2% |
| EBITDA | 279 | 600 | 350 | 507 | 613 | 928 | 1,216 | 958 | 669 | 455 |
| Pretax Income | 407 | 456 | 400 | 403 | 388 | 1,008 | 1,099 | 790 | 653 | 369 |
| Consolidated Net Income | 249 | 276 | 250 | 278 | 246 | 701 | 768 | 552 | 461 | 269 |
| Minority Interest | 19 | 22 | 12 | 17 | 8 | 27 | 31 | 35 | 19 | 7 |
| Net Income ATOP | 230 | 254 | 237 | 260 | 237 | 674 | 737 | 517 | 442 | 262 |
| Year-on-year | 14.4% | 10.4% | -6.7% | 9.7% | -8.8% | 184.4% | 9.3% | -29.9% | -14.5% | -40.7% |
| Net Income Margin | 3.1% | 3.4% | 3.4% | 3.6% | 3.1% | 8.3% | 8.0% | 5.4% | 4.7% | 2.6% |
| (Balance Sheet) | ||||||||||
| Cash & Short-Term Investments | 1,498 | 1,948 | 1,483 | 2,268 | 2,516 | 3,259 | 3,555 | 3,036 | 3,025 | 2,693 |
| Total assets | 7,790 | 7,934 | 8,126 | 8,501 | 8,890 | 9,640 | 10,072 | 10,313 | 10,872 | 11,723 |
| Total Debt | 20 | 20 | 20 | 20 | 20 | 20 | 28 | 27 | 25 | 23 |
| Net Debt | -1,478 | -1,928 | -1,463 | -2,248 | -2,496 | -3,239 | -3,527 | -3,009 | -3,000 | -2,670 |
| Total liabilities | 1,412 | 1,350 | 1,286 | 1,445 | 1,566 | 1,776 | 1,750 | 1,693 | 1,844 | 2,166 |
| Total Sharehjolders’ Equity | 5,951 | 6,135 | 6,381 | 6,581 | 6,843 | 7,358 | 7,787 | 8,052 | 8,445 | 8,968 |
| (Cash Flow) | ||||||||||
| Net Operating Cash Flow | 129 | 573 | 294 | 909 | 569 | 803 | 648 | 306 | 744 | 241 |
| Capital Expenditure | 175 | 252 | 546 | 152 | 171 | 76 | 156 | 119 | 120 | 319 |
| Net Investing Cash Flow | -263 | 99 | -440 | -186 | -135 | 42 | -145 | -313 | -766 | -217 |
| Net Financing Cash Flow | -151 | -107 | -109 | -85 | -85 | -97 | -420 | -236 | -201 | -479 |
| Free Cash Flow | 80 | 444 | -185 | 858 | 428 | 767 | 617 | 251 | 677 | 25 |
| (Profitability %) | ||||||||||
| ROA | 2.88 | 3.23 | 2.96 | 3.14 | 2.74 | 7.27 | 7.48 | 5.07 | 4.17 | 2.32 |
| ROE | 3.83 | 4.20 | 3.80 | 4.03 | 3.55 | 9.49 | 9.73 | 6.53 | 5.36 | 3.01 |
| Net profit margin | 3.13 | 3.42 | 3.37 | 3.59 | 3.14 | 8.33 | 7.98 | 5.41 | 4.73 | 2.61 |
| Asset turnover ratio | 0.92 | 0.94 | 0.88 | 0.87 | 0.87 | 0.87 | 0.94 | 0.94 | 0.88 | 0.89 |
| Financial leverage | 1.33 | 1.30 | 1.28 | 1.28 | 1.30 | 1.30 | 1.30 | 1.29 | 1.28 | 1.30 |
| (Per-share) Unit: JPY | ||||||||||
| EPS | 38.8 | 42.8 | 40.0 | 43.9 | 40.0 | 113.7 | 126.9 | 89.1 | 75.8 | 45.0 |
| BPS | 1,003.9 | 1,034.9 | 1,076.4 | 1,110.2 | 1,154.4 | 1,241.2 | 1,344.5 | 1,385.1 | 1,447.2 | 1,565.0 |
| Dividend per Share | 16.00 | 18.00 | 14.00 | 14.00 | 14.00 | 34.00 | 36.00 | 36.00 | 30.00 | 50.00 |
| Shares Outstanding(million shrs) | 6.05 | 6.05 | 6.05 | 6.05 | 6.05 | 6.05 | 6.05 | 6.05 | 6.05 | 6.05 |
Source: Omega Investment from company materials