2026-03-12
Home
Japanese

Omega Investment Co., Ltd.
SUMIDA CORPORATION (Company note – Basic)

| Share price (7/25) | ¥995 | Dividend Yield (12/25 CE) | 5.3 % |
| 52weeks high/low | ¥757/1,070 | ROE(12/24) | 1.0 % |
| Avg Vol (3 month) | 207 thou shrs | Operating margin (12/24) | 3.1 % |
| Market Cap | ¥32.94 bn | Beta (5Y Monthly) | 0.92 |
| Enterprise Value | ¥86.74 bn | Shares Outstanding | 33.1 mn shrs |
| PER (12/25 CE) | 10.3 X | Listed market | TSE Price section |
| PBR (12/24 act) | 0.59 X |
| Click here for the PDF version of this page |
| PDF version |
A global leader in coil products. Aiming for a new leap forward through expansion into green energy-related fields
Summary
◇ Company overview: SUMIDA CORPORATION (Securities Code: 6817) is a global leader in the design and manufacturing of coil-related components and modules. The Company has established technical capabilities, versatility in application, and a global production structure, and develops custom-made contract manufacturing businesses for leading customers worldwide. The actual results for the fiscal year ending December 2024 were 143.97 billion yen in revenue and 4.51 billion yen in operating profit.
◇ Expanding coil business applications: Coils have a relatively simple structure, with wires wound into helical or spiral shapes, but exhibit a wide range of electrical and magnetic properties. As such, in electronic circuits, coils serve diverse roles including precise current control, removal of unwanted noise, selection and processing of specific signals, efficient power conversion, and conversion from electric energy to mechanical motion.
The coil market is estimated to be approximately 15.5 billion dollars in 2024, with an expected average annual growth rate of about 5%. This growth is driven by xEV adoption and the evolution of ADAS in automobiles, the spread of 5G, AI-related developments, renewable energy, and automation.
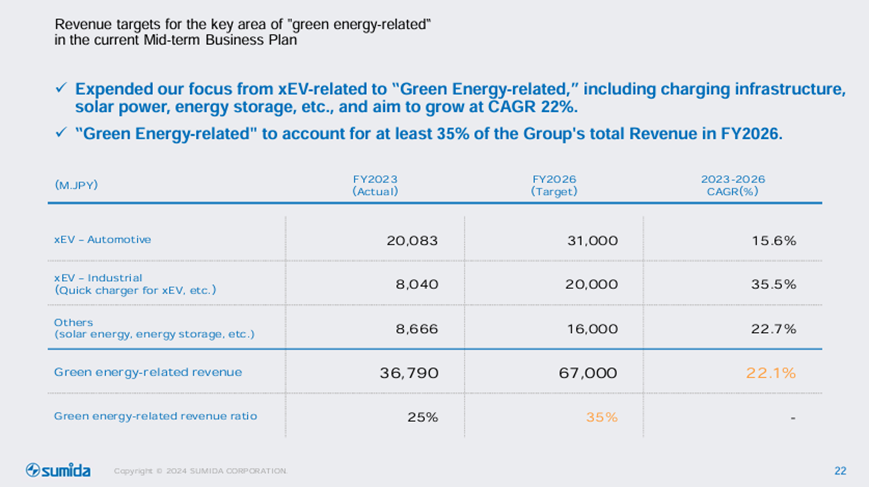
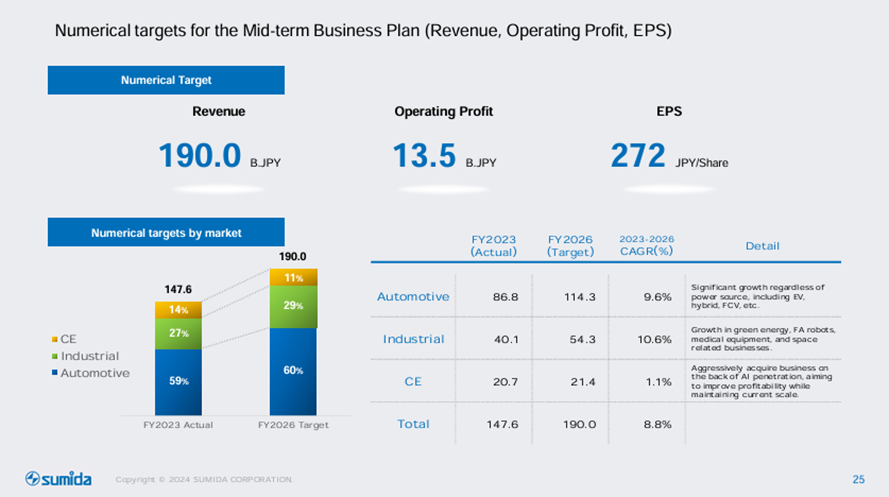
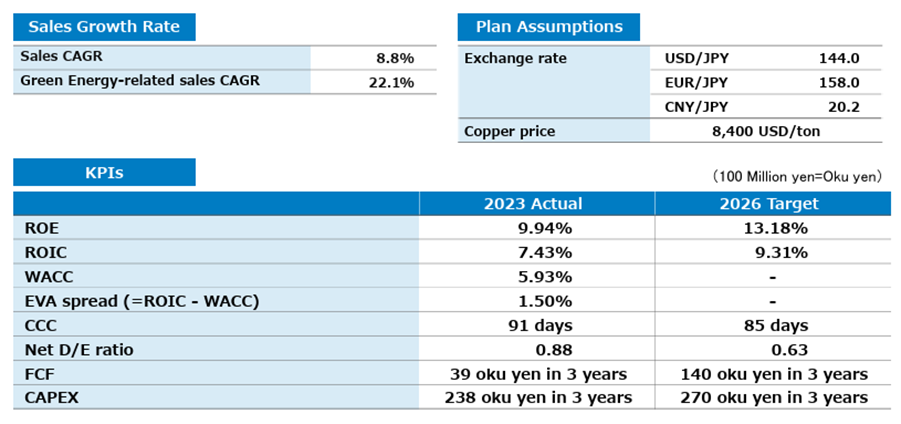
◇Mid-term business plan driven by green energy-related revenue: The Company is currently implementing the “Mid-Term Business Plan 2024–2026,” with targets for the fiscal year ending December 2026 of 190 billion yen in revenue, 13.5 billion yen in operating profit, and 8.94 billion yen in profit attributable to owners of the parent. The key driver of growth is “green energy-related,” which includes xEV-related, charging infrastructure, solar power, and energy storage. The plan is to increase revenue from green energy-related fields from 36.7 billion yen in FY2023 to 67.0 billion yen. Business strategies include strengthening the global local-to-local framework, continuing growth investments, and optimizing the cost structure. ESG initiatives and PBR enhancement measures are also incorporated.
◇ Business performance trends: In the first year of the Mid-Term Business Plan, FY2024, revenue is expected to be 143.97 billion yen (a 2.5% decrease YoY), operating profit 4.51 billion yen (a 47.3% decrease YoY), and profit attributable to owners of the parent 590 million yen (an 88.3% decrease YoY). This is due to stagnation in green energy-related demand (such as sluggish EV demand in Europe and the U.S. and delays in rapid charging network investments), as well as restrained capital investment due to continued high interest rates. However, swift efforts to strengthen the cost structure are supporting the bottom line. Meanwhile, the acquisition of green energy-related projects and revenue recognition are steadily progressing, and a dividend increase has also been implemented.
For FY2025, the Company forecasts revenue of 144.0 billion yen (flat YoY), operating profit of 7.0 billion yen (a 55.1% increase YoY), and profit attributable to owners of the parent of 3.2 billion yen (a 441.5% increase YoY). While maintaining a cautious view on the external environment, the Company aims to realize the results of cost reforms, and the first quarter progressed as anticipated. Although the business environment remains uncertain due to factors such as U.S. tariff hikes, the Company intends to respond to customer needs by further advancing its local-to-local production framework. Its proactive stance toward acquiring green energy-related projects remains unchanged.
◇Stock price trends and catalysts: Although the stock price has seen higher lows over the past ten years, the highs have also declined, forming a so-called symmetrical triangle pattern. The current PBR, based on a stock price of 995 yen, is 0.59x. Given the Company’s nimble adaptability to changes in the business environment, downside risk appears to be limited.
Since the Company’s performance tends to grow cyclically, demand will eventually recover. At that time, whether the profit amount, operating profit margin, and ROE will grow toward the targets of the mid-term business plan, and whether they can remain high thereafter, will determine the stock price’s upside potential. In addition to the growth of green energy-related revenue, attention should also be paid to exchange rate trends, raw material price movements, the impact of tariffs, and the investment appetite for decarbonization.
Table of contents
| Summary | 1 |
| Key financial data | 2 |
| Company overview | 3 |
| Corporate history/Group Overview | 3 |
| Business overview | 7 |
| Coil Market · Our Strengths | 7 |
| Long-term performance trends | 17 |
| SUMIDA CORPORATION Mid-Term Business Plan 2024–2026 | 19 |
| Earnings trends | 23 |
| FY2024 results | 23 |
| FY2025 company forecast and first quarter results | 28 |
| Stock price trends and catalysts | 32 |
| Financial data | 34 |
| Corporate data | 35 |
| Corporate profile/history | 35 |
| The top management/Corporate governance structure | 37 |
| Major shareholders/Shareholder Distribution by Shareholder | 40 |
Key financial data
| Unit: million yen | 2020 | 2021 | 2022 | 2023 | 2024 | 2025 CE |
| Sales | 84,417 | 104,920 | 138,600 | 147,672 | 143,978 | 144,000 |
| EBIT (Operating Income) | 2,300 | 5,669 | 7,983 | 8,829 | 5,633 | |
| Pretax Income | 1,470 | 3,898 | 6,534 | 5,856 | 1,295 | |
| Net Profit Attributable to Owner of Parent | 828 | 2,629 | 5,099 | 5,064 | 590 | 3,200 |
| Cash & Short-Term Investments | 5,237 | 4,237 | 2,944 | 3,107 | 4,286 | |
| Total assets | 98,063 | 117,725 | 134,846 | 142,786 | 147,766 | |
| Total Debt | 44,586 | 54,763 | 58,546 | 57,198 | 57,975 | |
| Net Debt | 39,349 | 50,526 | 55,602 | 54,091 | 53,689 | |
| Total liabilities | 63,503 | 77,622 | 85,966 | 85,471 | 86,849 | |
| Total Shareholders’ Equity | 32,990 | 38,338 | 46,829 | 55,056 | 58,648 | |
| Net Operating Cash Flow | 9,107 | 600 | 10,566 | 18,343 | 14,928 | |
| Capital Expenditure | 6,765 | 6,737 | 9,174 | 10,914 | 9,005 | |
| Net Investing Cash Flow | -6,669 | -6,712 | -8,174 | -10,702 | -8,834 | |
| Net Financing Cash Flow | -447 | 4,751 | -4,130 | -7,782 | -5,268 | |
| Free Cash Flow | 3,118 | -5,212 | 2,362 | 8,539 | 7,068 | |
| ROA (%) | 0.85 | 2.44 | 4.04 | 3.65 | 0.41 | |
| ROE (%) | 2.51 | 7.37 | 11.98 | 9.94 | 1.04 | |
| EPS (Yen) | 30.5 | 96.7 | 187.5 | 167.4 | 17.9 | 96.8 |
| BPS (Yen) | 1,213.7 | 1,409.8 | 1,722.1 | 1,687.4 | 1,774.6 | |
| Dividend per Share (Yen) | 9.00 | 28.00 | 47.00 | 51.00 | 53.00 | 53.00 |
| Shares Outstanding (Million shares) | 27.44 | 27.44 | 27.44 | 32.88 | 33.10 |
Source: Omega Investment from company materials
Company overview
SUMIDA CORPORATION: A global leader opening the future through coil technology
SUMIDA CORPORATION (Securities Code: 6817) has been a global leader in the design and manufacturing of coil-related components and modules for over 75 years since its founding in 1950. The Company leverages its advanced technical design capabilities, cultivated through many years of experience, proprietary manufacturing know-how, extensive versatility in applications, and a robust global production structure, as strengths to develop primarily custom-made contract manufacturing businesses for major customers around the world.
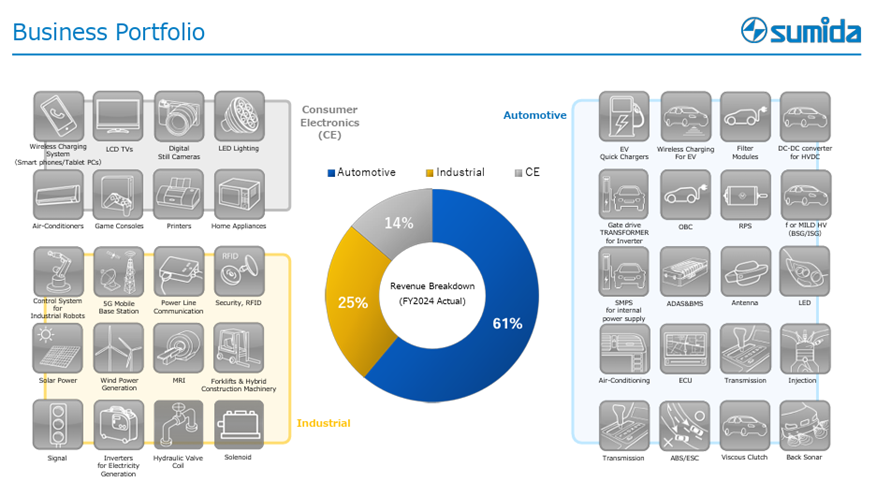
Extensive business portfolio and solid earnings base
The Company’s business is characterized by a well-balanced and diversified portfolio both geographically and by market segment.
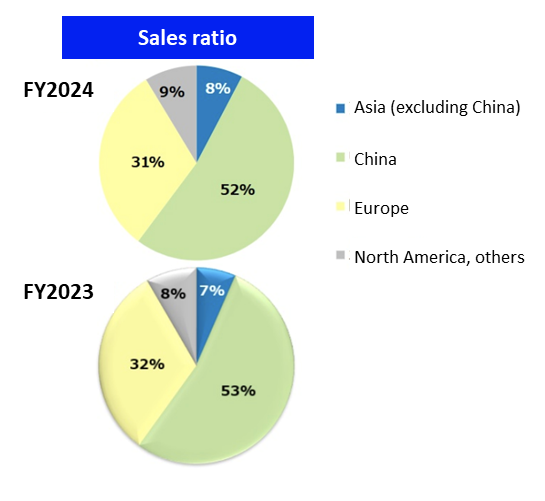
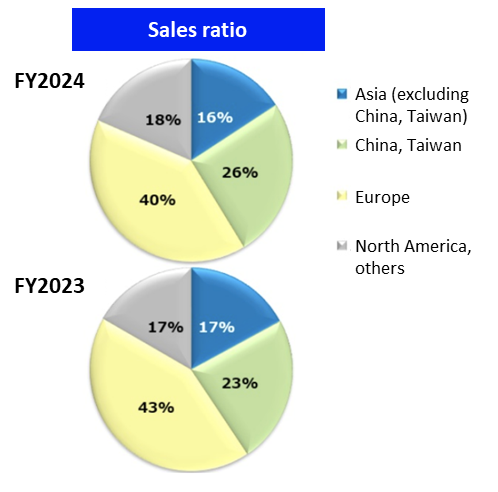
• Revenue composition by region (FY2024 estimate):
Europe: 40%
Greater China: 26%
North America: 18%
Other Asia: 16%
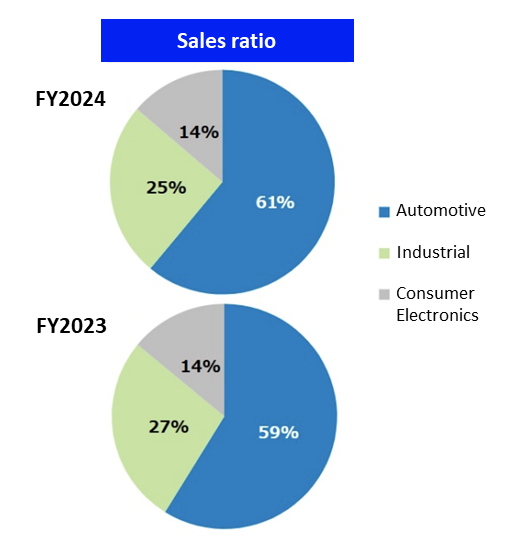
• Revenue composition by market (FY2024 estimate):
Automotive: 61%
Industrial: 25%
Consumer electronics: 14%
This extensive business deployment supports a stable earnings base.
Corporate history
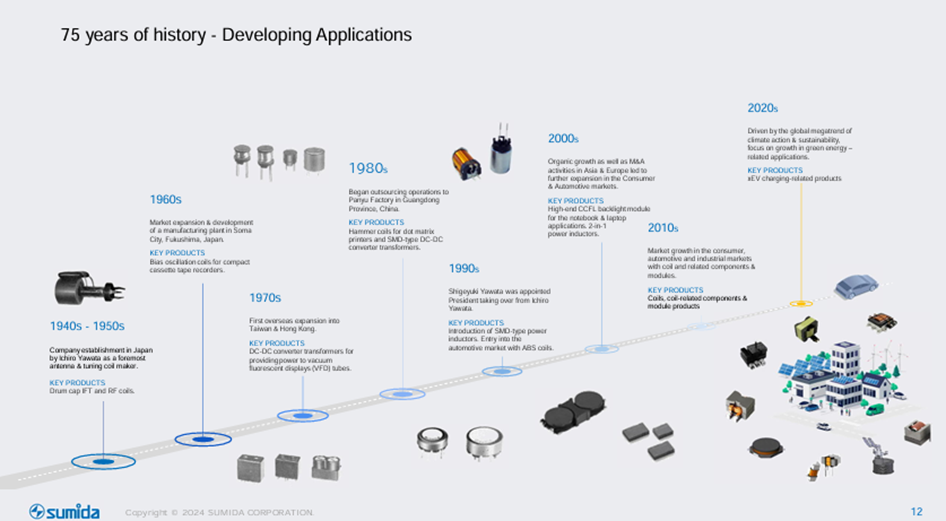
SUMIDA’s journey: A 75-year history and global expansion
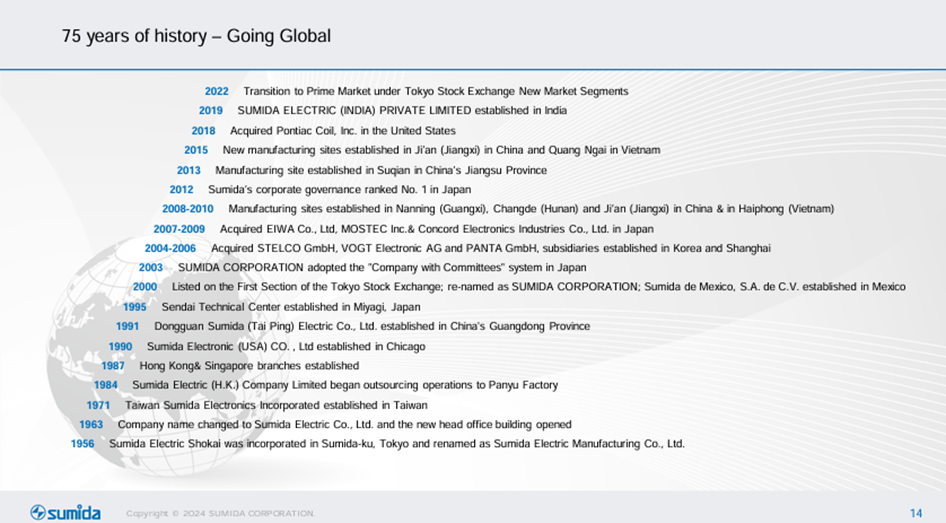
SUMIDA CORPORATION originated in 1950, when Ichiro Yawata began manufacturing coils, and was incorporated as a company in 1956. Throughout its long 75-year history, the Company has consistently promoted technological development and application development while actively pursuing global expansion. In particular, the establishment of bases in Hong Kong in 1974 and Singapore in 1987 symbolizes its early international strategy.
In the stock market, the Company was registered as an OTC stock of the Japan Securities Dealers Association in 1988, and listed on the Second Section of the Tokyo Stock Exchange in 1998. It was transferred to the First Section in 2000. It is currently listed on the Prime Market of the Tokyo Stock Exchange. This history is proof that the Company has consistently grown while responding to the trust of the market and society.
Corporate history
Source: Company materials
Source: Company materials
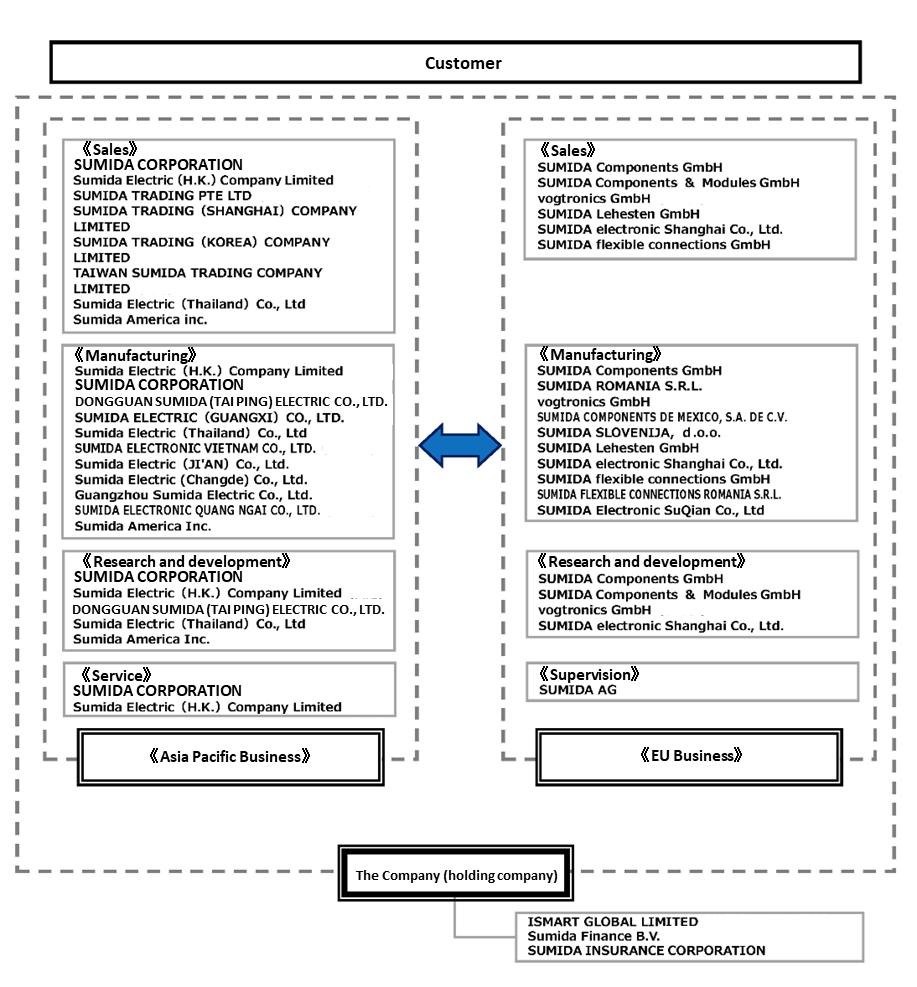
SUMIDA CORPORATION: A group structure supporting global expansion
SUMIDA CORPORATION (the Company), as a pure holding company, oversees the entire group and conducts business together with its consolidated subsidiaries in Japan and overseas. The group is based on a production, sales, and R&D structure, and has established two business segments based on geographic divisions: the “Asia Pacific Business” and the “EU Business.” The Company formulates and determines comprehensive strategies for products and services in each region. Under the control and management of the Company’s business activities, each business segment engages in research, development, design, manufacturing, and sales of coil-related components and modules incorporated into electronic equipment for various applications, including automotive, industrial, and consumer electronics.
Business operation based on “Made in Market”
One of the essential principles in the Group’s business operations is the concept of “Made in Market.” This refers to the placement of primary production and development bases in each region, as well as the development, production, and supply of products locally, tailored to meet customer needs in those regions.
Business structure diagram
Source: Company materials
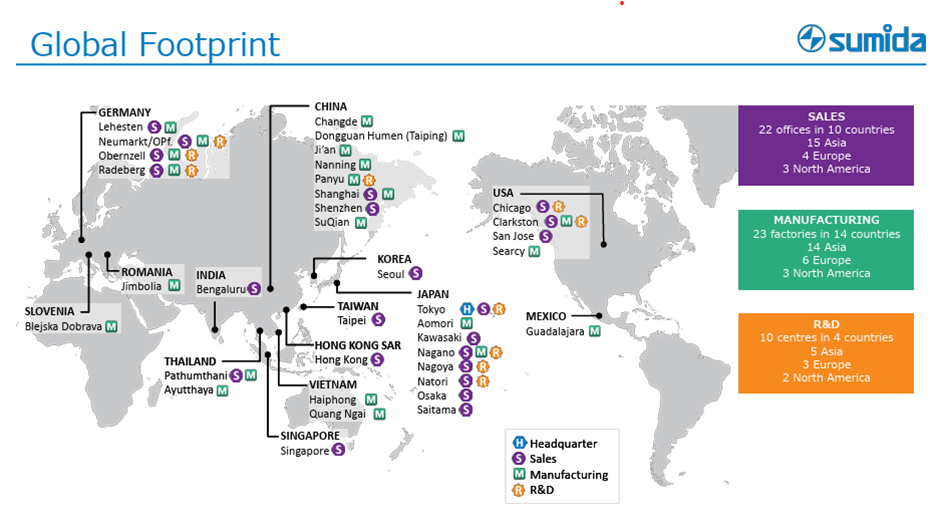
The following overview of global bases also indicates that the Made in Market strategy is being promoted.
Global footprint
Source: Company materials
Business overview
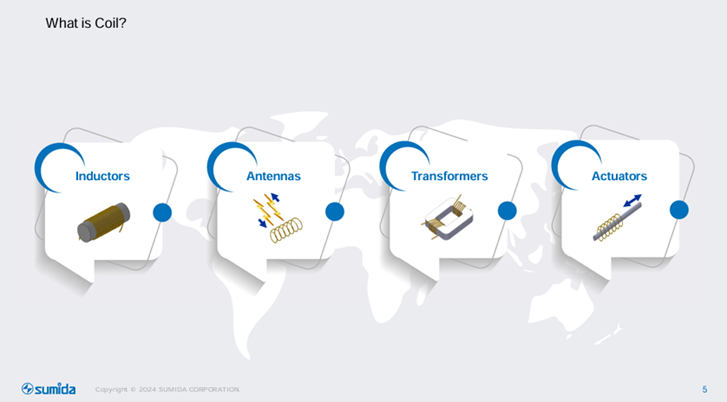
Coils: Multi-functional components supporting electronics
Coils are fundamental components indispensable to electronics. While they have a relatively simple structure consisting of wires wound into helical or spiral shapes, they possess extremely diverse electrical and magnetic properties.
Their main characteristics are as follows:
- Suppression of current variation (self-inductance effect): Coils generate a voltage (induced electromotive force) in the direction that counteracts changes in the current flowing through them. This self-inductance effect enables the smoothing of rapid current changes.
- Frequency dependence (inductive reactance): In alternating current, the higher the frequency, the greater the extent to which the coil impedes the flow of current (inductive reactance, or the apparent resistance component). This enables selective handling of signals of specific frequencies.
- Magnetic field generation capability: When current flows through a coil, it can generate a strong magnetic field efficiently.
- Energy conversion capability: Coils can temporarily store electric energy as magnetic energy and convert it back into electric energy as needed.
By utilizing these properties in combination, coils in all areas of electronic circuits, coils play a fundamental and broad role in all areas of electronic circuits, such as precise control of current, removal of unwanted noise, selection and processing of specific signals, efficient power conversion, and conversion of electrical energy into mechanical motion.
Product examples
Source: Company materials
Coil market: Market driven by automotive, 5G, AI-related, renewable energy, and automation
Steady market expansion expected
The global coil market is estimated to be approximately 15.5 billion dollars in 2024 and is projected to grow to 20 billion dollars by 2029. This corresponds to a compound annual growth rate (CAGR) of 5.2%, and steady market expansion is expected going forward.
Growth drivers
The following are the main drivers of this growth:
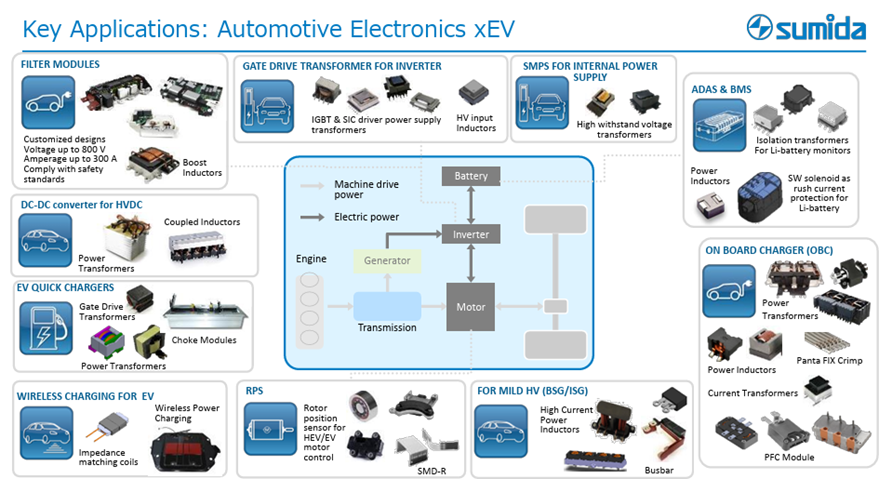
•Advancement in means of transportation, such as automobiles:
Spread of xEVs (electric vehicles): Demand is increasing for highly efficient and reliable coils in onboard chargers (OBC), battery management systems (BMS), and motor drive units.
Advancement of ADAS (Advanced Driver-Assistance Systems): As more electronic components, such as sensors and ECUs (Electronic Control Units advanced driver-assistance systems): As more electronic components, such as sensors and ECUs (electronic control units), are incorporated, demand increases for noise reduction and power stabilization.
Electrification of motorcycles, defense-specialized vehicles, ships, etc.: Demand is increasing due to the electrification of transportation means, including those other than automobiles. Especially in large cars and ships, the Company’s ability to provide customized solutions demonstrates value in terms of handling large-capacity power, durability, stability, and reliability.
- Renewable energy-related: In addition to solar and wind power generators, demand is increasing for infrastructure that stably and efficiently supplies large-capacity electricity.
- Increased demand for AI servers and data centers: Demand is rising for efficient power management and noise control in AI servers and data centers, as well as for highly reliable energy storage installed alongside data centers.
- Spread of 5G technology and increased related devices: Demand is growing due to the spread of 5G-compatible smartphones, installation of 5G base stations, and numerous IoT devices connecting to networks.
- Industrial automation and robotics: As factory automation and the introduction of industrial robots progress, demand is increasing for control and motor drive circuits embedded in these devices. This market tends to grow in conjunction with business sentiment in Chinese manufacturing, as well as the supply-demand trends of major NC machine tool manufacturers.
The Company is also expanding into the medical field, and results are anticipated. In addition, the EU’s recent expansionary fiscal policy aimed at strengthening social infrastructure is also expected to expand the Company’s business opportunities.
Competitive environment and the Company’s position
Many major players are present in the coil market. Among Japanese manufacturers, large corporations such as Murata Manufacturing Co., Ltd., TDK Corporation, TAIYO YUDEN CO., LTD., and KYOCERA Corporation have entered the market, and there are also strong competitors in North America and Greater China.
Even in such a highly competitive environment, the Company’s business scale continues to grow steadily. This is a testament to the strong support and trust the Company receives from customers for its custom responsiveness and supply capabilities.
Recognition of the business environment and response policy
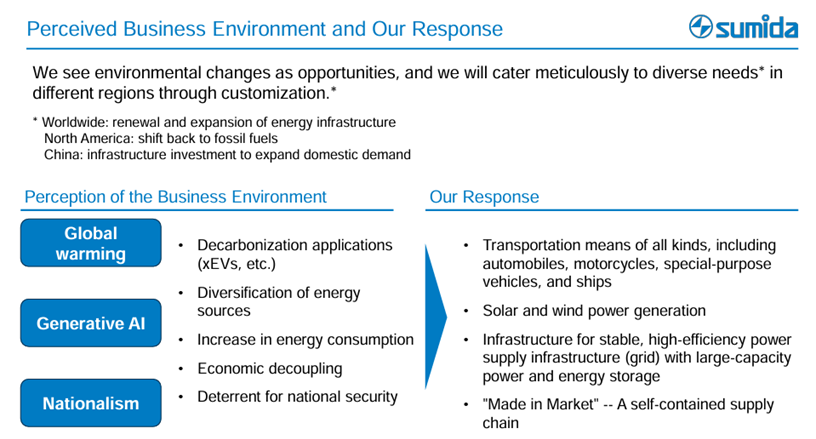
Source: Company materials
SUMIDA CORPORATION’s competitive advantage: A triune strategy of “Technological Capability,” “Versatility in Application,” and “Global Scalability”
SUMIDA CORPORATION, a global leader in the coil industry, has an unwavering strength in the integrated pursuit of the three elements of “Technological Capability,” “Versatility in Application,” and “Global Scalability,” through mutual coordination.
SUMIDA CORPORATION’s strengths
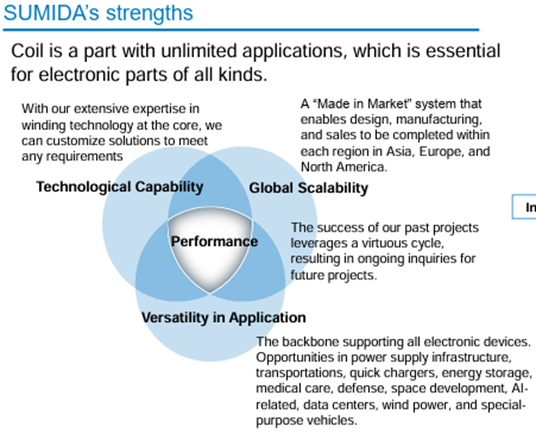
Source: Company materials
Since “Versatility in Application” and “Global Scalability” have already been confirmed, let us now examine the Company’s outstanding “Technological Capability,” which serves as the foundation for realizing these advantages.
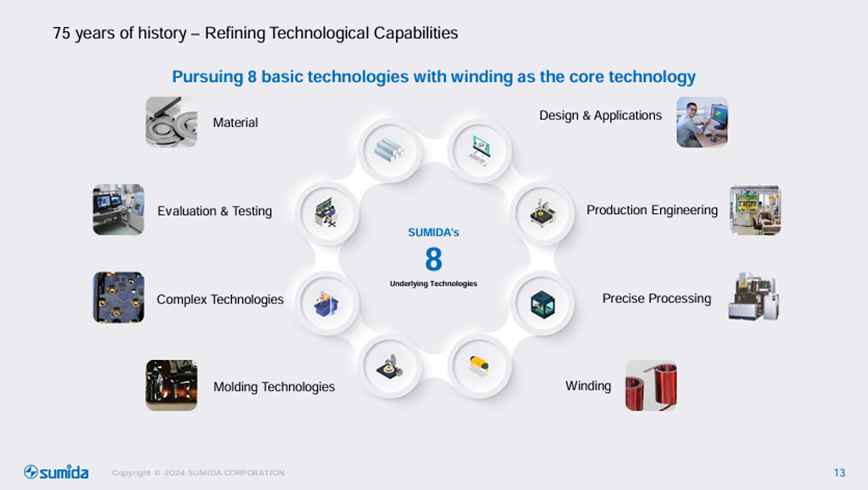
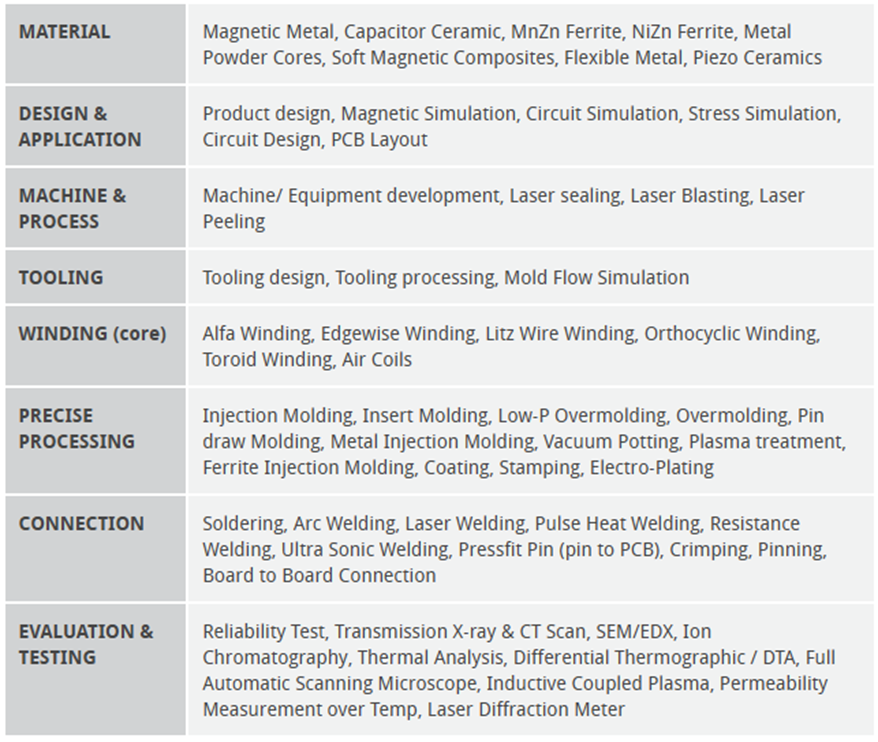
Technological capability: Eight elemental technologies centered on winding technology
The foundation supporting the aforementioned “Versatility in Application” and “Global Scalability” is the Company’s outstanding “Technological Capability,” which consists of the following eight elemental technologies centered on winding:
- Winding
- Material
- Design & Application
- Production Engineering
- Precise Processing
- Connection
- Molding technologies
- Evaluation & Testing
The Company’s strength lies in the “Combined Technologies” that arise from the integration of this wide range of elemental technologies. By fully utilizing this “Combined Technology,” the Company promotes technologically driven, innovative design and manufacturing, serving as the driving force behind the continuous supply of custom products that meet the complex demands of a diverse range of customers.
Eight elemental technologies
Source: Company materials
Source: Company materials
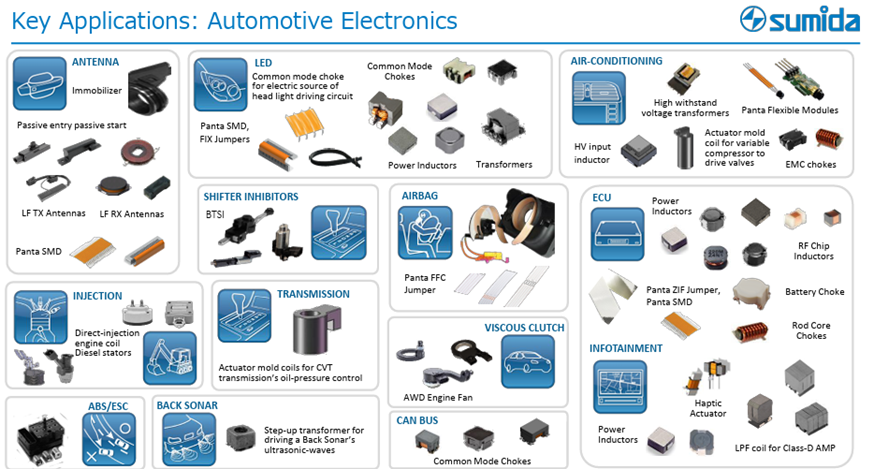
SUMIDA CORPORATION’s key products: High-value-added solutions covering a wide range of applications
By fully leveraging its outstanding versatility in application, the Company handles a wide variety of products. The Company’s key products include the following high-performance electronic components and modules:
•Electronic components and module products:
Power inductors: Core components that contribute to power circuit stabilization and efficiency improvement.
Transformers: Various types of transformers are used for voltage conversion and insulation.
•Automobile-related products:
Keyless entry antennas for automobiles: Antennas used in innovative entry systems.
Xenon igniters: Components that control the lighting of HID lamps.
•Telecommunications and IoT-related products:
Components for mobile communication devices: Various components are incorporated into smartphones and other devices.
RFID tags: Tags supporting contactless communication technology.
•Energy and industrial-related products:
Components for power inverters for solar power generation: Support efficient power conversion.
•Components for industrial lighting equipment:
Components embedded in lighting systems for industrial sectors.
In addition to these key products, the Company also provides electronic materials and components, including magnetic materials, ceramics, and flexible connectors, as well as EMS (electronics manufacturing services), fulfilling its role as a comprehensive solution provider that meets the diverse needs of its customers.
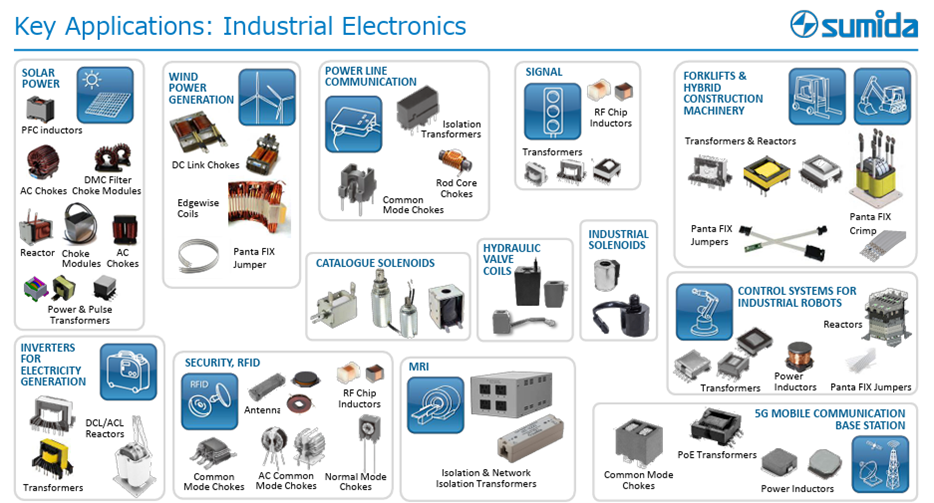
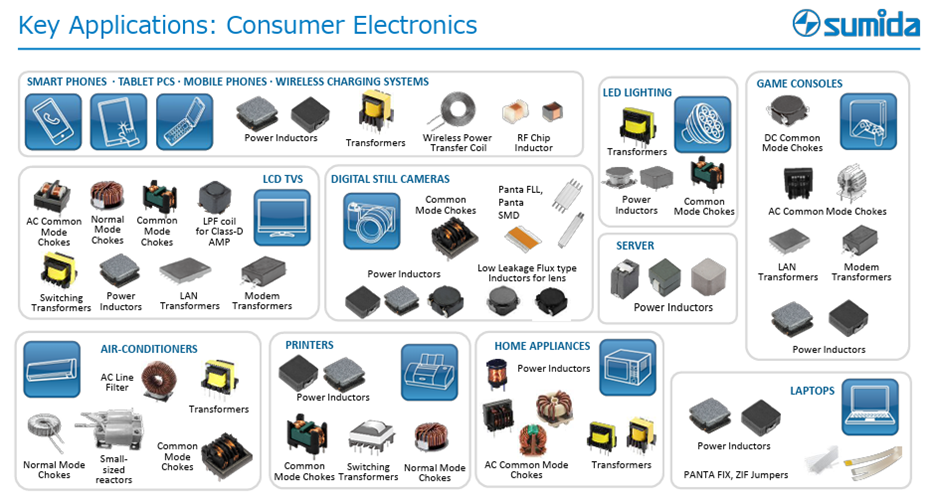
Key products
Source: Company materials
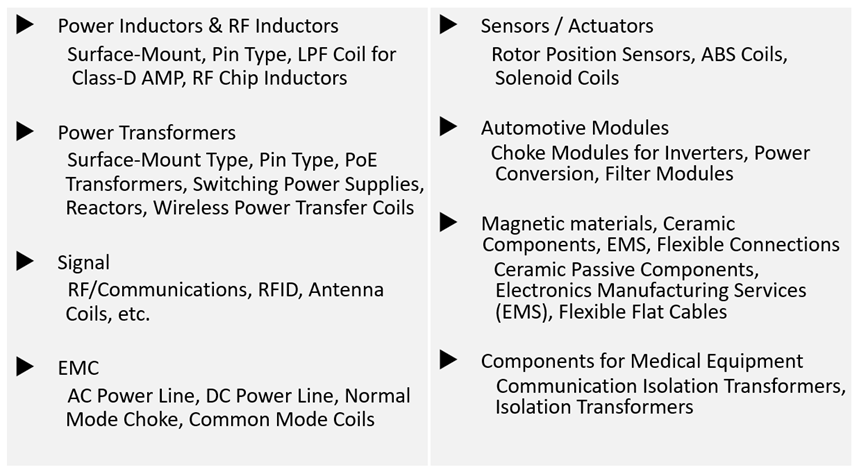
We next confirm the breadth of product offerings by strategic focus area.
Key product groups by strategic focus area
Source: Company materials
Source: Company materials
Source: Company materials
Source: Company materials
SUMIDA CORPORATION’s business model: Custom product proposals and project acquisition as a leading indicator
A characteristic of the Company’s business model is that it actively proposes high-value-added custom products and connects them to orders. The flow of acquiring custom product projects is as follows:
Flow of the custom product project acquisition
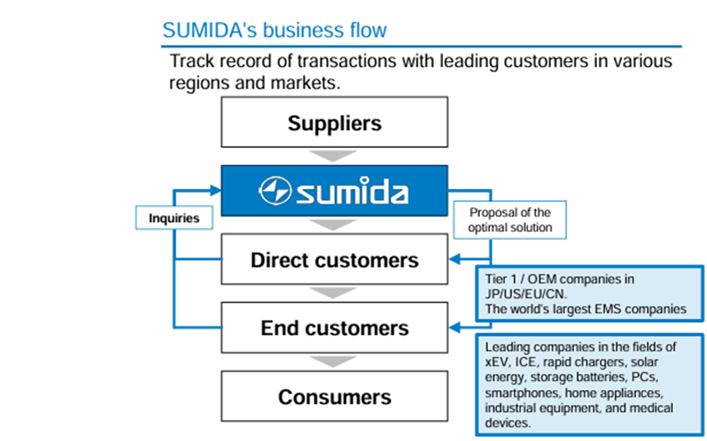
Source: Company materials
Time axis of business development and the importance of leading indicators
A crucial aspect of understanding the Company’s business development is that, from project acquisition to actual revenue recognition, each product market has its own unique lead time. In addition, once production has started. Furthermore, even after production has begun, there is a unique time frame for sales revenue trends depending on the product market.
Trends in custom product orders from acquisition to revenue recognition by product market
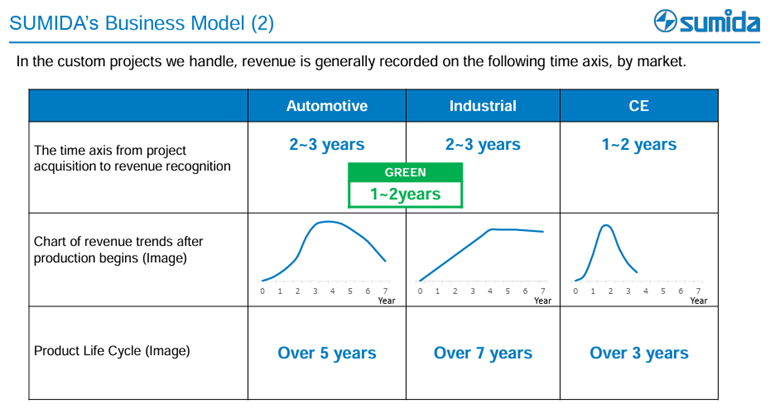
Source: Company materials
Viewed differently, this characteristic means that the trend in current project acquisition value serves as a strong leading indicator of the Company’s revenue trends several years ahead. Therefore, in forecasting the Company’s performance, particular attention is paid to the trend of newly acquired projects. This also reflects the fact that the Company is not simply supplying parts, but is deeply involved in the customer’s product development cycle from an early stage, building long-term partnerships.
Segment structure
The Company’s reportable segments are classified into two based on region. Figures for the fiscal year ending December 2024 are as follows (revenue is for external customers):
•Asia Pacific Business
Revenue: 89.4 billion yen, Segment profit: 3.1 billion yen
•EU Business
Revenue: 54.4 billion yen, Segment profit: 2.6 billion yen
Additionally, the revenue composition by end-use market—automotive, industrial, and consumer electronics—is also shown below.
Revenue composition by market (FY2024)
Source: Company materials
Long-term performance trends
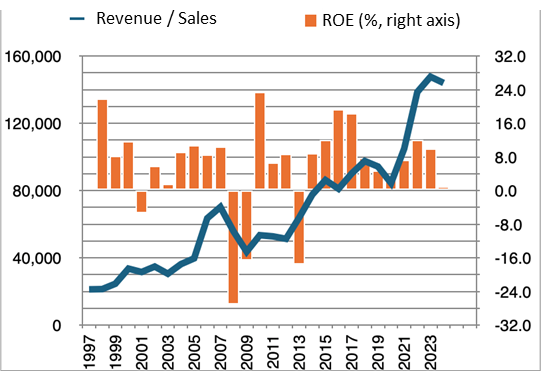
To analyze the mid-term business plan currently being promoted, a review of the Company’s long-term performance trends is provided. Below are the performance trend data from FY1997 through FY2024 (fiscal year ending December 2024), with amounts in millions of yen. Although the accounting standard transitioned from Japanese GAAP to IFRS in FY2017, the figures are presented as-is for the sake of analytical continuity.
From this long-term data, the following key points can be observed:
Positive aspects: Sustainable growth orientation and establishment of a profit base
•Strong growth orientation and revenue expansion: Over an extended period, the Company has actively pursued capital investment and asset expansion, accompanied by continuous growth in revenue. This suggests a clear growth strategy and responsiveness to the market by the Company.
Long-term performance trends
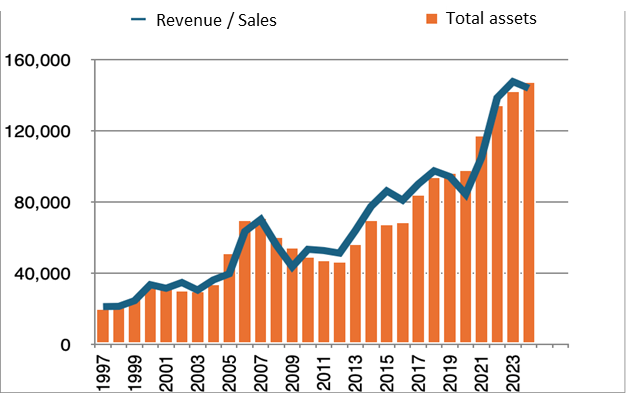
Source: Company materials, Factset
•Cyclical growth in operating profit: Except for FY2009, the Company has consistently remained profitable. Although there are fluctuations from year to year, overall, the Company has maintained a steady growth trajectory and established a “Cyclical Growth” model, continuing to grow despite being affected by economic fluctuations.
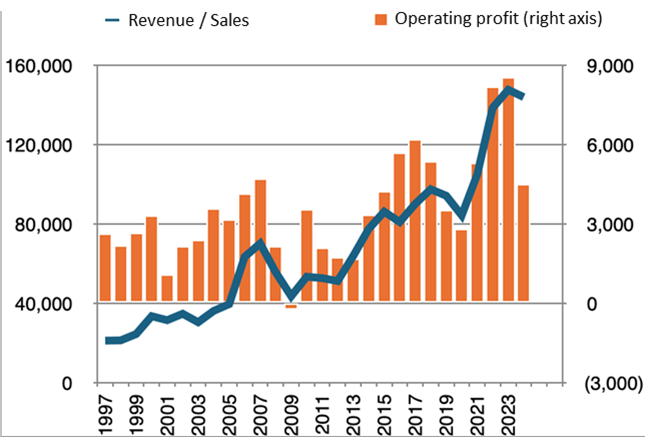
Source: Company materials, Factset
Challenges: Focus on improving profitability and capital efficiency
Challenges in operating profit margin and maintenance of EBITDA margin: The EBITDA margin has generally remained in the 10% range, which is a favorable sign indicating stable cash flow generation by the business. However, the operating profit margin has remained around 5% over the past ten years and has declined slightly compared to earlier periods. One factor is that increased depreciation resulting from aggressive growth investments has negatively impacted the operating profit margin. Going forward, if the Company can stabilize the operating profit margin in the 5% to 10% range through appropriate pricing policies and thorough cost management, it would lead to a more desirable profit structure.
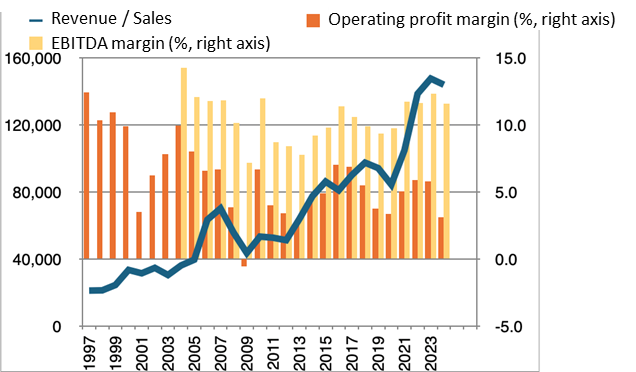
Source: Company materials, Factset
•High volatility in ROE: The Company recognizes its cost of equity at approximately 9%. Against this, ROE (return on equity) through FY2024 stands at a 10-year average of 9.5% and a 5-year average of 6.6%. Therefore, from a long-term average perspective, the Company can be said to have met shareholder expectations, but the 5-year average falls short of the required level. Moreover, the volatility is substantial (for example, from 12% in FY2022 down to 1.1% in FY2024), and investors are forced to regard this volatility as a risk factor. While the Company has diversified its customer base into the automotive, industrial, and consumer electronics markets, it cannot avoid the impact of demand fluctuations in the end products of each market, and eliminating ROE fluctuations is difficult. However, as noted earlier, if the operating profit margin level can be lifted, the average ROE will also rise, which would, in turn, reduce the degree of risk stemming from ROE volatility. Accordingly, in evaluating the mid-term business plan currently underway, a key point will be how effectively the Company is addressing these issues of profitability and capital efficiency.
Source: Company materials, Factset
Mid-Term Business Plan (2024–2026): Strategic Focus Area “Green Energy-Related”
Source: Company materials
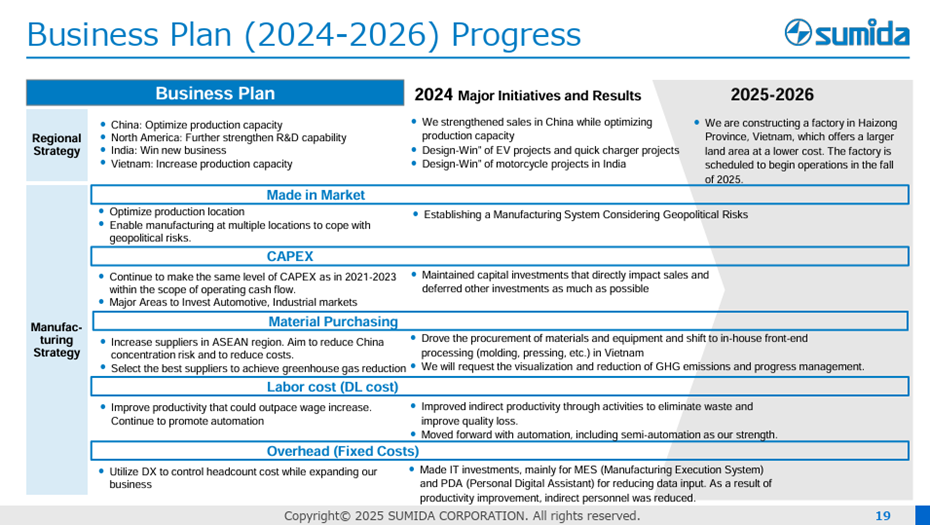
Mid-Term Business Plan (2024–2026): Regional Strategy

Source: Company materials
Mid-Term Business Plan (2024–2026): Manufacturing Strategy
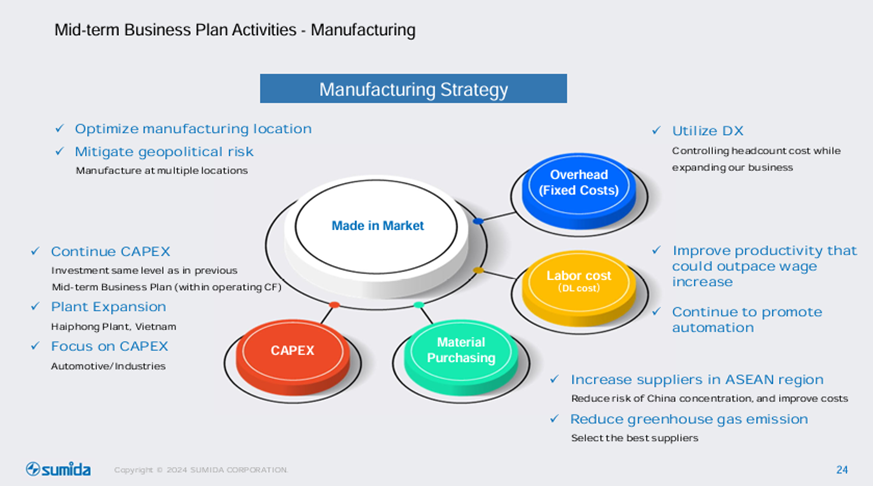
Source: Company materials
Mid-Term Business Plan (2024–2026): Regional Strategy
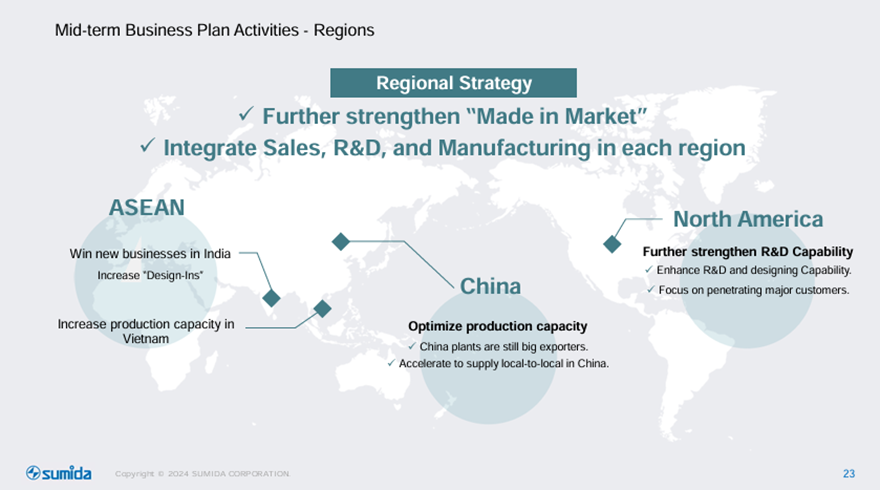
Source: Company materials
Mid-Term Business Plan (2024–2026): Numerical Targets
Source: Company materials
Source: Company materials
Earnings trends
FY2024 results: First year of the mid-term plan faced headwinds, prompt response toward securing profitability
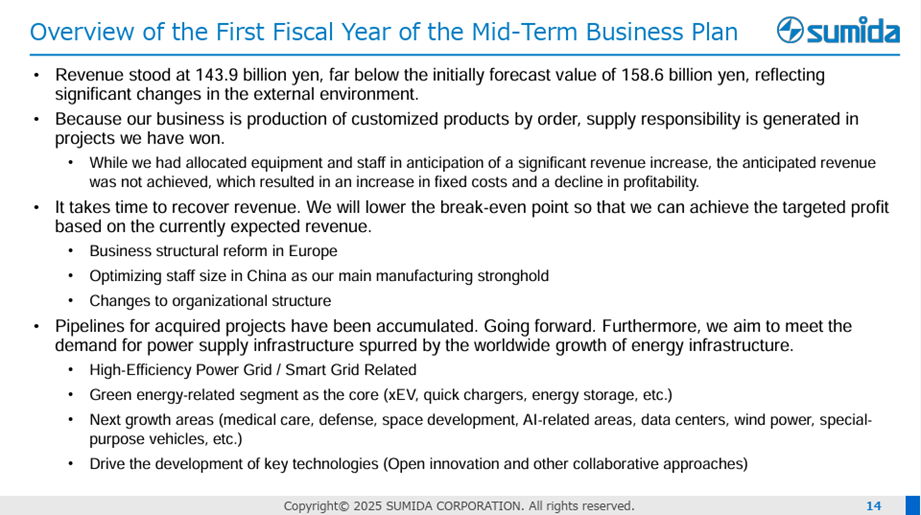
The consolidated financial results for the fiscal year ended December 2024, which marked the first year of the mid-term business plan, showed a decline in revenue and profit after two downward revisions from the initially planned revenue and profit increase.
FY2024 consolidated financial results:
- Revenue: 143.97 billion yen (down 2.5% YoY)
- Operating profit: 4.51 billion yen (down 47.3% YoY)
- Profit before income taxes: 1.29 billion yen (down 77.9% YoY)
- Profit attributable to owners of the parent: 590 million yen (down 88.3% YoY)
- Operating profit margin: 3.1% (down 2.7 percentage points YoY)
- ROE (return on equity): 1.0% (down 8.9 percentage points YoY)
Factors behind sluggish performance
The primary cause of this revenue and profit decline lies in the headwinds across the overall business environment. In particular, stagnant demand in green energy-related areas (such as the stagnation in EV demand in Europe and the U.S. and delays in investment in rapid charging networks), as well as continued high interest rates leading to restrained capital investment, negatively impacted revenue. At the same time, due to the nature of the Company’s custom product contract manufacturing business, it was necessary to maintain a certain level of fixed costs to fulfill supply responsibilities. These combined factors led to a significant decline in profit.
Factors to be positively evaluated
Despite the harsh business environment, the following points should be positively noted:
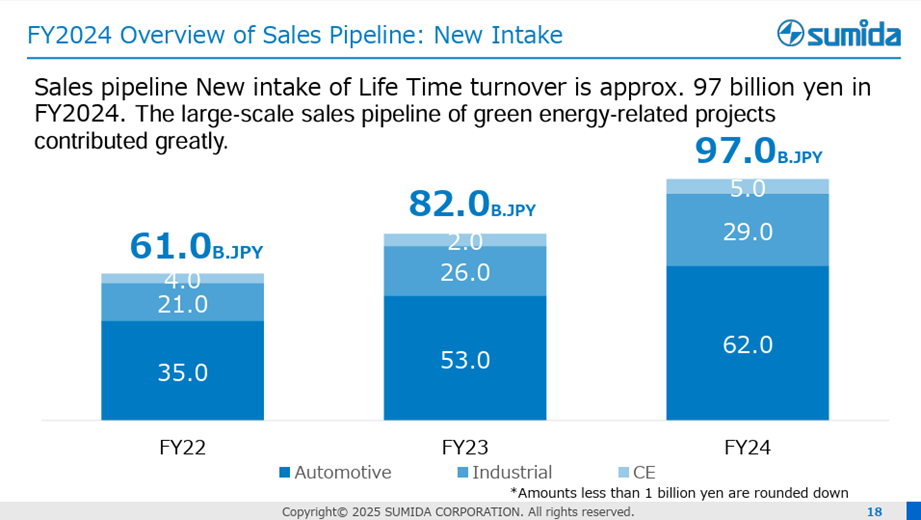
- Steady accumulation of project acquisitions: Newly acquired projects in FY2024 reached 97.0 billion yen (an increase of 15.0 billion yen YoY), and especially large-scale projects in the green energy-related field were steadily secured.
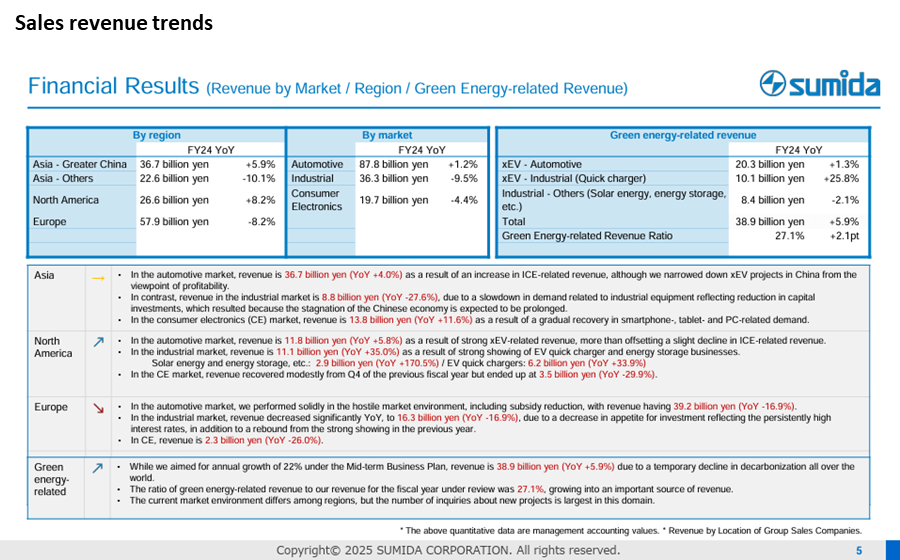
- Increase in green energy-related revenue: Revenue in the green energy-related field totaled 38.9 billion yen in the fiscal year (up 5.9% YoY). While this fell short of the initial plan, it represents steady revenue growth in a key focus area.
- Prompt response to changes in the business environment: Despite being the first year of the mid-term plan, the Company responded quickly and appropriately to adverse external headwinds by promoting reductions in fixed costs in Europe and China and limiting capital investment to truly essential items.
- Thorough inventory management: Inventory turnover days in FY2024 stood at 85 days, only one day higher than the previous year, indicating continued strict inventory management.
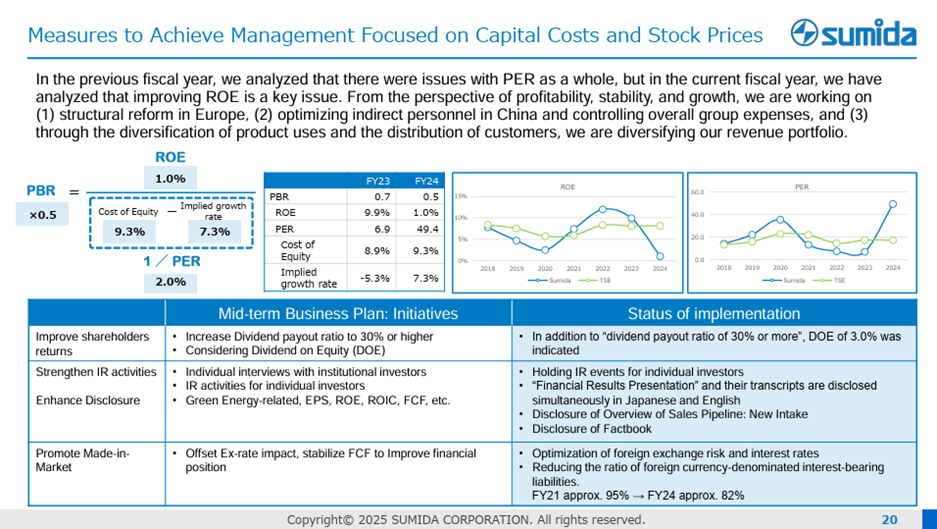
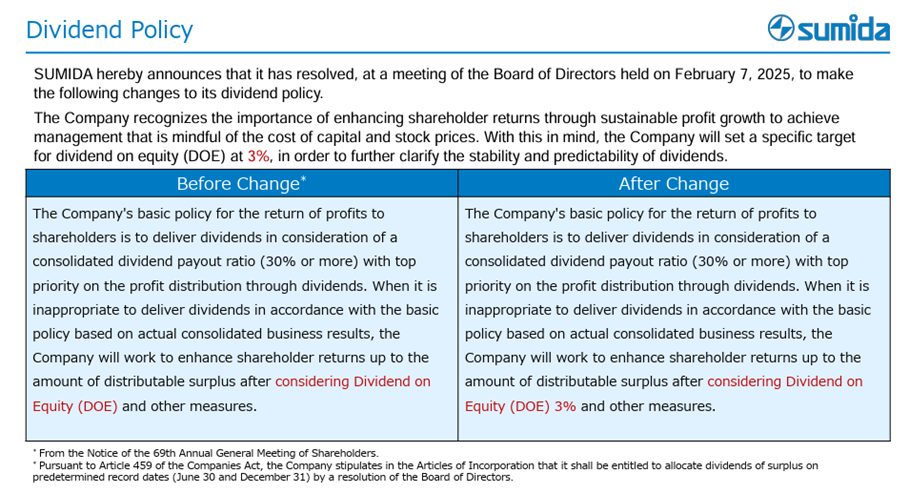
- Enhanced shareholder returns: Despite a significant drop in profit, the FY2024 dividend per share was maintained at 53 yen, the level indicated at the beginning of the fiscal year (a 2-yen increase from the previous year). Furthermore, as of FY2025, the Company has introduced a concrete guideline of 3% for DOE (dividend on equity), which serves as a reference indicator in its dividend policy. It has been indicated that this will be operated in conjunction with the existing standard of a dividend payout ratio of 30% or higher. As a result, the FY2025 dividend per share is also planned to be maintained at 53 yen, demonstrating a strong commitment to shareholder returns.
From these points, it is evident that the Company is responding to a harsh external environment through strategic project acquisition, growth in focus areas, swift management decisions, and a strong awareness of shareholder returns.
Source: Company materials
Operating profit increase/decrease analysis
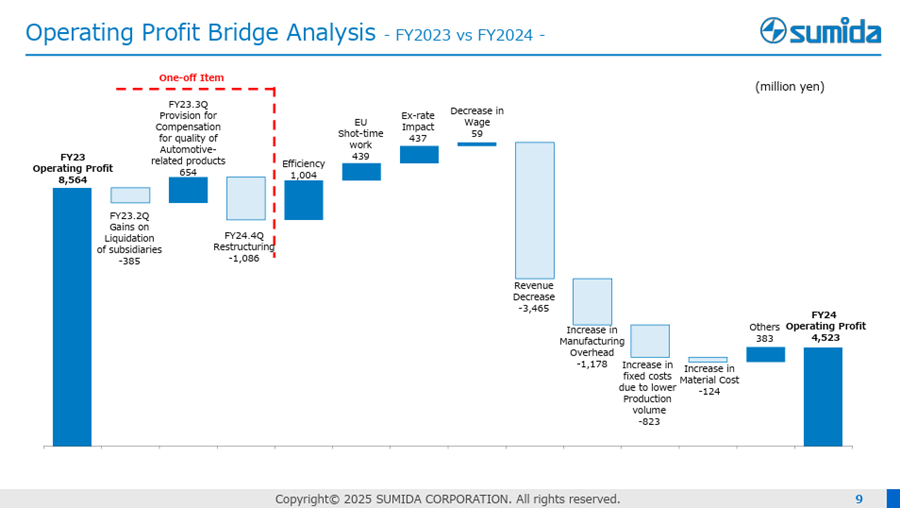
Source: Company materials
Overview of FY2024
Source: Company materials
Progress of Mid-Term Business Plan
Source: Company materials
Progress in acquired projects
Source: Company materials
Measures for conscious management of capital costs and stock prices
Source: Company materials
New dividend policy
Source: Company materials
FY2025 company forecast and first quarter results: Profit recovery strategy under adverse conditions
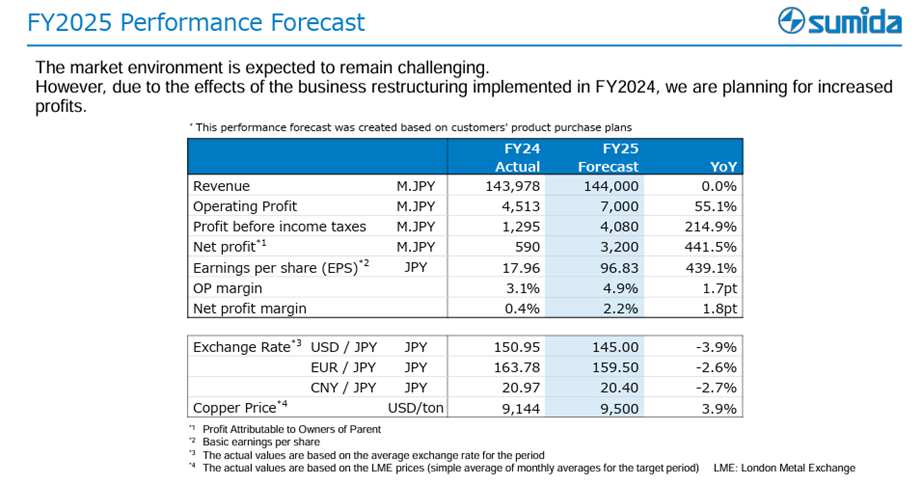
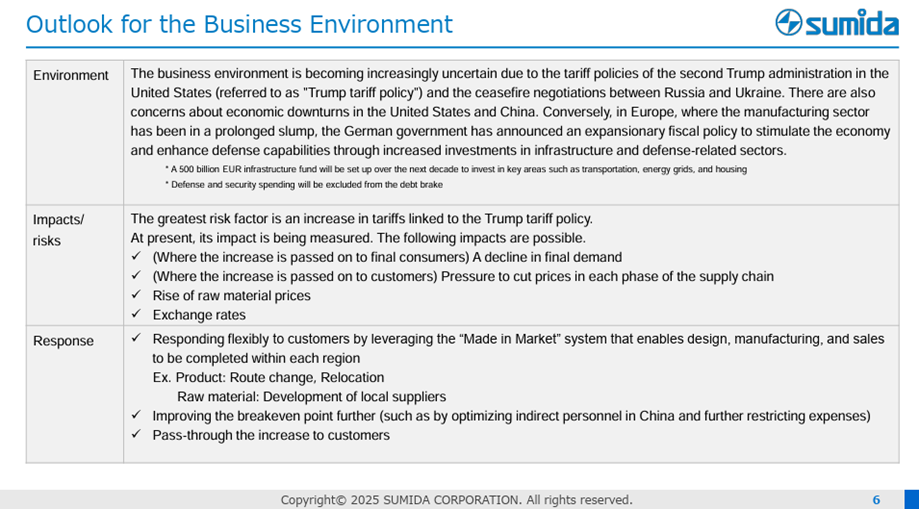
In FY2025, the second year of the Mid-Term Business Plan, the Company anticipates a substantial increase in profit, despite flat revenue, based on the effects of business structure reforms implemented in the previous year, while continuing to recognize a challenging business environment.
Given the continued cautious stance toward green energy-related investment, uncertainty surrounding U.S. tariff hikes, and rising geopolitical tensions in various regions, this forecast premise is reasonable. However, the potential impact of tariff policies under a second Trump administration has not been fully considered.
FY2025 consolidated earnings forecast (Company projection):
- Revenue: 144.0 billion yen (flat YoY)
- Operating profit: 7.0 billion yen (up 55.1% YoY)
- Profit before income taxes: 4.08 billion yen (up 214.9% YoY)
- Profit attributable to owners of the parent: 3.2 billion yen (up 441.5% YoY)
- EPS: 96.83 yen (up 439.1% YoY)
- Dividend per share: 53 yen (unchanged YoY)
- Operating profit margin: 4.9% (up 1.7 percentage points YoY)
- Capital expenditure: 8.6 billion yen (up 9.4% YoY)
FY2025 company forecast
Source: Company materials
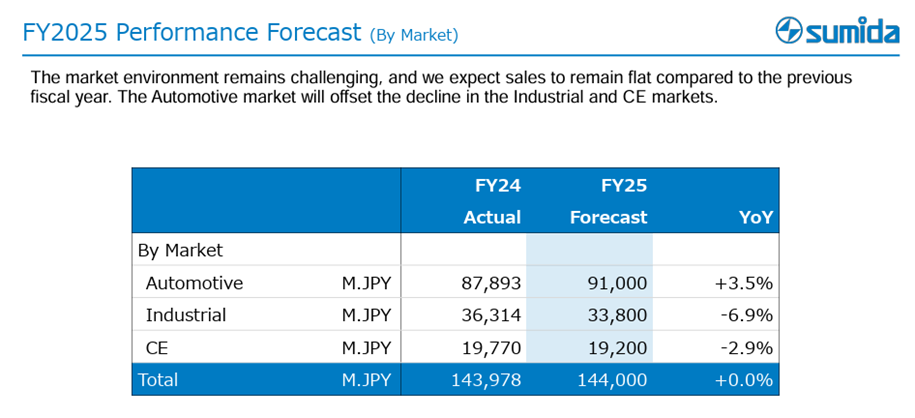
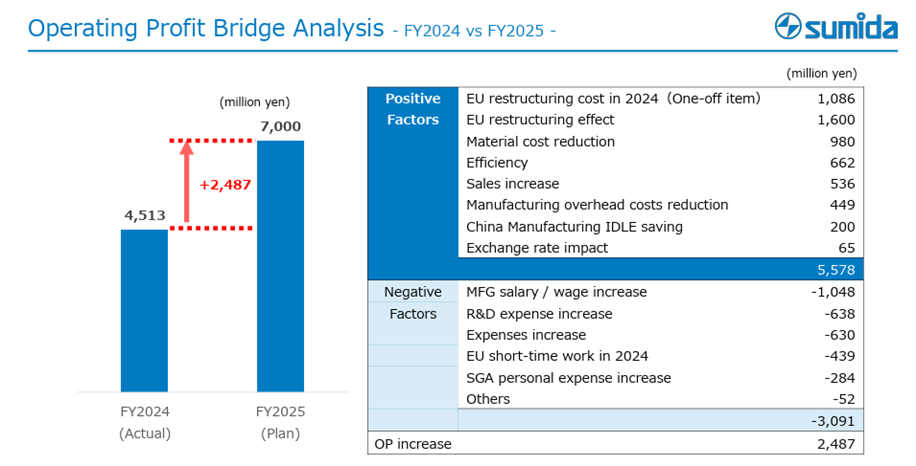
In the revenue forecast by market, steady growth in the automotive segment is expected to offset declines in the industrial and consumer electronics markets, resulting in flat overall revenue. The significant increase in operating profit is based on the assumption that the effects of structural reforms in Europe implemented in FY2024, optimization of manufacturing overhead costs in China, reductions in raw material costs, and improvements in production efficiency will exceed increases in labor costs and R&D expenses.
Revenue forecast by market
Source: Company materials
Factors affecting operating profit
Source: Company materials
FY2025 1Q results: In line with expectations and key evaluation points
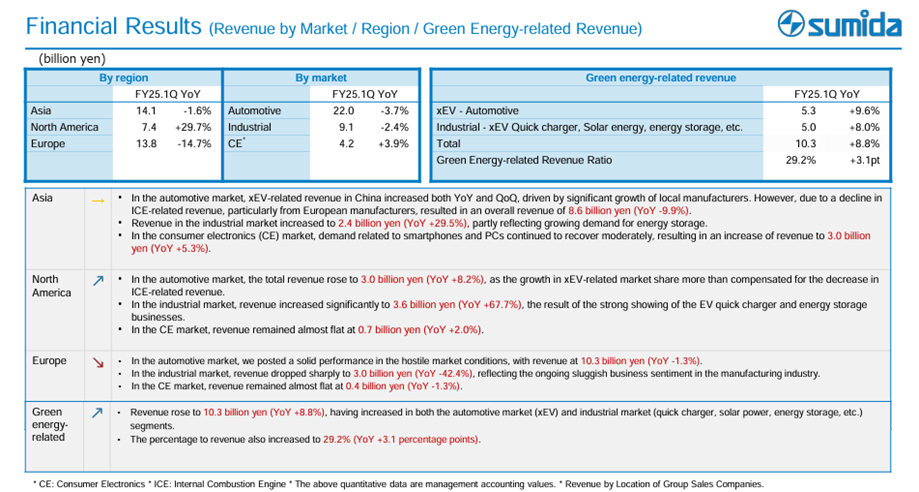
The consolidated financial results for the first quarter, announced on April 30, 2025, showed a slight decrease in revenue but an increase in profit, confirming that performance is progressing in line with the full-year earnings forecast.
FY2025 1Q (three months ending March 2026):
- Revenue: 35.39 billion yen (down 2.5% YoY)
- Operating profit: 1.23 billion yen (up 3.6% YoY)
- Profit before income taxes: 800 million yen (up 72.6% YoY)
- Profit attributable to owners of the parent: 580 million yen (up 68.1% YoY)
Background of revenue decline:
Regionally, both Asia and Europe, which represent significant portions of total revenue, posted declines. By market, the core automotive and industrial segments also recorded lower revenue. This suggests that external headwinds persist.
Revenue trends
Source: Company materials
Evaluation points:
While the result of a profit increase despite lower revenue is noteworthy, the following essential points support this outcome:
- Realization of restructuring effects: The business structure reform in Europe and the optimization of manufacturing overhead in China, both implemented in the previous fiscal year, reliably supported profit through cost reduction.
- Strong revenue from the strategic focus area of green energy-related business: In the first quarter, green energy-related revenue was 10.3 billion yen, representing an 8.8% YoY increase, maintaining solid growth. This indicates that the growth driver of the Mid-Term Business Plan is functioning steadily.
- Preparation for uncertain factors such as “Trump Tariffs”: The Company is actively preparing to address such uncertainties by leveraging its made in market framework as outlined in the Mid-Term Business Plan. This includes improving profitability, passing on costs to customers, and strengthening customer responsiveness.
- Thorough inventory management: As of the end of the first quarter, inventories declined YoY, suggesting that appropriate inventory control is proving effective.
While there are some signs of brightness in parts of Europe, the overall business environment remains highly uncertain. Particularly, there are concerns regarding the uncertainty associated with U.S. tariff hikes and persistent geopolitical risks. In this context, the Company’s swift realization of restructuring effects and its proactive preparations for future risks can be said to have a very significant impact in easing investor concerns.
Outlook and countermeasures regarding the business environment
Source: Company materials
(Reference) Impact of exchange rates on profit and loss
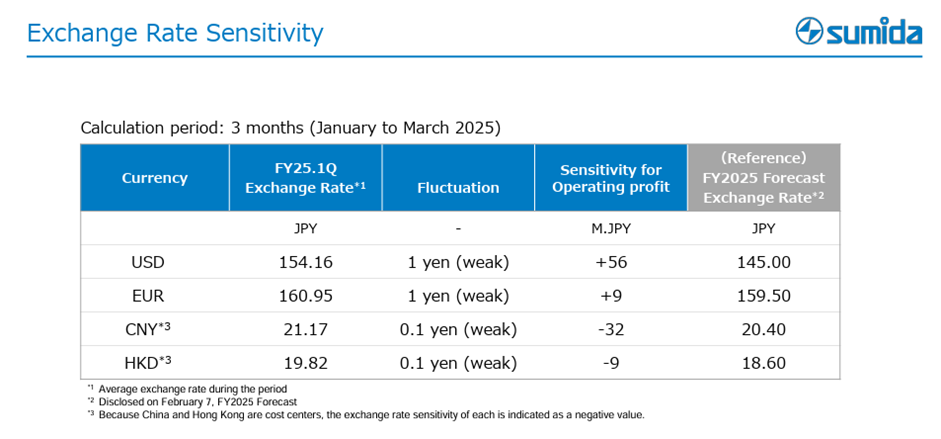
Source: Company materials
Stock price trends and catalysts
Stock price trends: Gap between earnings growth and ROE
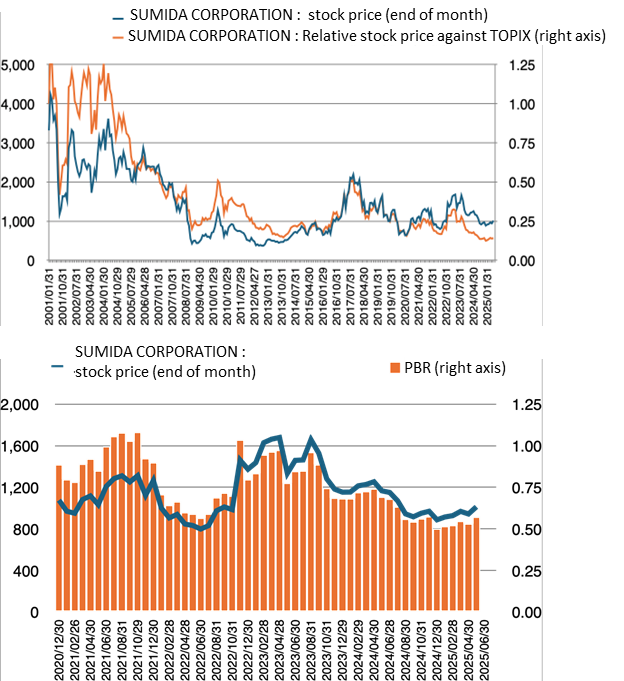
The Company’s stock price was relatively high during the 2000s. Still, over the past decade, it has formed a so-called symmetrical triangle pattern within a range between a lower bound of around 700 yen and an upper bound exceeding 2,000 yen.
As for the lower bound of the stock price, it has been gradually rising, given that the PBR has remained well below 1x and the Company has demonstrably maintained profitability through agile management even when the business environment deteriorated.
On the other hand, regarding the upper bound, the stock price reached a high of 1,797 yen between FY2022, when the Company recorded its highest-ever profit, and FY2023. However, this did not surpass the previous high of 2,400 yen in FY2017.
Such stock price movements are inconsistent with the Company’s business performance to date, which has seen revenue expand steadily and operating profit follow a cyclical growth trajectory.
Background of stock price stagnation: ROE challenges
The main reasons for the sluggish stock price are, as previously noted, the stagnation in the level of ROE without an upward trend, and the high volatility of ROE.
The average ROE over the past five years was 6.57%, and compared to the Company’s estimated cost of equity capital of around 9%, it is difficult to say that shareholder expectations are being fully met. Even though the Company achieved ROEs likely exceeding the cost of equity capital, 11.9% in FY2022 and 9.9% in FY2023, its PBR did not significantly exceed 1x during this same period, clearly highlighting the issue.
Given these conditions, investors likely regard the Company’s “insufficient average level of ROE” and “its high volatility” as risk factors, which in turn are considered to be suppressing the upper bound of the stock price.
Stock price catalysts
Based on the above, the focus going forward will be on how much the stock price responds and rises during the next phase of demand recovery. Simply put, the key points will be whether, during the next earnings recovery phase, the stock price can break out of the recent symmetrical triangle pattern, whether the PBR will recover to 1x along with ROE recovery, and whether the PBR will stabilize at a high level thereafter.
To that end, the following are considered to be key catalysts:
- Fundamental improvement of the profit structure and enhancement of profit margins: The key will be whether the Company can thoroughly control fixed costs and improve the contribution margin, thereby building a more substantial profit base that exceeds the final operating profit margin target of 7.1% in the Mid-Term Business Plan when demand recovers. This would raise expectations for profit growth.
- Raising and stabilizing the ROE level: By stabilizing the operating profit margin at a high level, the average level of ROE (return on equity) can also be raised, while its volatility can be reduced. This would lower investor risk and enhance evaluation of the Company’s value.
- Ongoing accumulation of project acquisitions: It is essential to steadily accumulate the value of newly acquired projects, a leading indicator for the Company, in line with the Mid-Term Business Plan. In particular, attention should be paid to the trend in green energy-related project acquisitions.
- Completion of the made in market framework and strengthening risk resilience: In response to uncertainties such as U.S. tariff risks and geopolitical risks around the world, the key will be whether the Company can fully establish a made in market framework with regional autonomy and build a robust supply chain and production system. This would enhance the Company’s stability and reliability.
- Clear progress toward achieving the Mid-Term Business Plan’s numerical targets: It is essential to demonstrate steady progress and a clear path toward the specific numerical targets stated in the new Mid-Term Business Plan, which include 190.0 billion yen in revenue and 13.5 billion yen in operating profit, through quarterly performance results, to gain market trust and support.
The Company has accurately identified the issues related to the points listed above, and its countermeasures are reflected in the initiatives of the Mid-Term Business Plan and the cost reforms of FY2024. Considering the Company’s agile management approach, there is a strong likelihood that positive developments will emerge in these areas, warranting close attention to future developments.
Attention to risk factors
Fluctuations in exchange rates, prices of key raw materials such as copper, and changes in global investment appetite toward green energy-related projects may affect the Company’s performance and thus require careful monitoring.
Financial data
| Unit: million yen | 2015 | 2016 | 2017 | 2018 | 2019 | 2020 | 2021 | 2022 | 2023 | 2024 |
| (Income Statement) | ||||||||||
| Sales | 86,236 | 81,052 | 90,153 | 97,538 | 94,283 | 84,417 | 104,920 | 138,600 | 147,672 | 143,978 |
| Year-on-year | 11.2% | -6.0% | 11.2% | 8.2% | -3.3% | -10.5% | 24.3% | 32.1% | 6.5% | -2.5% |
| Cost of Goods Sold | 71,628 | 66,191 | 75,019 | 82,192 | 81,414 | 73,319 | 89,563 | 119,298 | 126,561 | 125,970 |
| Gross Income | 14,608 | 14,861 | 15,134 | 15,346 | 12,869 | 11,098 | 15,357 | 19,302 | 21,111 | 18,008 |
| Gross Income Margin | 16.9% | 18.3% | 16.8% | 15.7% | 13.6% | 13.1% | 14.6% | 13.9% | 14.3% | 12.5% |
| SG&A Expense | 10,371 | 8,507 | 8,837 | 9,694 | 9,330 | 8,798 | 9,688 | 11,319 | 12,282 | 12,375 |
| EBIT (Operating Income) | 4,237 | 6,354 | 6,297 | 5,652 | 3,539 | 2,300 | 5,669 | 7,983 | 8,829 | 5,633 |
| Year-on-year | 26.7% | 50.0% | -0.9% | -10.2% | -37.4% | -35.0% | 146.5% | 40.8% | 10.6% | -36.2% |
| Operating Income Margin | 4.9% | 7.8% | 7.0% | 5.8% | 3.8% | 2.7% | 5.4% | 5.8% | 6.0% | 3.9% |
| EBITDA | 8,443 | 9,251 | 9,574 | 9,660 | 8,848 | 8,247 | 12,337 | 16,103 | 18,190 | 16,655 |
| Pretax Income | 2,932 | 5,469 | 5,697 | 4,061 | 2,184 | 1,470 | 3,898 | 6,534 | 5,856 | 1,295 |
| Consolidated Net Income | 2,188 | 3,844 | 4,628 | 2,531 | 1,596 | 839 | 2,695 | 5,168 | 5,102 | 434 |
| Minority Interest | 156 | 178 | 123 | 110 | 13 | 11 | 66 | 68 | 37 | -156 |
| Net Income ATOP | 2,032 | 3,666 | 4,504 | 2,420 | 1,582 | 828 | 2,629 | 5,099 | 5,064 | 590 |
| Year-on-year | 51.0% | 80.4% | 22.9% | -46.3% | -34.6% | -47.7% | 217.5% | 94.0% | -0.7% | -88.3% |
| Net Income Margin | 2.4% | 4.5% | 5.0% | 2.5% | 1.7% | 1.0% | 2.5% | 3.7% | 3.4% | 0.4% |
| (Balance Sheet) | ||||||||||
| Cash & Short-Term Investments | 3,569 | 3,546 | 5,375 | 4,098 | 3,286 | 5,237 | 4,237 | 2,944 | 3,107 | 4,286 |
| Total assets | 67,876 | 69,007 | 84,366 | 94,277 | 96,561 | 98,063 | 117,725 | 134,846 | 142,786 | 147,766 |
| Total Debt | 33,879 | 30,611 | 35,836 | 40,206 | 43,646 | 44,586 | 54,763 | 58,546 | 57,198 | 57,975 |
| Net Debt | 30,310 | 27,065 | 30,461 | 36,108 | 40,360 | 39,349 | 50,526 | 55,602 | 54,091 | 53,689 |
| Total liabilities | 49,207 | 46,982 | 54,242 | 58,835 | 61,963 | 63,503 | 77,622 | 85,966 | 85,471 | 86,849 |
| Total Shareholders’ Equity | 17,411 | 20,629 | 28,570 | 33,829 | 33,013 | 32,990 | 38,338 | 46,829 | 55,056 | 58,648 |
| (Cash Flow) | ||||||||||
| Net Operating Cash Flow | 5,515 | 8,291 | 3,658 | 4,672 | 8,732 | 9,107 | 600 | 10,566 | 18,343 | 14,928 |
| Capital Expenditure | 4,448 | 5,024 | 9,511 | 9,610 | 8,302 | 6,765 | 6,737 | 9,174 | 10,914 | 9,005 |
| Net Investing Cash Flow | -4,366 | -4,961 | -9,254 | -15,153 | -8,133 | -6,669 | -6,712 | -8,174 | -10,702 | -8,834 |
| Net Financing Cash Flow | -1,054 | -3,016 | 7,389 | 9,477 | -1,261 | -447 | 4,751 | -4,130 | -7,782 | -5,268 |
| Free Cash Flow | 1,137 | 3,941 | -5,173 | -3,769 | 1,379 | 3,118 | -5,212 | 2,362 | 8,539 | 7,068 |
| (Profitability ) | ||||||||||
| ROA (%) | 2.95 | 5.36 | 5.87 | 2.71 | 1.66 | 0.85 | 2.44 | 4.04 | 3.65 | 0.41 |
| ROE (%) | 11.98 | 19.27 | 18.31 | 7.76 | 4.74 | 2.51 | 7.37 | 11.98 | 9.94 | 1.04 |
| Net Margin (%) | 2.36 | 4.52 | 5.00 | 2.48 | 1.68 | 0.98 | 2.51 | 3.68 | 3.43 | 0.41 |
| Asset Turn | 1.25 | 1.18 | 1.18 | 1.09 | 0.99 | 0.87 | 0.97 | 1.10 | 1.06 | 0.99 |
| Assets/Equity | 4.07 | 3.60 | 3.12 | 2.86 | 2.86 | 2.95 | 3.03 | 2.97 | 2.72 | 2.56 |
| (Per-share) Unit: JPY | ||||||||||
| EPS | 87.5 | 157.9 | 176.4 | 90.2 | 58.3 | 30.5 | 96.7 | 187.5 | 167.4 | 17.9 |
| BPS | 750.1 | 888.8 | 1,069.6 | 1,250.0 | 1,216.1 | 1,213.7 | 1,409.8 | 1,722.1 | 1,687.4 | 1,774.6 |
| Dividend per Share | 26.00 | 34.00 | 45.00 | 27.00 | 24.00 | 9.00 | 28.00 | 47.00 | 51.00 | 53.00 |
| Shares Outstanding (million shares) | 23.94 | 23.94 | 27.44 | 27.44 | 27.44 | 27.44 | 27.44 | 27.44 | 32.88 | 33.10 |
Corporate data
Corporate profile/history
SUMIDA CORPORATION
【Head Office 】
KDX Ginza Building 7F, 3-7-2, Irifune, Chuo-ku, Tokyo
https://www.sumida.com/
【R&D Centers】
Japan (Sendai, Nagano), China, Thailand, Germany, USA
【Sales offices in Japan】
Sendai, Nagano, Nagoya, Osaka, Saitama, Kawasaki
【Sales offices outside of Japan】
Hong Kong, Singapore, China, Taiwan, Thailand, South Korea, USA, Germany, India
【Manufacturing】
Japan (Aomori, Nagano), China (Taiping, Panyu, Nanning, Shanghai, Changde, Ji’an, SuQian), Mexico, Vietnam (Haiphong, Quang Ngai), Thailand, Germany (Obernzell, Neumarkt, Lehesten, Radeberg), Romania and Slovenia, USA
【Business Description】
Electronic components & modules for use in Automotive, Consumer Electronic and Industrial applications
【No. of Employees 】14,662 (Consolidated;As of Dec. 31, 2024)
Sales by product category (fiscal year ended Dec. 2024)
By Market
By Production Area
By Sales Region
Source: Company materials
Corporate data
History

The top management
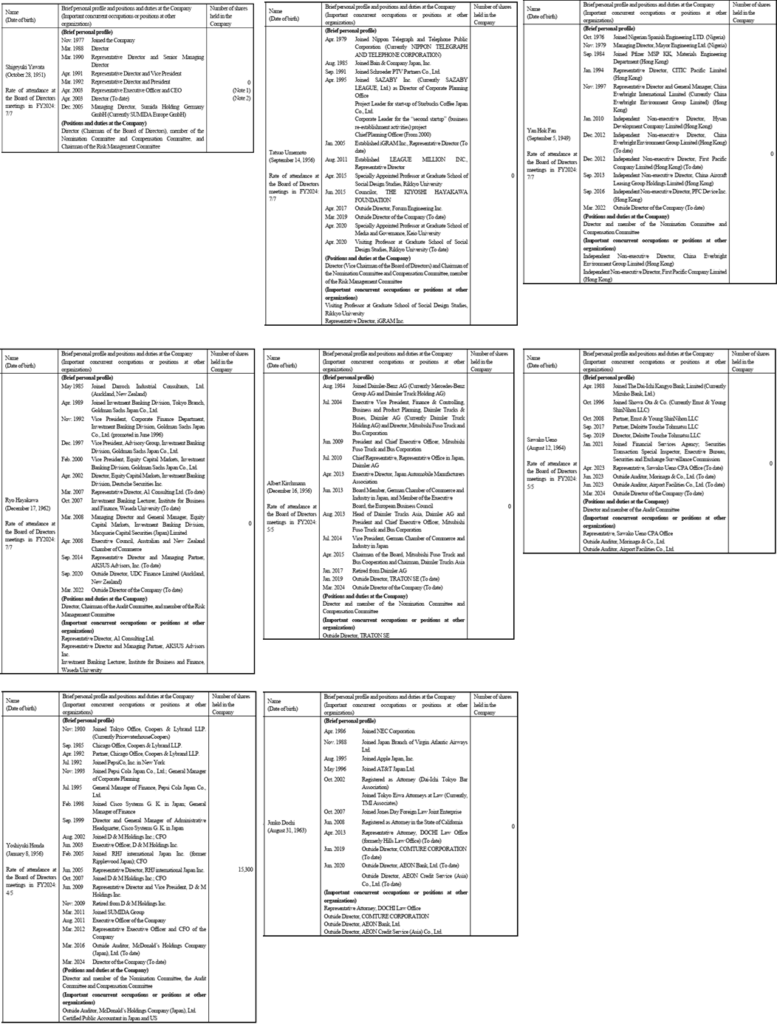
Source: Company materials
Skills matrix of the Board of Directors’ members
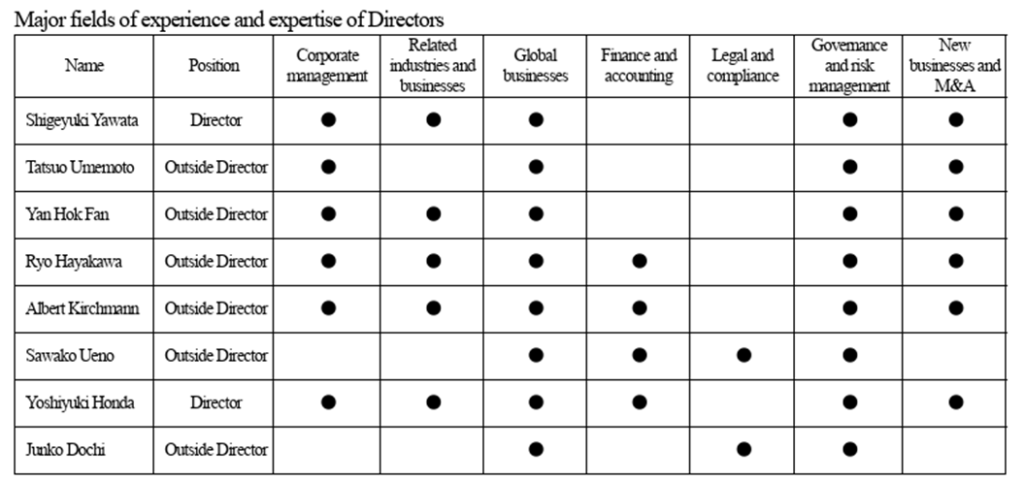
Source: Company materials
Corporate governance structure
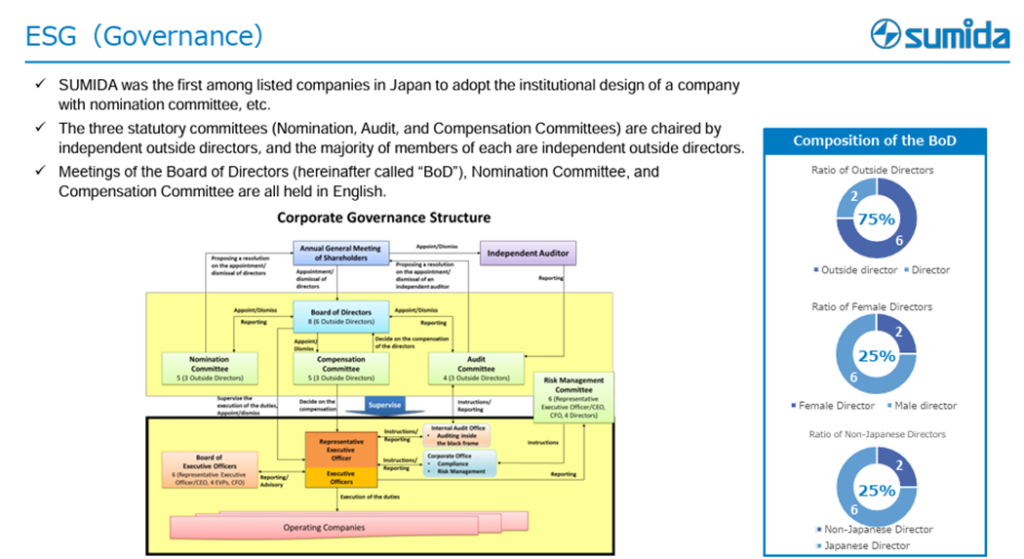
Source: Company materials
Initiatives toward ESG
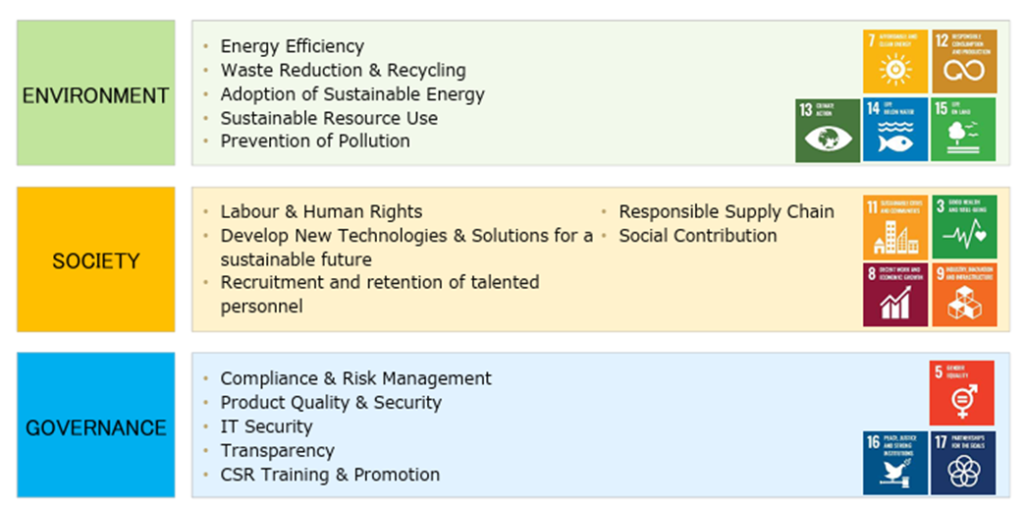
Source: Company materials
Major shareholders (As of December 31, 2024)

Source: Company materials
Shareholding by ownership (As of December 31, 2024)
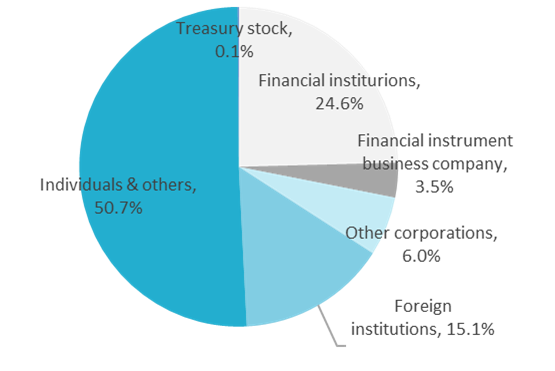
Number of shareholders : 22,697
Source: Omega Investment from company materials