2026-03-12
Home
Japanese

Omega Investment Co., Ltd.
Human Creation Holdings (Investment report – Basic)
| Share price (7/31) | ¥1,150 | Dividend Yield (25/9 CE) | 2.4 % |
| 52weeks high/low | ¥830/1,420 | ROE(24/9) | 33.9 % |
| Avg Vol (3 month) | 9.6 thou shrs | Operating margin (TTM) | 8.8 % |
| Market Cap | ¥41.1 bn | Beta (5Y Monthly) | 0.46 |
| Enterprise Value | ¥30.6 bn | Shares Outstanding | 3.573 mn shrs |
| PER (25/9 CE) | 11.4 X | Listed market | TSE Growth |
| PBR (24/9 act) | 2.7 X |
| Click here for the PDF version of this page |
| PDF version |
Challenging a mid-term 1,000 yen EPS through “high ROE × strategic domain growth.”
Valuation reappraisal driven by unceasing growth and capital efficiency
*EPS after stock split: 500 yen
Conslusion
Expectations for growth in the “high ROE × reinvestment-driven” model. Despite earnings plateauing, the attractiveness of the share price dips remains intact.
Human Creation Holdings (hereinafter “HCH”) has achieved extremely high capital efficiency, with ROE of 33.9% and ROIC of 20.0%, making it a high-performance company that stands out in both profitability and growth. The forecast PER for FY9/2025 is 12.22x (8.9x when excluding the impact of valuation losses on investment securities), PBR is 2.67x, and the dividend payout ratio is 20%. Thus, the market is factoring in EPS growth of over 20%, but based on the net cash of 500 million yen at the end of the second quarter, the effective PER drops to 10.7x. Considering EPS, excluding the impact of valuation losses on investment securities, the sense of undervaluation is extremely strong. Meanwhile, the earnings yield reaches 9.7%. As such, while the stock price reflects growth potential, the valuation still appears notably undervalued.
While based on a capital-light IT human resources business, the company has substantial cash flow generation capability through a shift to strategic domains (IT consulting, contracted development, and maintenance), improvement in unit price and utilization rate through engineer training, and vertical integration via M&A. Operating cash flow remains consistently high, and with efficient working capital and light capital investment burden, free cash flow is also ample. Through these structures, the company has established a robust cash generation model that enables both growth investments and shareholder returns, while achieving a high ROIC.
On the financial front, operating cash flow reached 480 million yen in FY9/2024, and combined with restrained capital expenditures, the capacity to generate free cash flow is robust. For a company with a market capitalization of 4.0 billion yen, having 500 million yen in net cash is also noteworthy. In addition, while maintaining consecutive dividend increases since listing, the company has incorporated a total shareholder return ratio of over 30%, including share buybacks, into its mid-term plan, clearly indicating its commitment to flexible shareholder returns. Furthermore, its stance of maintaining an equity ratio below 40% and pursuing capital efficiency maximization is also commendable.
Operating profit for FY9/2025 is projected to be 635 million yen, a mere 0.7% increase from the previous year’s 631 million yen. The company explains that this initiative is aimed at securing profit levels similar to those of last year while accelerating sales growth through upfront investment for medium- to long-term earnings expansion. Although regular salary increases implemented in January and the introduction of a performance-based compensation system linked to sales are putting pressure on profit margins in the SES (system engineer staffing) domain, the strategic domains the company is focusing on—namely, IT consulting, contracted development, and maintenance and operations—have maintained high growth of +35.5% YoY as of the second quarter of FY9/2025, with project accumulation and personnel expansion also progressing. The company has also announced a transformation of its domain strategy through mergers and acquisitions (M&A), and has executed its largest-ever M&A deal in April 2025. The structural transformation of the business portfolio is steadily progressing, and this has significant potential to lead to improved profitability over the medium to long term.
In its mid-term management plan, the company adopts a policy of shifting from the second stage, which targets 12.0 billion yen in net sales (including 5.0 billion yen from strategic domains and 7.0 billion yen from SES) in FY9/2027, to the third stage, which aims to achieve 1,000 yen in EPS and ROE of over 30% in FY9/2030. To achieve this growth, HCH has presented two supplemental scenarios.
*These simulations are based on assumptions set by the company and are not numerical targets committed as part of the mid- to long-term management policy.
In the first scenario to achieve a 1,000 yen EPS (referred to as “Scenario C” in the supplementary materials to the mid-term management plan), the company assumes 5% annual sales growth and a 0.1-point improvement in profit margin to generate synergy, projecting EPS to reach 1,016 yen. Net income attributable to owners of the parent is assumed to be 690 million yen, and total return to shareholders is 560 million yen, making this a realistic scenario that represents discontinuous growth through M&A. In the other scenario (“Scenario D”), by factoring in natural growth not previously included and applying an approximate 10% increase, EPS is projected to reach 1,850 yen. In this case, the net income attributable to owners of the parent would be 1.17 billion yen, and the total return to shareholders would be 750 million yen. What both scenarios have in common is the aim of achieving significant EPS growth not by relying on the existing business structure, but through synergy creation via M&A and the concentration of management resources in strategic domains.
*All EPS figures for actual results, forecasts, and the mid- to long-term management policy are before adjustments for the stock split announced on November 14, 2024. The target value, taking the stock split into account, is 500 yen.
In this way, although HCH is currently experiencing a temporary stagnation in profit growth, it has an obvious medium-term growth story. It can be evaluated as a company with high investment appeal in terms of cash flow generation capacity, capital efficiency, strategic M&A development, and shareholder returns. While a short-term performance adjustment phase may continue, assuming high earnings yield and a reinvestment strategy, price dips may serve as promising entry points for medium- to long-term investors. Going forward, verifying the execution of the presented growth scenarios, along with expansion in profit contributions from strategic domains, will likely become an essential indicator for assessing corporate value.
1. Company overview
A growth company through the fusion of human resources and IT solutions. An independent IT services holding company handling all phases of system development
HCH is a system solution company that, primarily through technical support provided by engineering staff, is engaged in consulting, contracted development, and maintenance/operations related to IT systems. In 2016, it transitioned to a holding company structure, clearly separating the strategic management of the group from on-site execution, thereby enabling prompt decision-making and enhancing the agility of its operating companies. The company was listed on the Tokyo Stock Exchange’s Mothers Market (currently the Growth Market) in March 2021 and is now a pure holding company with seven consolidated subsidiaries.
The origin of the group dates back to Banking Systems Co., Ltd., established in 1974, whose primary business at the time was the sale of hardware and provision of maintenance services to financial institutions. It later shifted its focus to the system engineering service (SES) domain, growing primarily through resident-based engineering staffing. In recent years, it has accelerated expansion into upstream processes through entry into consulting and contracted development via mergers and acquisitions (M&A).
The current HCH Group consists of Brain Knowledge Systems (BKS), which has a strength in engineering dispatch and serves as the core, Asset Consulting Force (ACF), which handles system consulting, Human Base, which supports ERP implementation, Cosmopia, which specializes in system operations support, Sailing, which focuses on maintenance and operations, and TARA, which handles AI solutions. In October 2024, CLS was absorbed into BKS, demonstrating strategic reorganization and functional integration within the group.
In April 2025, the company acquired HC Financial Advisor, a firm specializing in M&A brokerage. This established a system that allows for the one-stop provision of consulting and IT implementation services to address clients’ management issues. Through collaboration between the Holdings’ Management Consulting Business Strategy Office and its subsidiaries, the company is entering the management consulting business on a full scale.
A notable feature of HCH’s business model is its focus not only on revenue models based on working hours, such as SES, but also on strategic domains (high value-added areas) such as management and IT consulting, contracted development, and operations. This enables the company to transition beyond a labor-intensive staffing business to consulting- and project-based revenue models. The group employs 854 engineers as of the end of September 2024, comprising 157 in the PM/PL class, 284 in the SE class, 271 in the PG class, and 76 in other roles, enabling support for various phases of development. The company emphasizes engineer training and development, establishing its skill-up programs and OJT systems, which have led to increased unit prices for dispatch and improved retention.
Its customer base spans a wide range of industries, including finance, manufacturing, telecommunications, energy, public, and healthcare sectors, and the ratio of direct contracts is gradually increasing. While staffing contracts remain the core, the number of outsourcing and contracted projects is growing year by year, and the company’s ability to handle complete project contracts is also improving. Recently, through collaboration with its AI-related and M&A intermediary subsidiaries acquired via mergers and acquisitions, the company is further enhancing its proposal and solution capabilities in system development.
In the medium to long term, the company has clearly stated its policy to strengthen competitiveness in the DX support market by expanding technical fields across the group and reinforcing systems for IT personnel training and supply. Centered on “Human” and “Creation,” HCH is building a unique position as a next-generation solution integrator that can seamlessly handle everything from staffing to development, maintenance, AI, and consulting, thereby advancing the sophistication of corporate IT support. Going forward, the company is expected to develop a management model that balances capital efficiency and cash generation capabilities by expanding into higher-profit strategic domains while leveraging its SES foundation.
2. Business characteristics and content
From SES to strategic domains. Realizing high-value-added services to overcome the limits of a dispatch-centric model
HCH’s business structure is based on engineering services under the axis of “human resources × IT.” It consists of two main pillars: “SES (system engineering service) domain” and “strategic domain (management and IT consulting, contracted development, maintenance and operations, M&A brokerage).” SES is a labor-intensive model in which engineers are stationed at client sites to engage in system development, maintenance, and operations. In contrast, the strategic domains that the company is focusing on in recent years are characterized by shifts to management and IT consulting, upstream planning and requirements definition, and contracted development and project-based projects involving responsibility for deliverables. This structural transformation is driving medium- to long-term profitability improvements, including unit price increases and enhanced profit margins.
In FY9/2024, SES still accounts for approximately 70% of HCH’s sales composition, but the ratio of strategic domains has risen to over 30%. Going forward, the company plans to increase this ratio further and transform its business structure.
The first distinctive feature of the business is its capability to respond to a wide range of development domains. The company serves clients across a wide range of industries, including finance, telecommunications, manufacturing, and the public sector, and handles business systems, core systems, and web-based applications. It is actively expanding not only into development and maintenance but also into upstream processes such as requirements definition and basic design. As of the end of September 2024, engineers in the PM/PL class accounted for 20% of the total, and those in the SE class for approximately 36%, indicating a high ratio capable of handling upper-level processes.
Second is the expansion of functions and business complement through mergers and acquisitions (M&A). Most recently, in 2025, HCH established HC Financial Advisor, a subsidiary that engages in M&A brokerage, and developed a system enabling the one-stop provision of consulting services for client management issues and IT implementation. This has enabled the acquisition of complex projects, in addition to existing contracted development, such as post-merger integration (PMI) support and the development of data linkage platforms. Furthermore, in the AI solutions business handled by TARA, the company aims to leverage its proprietary person-detection AI camera as a product in its consulting and contracted development businesses.
Third is the optimization of engineer productivity through education and training. The HCH Group has enhanced its unique education programs, including proprietary e-learning, and established a comprehensive training structure for engineers across upstream and downstream phases. As a result, the number of engineers capable of handling upper-level processes is increasing, enabling them to charge higher unit prices and participate in more profitable projects. In particular, the company’s strategy of continuous recruitment and retraining for the upstream shift is an essential initiative for transforming from the labor-intensive structure of the SES domain to a high-profit model centered on human capital.
In terms of sales strategy, the company is also increasingly improving its direct sales ratio, having announced a capital and business alliance with Nippon Steel Solutions in February 2023. In the SES industry, which has traditionally relied on multi-tier subcontracting structures, the company is enhancing its gross margin and flexibility in project selection by expanding direct transactions with end-user companies and primary contractors (SIers).
In this way, HCH is breaking away from its previous dependence on the SES model and evolving into a high-value-added IT service model that enables sustainable profit growth through strategic M&A, engineering development, an upstream shift in business domains, and the strengthening of direct sales. The company’s efforts to enhance its profit margin, unit price, and operational efficiency form the foundation for sustained ROE and EPS growth, representing a key business characteristic that underpins its medium- to long-term competitive advantage for shareholders.
3. Major shareholders and investment trends
A stable shareholder structure consisting of founders and employees. Flexibility in capital policy aligned with business growth is key.
HCH maintains a shareholder structure centered on stable shareholders. According to the latest public information (as of July 2025), President and CEO Kuniaki Tominaga holds 3.25% (approximately 52,000 shares).
In addition, the Human Creation employee stock ownership plan holds 6.52% (approximately 233,000 shares), and the ratio of internal shareholders, including officers and employees, exceeds 13%. This secures the alignment of incentives between management and employees, enabling a decision-making structure focused more on medium- to long-term corporate value enhancement than on short-term share price fluctuations.
Among external shareholders, the most prominent is Hikari Tsushin, Inc., known for its strengths in sales support and growth investment. The company holds 5.09% (approximately 182,000 shares). Hikari Tsushin is recognized for its investment stance that emphasizes both growth and cash flow, and its approach is highly compatible with HCH’s business model, which offers substantial potential in dividend yield and capital efficiency improvements. While not an equity-method affiliate, it is likely to remain a stable medium- to long-term shareholder.
Also noteworthy is the shareholding by strategic partners, such as NS Solutions (4.39%) and Advanced Media (3.11%). NS Solutions, a system integrator, is a collaboration partner of HCH, and its shareholding may not be merely a financial investment but also reflect the intentions of a business alliance.
Regarding institutional investor trends, no activist behavior has been observed so far. However, given the company’s high total return ratio, high ROE, and undervalued PER, there is ample possibility that its stock will be reevaluated as a small- to mid-cap growth name and that institutional holdings may expand going forward.
HCH’s shareholder base is well-diversified among management, employees, strategic investors, business partners, and institutional investors, and the short-term supply-demand risk appears to be limited. On the other hand, since the floating share ratio is not high, flexibility and transparency in future capital policies will be essential. Capital strategies stated in the mid-term management plan—such as “maintaining an equity ratio below 40%” and “optimizing capital structure through flexible share buybacks”—should be monitored as a foundation for sustainable corporate value enhancement based on dialogue with shareholders. Especially in scenarios involving rapid EPS growth, the company’s structure increasingly appears ready to consider a future stock split or a step-up to the TSE Prime Market.
4. Mid-term management plan
Balancing “50% share in strategic domains” and “4–7 times EPS growth.” A phased, stage-based execution plan for discontinuous growth
In 2024, the company formulated a mid-term management plan based on a “three-stage structure,” clearly aiming not only for expansion in sales and profit scale but also for qualitative transformation of the business portfolio and sophistication of capital policy, thereby setting out a path to discontinuous corporate value enhancement. At the core of the plan are two phases—“2nd Stage (FY9/2027)” and “3rd Stage (FY9/2030)”—with quantitative milestones set across business structure, earnings structure, and shareholder return strategies.
In the 2nd Stage, the company targets consolidated net sales of 12.0 billion yen in FY9/2027, with 5.0 billion yen from strategic domains (IT consulting, contracted development, and maintenance/operations) and 7.0 billion yen from the SES (System Engineering Service) domain. This represents a roughly 1.4x increase in sales compared to the current level and implies a rise in the strategic domain sales ratio from the current 20% range to over 40%. This shift, accompanied by an improved operating profit margin, is expected to directly lead to higher engineering billing rates and a higher profit margin per project, contributing to medium- to long-term improvements in both capital efficiency and cash generation capability.
In the 3rd Stage, the company aims for EPS of 1,000 yen and ROE of over 30% in FY9/2030. To realistically achieve this, it has presented two earnings growth scenarios: “Scenario C” and “Scenario D.” Scenario C is a strategy of accumulating synergy through M&A, assuming 5% sales growth and 0.1pt profit margin improvement annually, resulting in EPS rising to 1,016 yen, net income attributable to owners of the parent reaching 690 million yen, and total shareholder return reaching 560 million yen.
In contrast, Scenario D assumes the addition of natural growth (approximately 10%) not previously included in earnings forecasts, resulting in projected EPS of 1,850 yen, net income of 1.17 billion yen, and a total shareholder return of 750 million yen. Both scenarios imply significant upside from the current EPS (approximately 248 yen), representing 4–7 times discontinuous growth.
This mid-term plan strongly emphasizes not only business structure transformation but also capital structure optimization. Specifically, it sets “maintaining an equity ratio below 40%” as a principle and clarifies its intention to utilize flexible share buybacks and dividend policy to maximize capital efficiency. The company also targets a total return ratio of over 30%, which, combined with future profit growth, will significantly expand the potential for active shareholder returns, including share buybacks.
In addition, the precise positioning of the M&A strategy is noteworthy. The 2025 acquisition of M&A brokerage firm HC Financial Advisor as a subsidiary enhances HCH’s traditional IT development framework by adding perspectives of management and business restructuring consulting, strengthening the structure for generating cross-selling synergies. Going forward, business domain expansion through mergers and acquisitions (M&A) is expected to continue, and the execution of such external growth measures will be a key factor in realizing the mid-term plan.
In this way, HCH’s mid-term management plan is noteworthy in that it aims for comprehensive corporate value enhancement, not limited to top-line growth, but also encompassing improvements in operating profit margin, compound EPS growth, a sustained ROE of over 30%, and expansion of shareholder returns through an agile capital policy. Although its quantitative targets are ambitious, the plan’s detailed breakdown of growth drivers and implementation methods, based on scenarios, is effective as a communication strategy with shareholders and investors. Market expectations for future execution and progress reporting are also rising.
5. Regarding international business
Overseas expansion is minimal. Currently, a domestically self-contained structure
Currently, HCH’s international business accounts for a minimal portion of its overall business portfolio, and no direct contribution to sales or profit is observed. No specific mention of overseas operations or business development targeting overseas clients is found in the current official materials, and the business structure is centered on service provision within the domestic market.
Accordingly, rather than direct overseas expansion or securing global sales, HCH’s international business strategy is to “internalize international complementary functions” within the framework of domestic project enhancement. In the IT industry, which relies heavily on human capital, this approach can be regarded as a realistic and cost-effective strategy that maintains the benefits of domestic control over quality, deadlines, and risk management while partnering externally as needed. Looking ahead, full-fledged overseas expansion may be triggered by client-initiated projects or an increase in cross-border mergers and acquisitions (M&A) deals; however, for the time being, deepening domestic operations and strengthening strategic complementarity should be viewed as the central axis of HCH’s international strategy.
6. Long-term performance
Growth performance sustaining high profitability and capital efficiency, with 8.8% operating margin and ROE over 30%
Since its listing in FY9/2020, HCH’s performance has continued on a steady growth trajectory, following a temporary decline in demand during the COVID-19 pandemic. In particular, while based on engineer staffing, the company has expanded into high-value-added domains such as contracted development and IT consulting, and it stands out for sustaining high levels of both profit margin and capital efficiency.
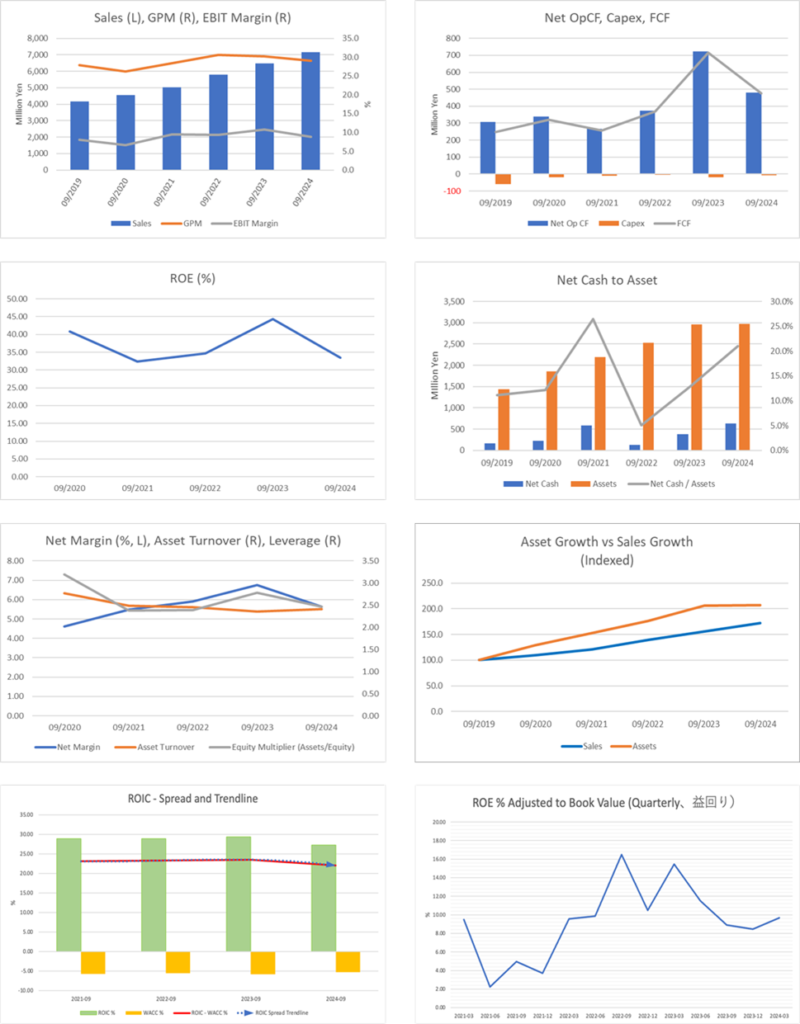
From FY9/2020 to FY9/2024, net sales grew from 4.56 billion yen to 7.16 billion yen, and operating profit increased from 300 million yen to 630 million yen, demonstrating stable, albeit gradual, growth. During this period, operating margin remained in the 8–10% range, reaching 8.8% in FY9/2024.
In terms of profitability indicators, ROE in FY9/2024 was 33.9%, and ROIC was 20.0%, both exceptionally high. ROE reflects the efficient use of shareholders’ equity, and a level above 30% ranks among the top tiers of listed companies. That this level of ROE is sustained despite the company’s capital policy of allocating most profits to growth investment suggests efficient use of retained earnings.
Cash flow also remains sound. Operating cash flow was 720 million yen in FY9/2023 and 480 million yen in FY9/2024, both of which remained positive. Free cash flow also maintained stable surpluses within the range of investment outflows.
Additionally, trends in engineer unit price and utilization rate serve as fundamental indicators supporting the company’s profit margin. From FY9/2020 to FY9/2024, the average contract unit price rose from 557,000 yen to 645,000 yen, showing a CAGR of 3.7%, indicating a stable trend of unit price increases. Utilization also improved post-COVID, reaching a high level of 98.4% in 2024.
In this way, the company has established a high-profitability structure that consistently achieves over 8% operating margin and over 30% ROE, with improvement in on-site KPIs such as unit price and utilization rate steadily leading to profit growth. Going forward, with further growth expected in the ratio of contracted work and M&A-driven project expansion, whether these quantitative results can be sustained will be a key monitoring point for investors.
7. Performance in the most recent earnings results
Despite a 10.5% increase in sales, earnings declined. Profit enters a temporary adjustment phase due to rising personnel expenses and reward system changes.
In the full-year financial results for FY9/2024, net sales reached 7.165 billion yen (+10.5% YoY), achieving double-digit sales growth. However, operating profit was 631 million yen (–9.6% YoY), ordinary profit was 629 million yen (–10.2% YoY), and net income attributable to owners of the parent was 404 million yen (–7.8% YoY), resulting in a decline in profit. Operating margin remained high at 8.8%, but declined from the previous year’s 10.8%, indicating that the company is in a plateau phase in terms of earnings.
The primary factor in the revenue structure was an increase in personnel and SG&A expenses resulting from the regular salary increase implemented in January 2024 and the introduction of a performance-based compensation system tied to sales. While gross profit increased due to higher engineer unit prices and a rising ratio of contracted work, the incentive system absorbed much of the gross margin improvement, weighing down the operating margin. Although this is a structural investment aimed at mid- to long-term improvement in employee retention and reward system reform, it has led to short-term stagnation in profit growth.
On the other hand, strategic domains such as “IT consulting,” “contracted development,” and “maintenance/operations” continued to grow, with sales reaching 2.19 billion yen, accounting for 30.5% of total sales (compared to 2.10 billion yen and 32.2% the previous year). The company’s revenue structure is steadily evolving beyond the SES-centric model, laying the foundation for future improvements in profit margin.
On the financial front, a solid balance sheet was maintained, with operating cash flow at 481 million yen and free cash flow at 478 million yen, both of which remained stable. Cash and deposits totaled 1.00 billion yen, and interest-bearing debt stood at 375 million yen (122 million yen in short-term borrowings and 253 million yen in long-term borrowings), resulting in net cash of 630 million yen (500 million yen at the end of Q2), indicating extremely high financial soundness.
Shareholder returns also continued to strengthen. The annual dividend was 52 yen per share (up from 51 yen in the previous year), achieving a fourth consecutive dividend increase. The dividend payout ratio was 21.1%, and total dividends paid amounted to 84 million yen. In addition, the company repurchased 48 million yen worth of its shares, resulting in a total return ratio of 32.8%. This aligns with the mid-term management plan’s target of a “total return ratio of 30% or more,” indicating that the capital policy is operating with a focus on balancing growth investments and capital returns.
In summary, the FY9/2024 results showed continued growth in strategic domains and increased sales; however, earnings declined due to changes in the compensation system and rising personnel costs. Although currently in a temporary earnings adjustment phase, the expansion of contracted projects and consulting domains is expected to support future recovery in operating margin. The timing of the earnings rebound and strengthening of the earnings base will be focal points for investment judgment going forward.
8. Full-year earnings forecast
The sales forecast has been revised upward to 8.9 billion yen. Expansion of strategic domains and unit price increases drive growth.
For the full-year consolidated results for FY9/2025, the earnings summary for FY9/2024 announced on November 14, 2024, had projected net sales of 8.606 billion yen, operating profit of 635 million yen, ordinary profit of 635 million yen, and net income attributable to owners of the parent of 404 million yen. However, in the “Consolidated results for the Second Quarter of FY9/2025” announced on May 12, 2025, the net sales forecast was revised upward to 8.906 billion yen, while the operating profit forecast remained at 635 million yen, reflecting an upward revision primarily in the sales outlook.
The upward revision in the net sales forecast (+300 million yen, +3.5%) reflects the newly consolidated contribution of subsidiary HC Financial Advisor, which was acquired through a merger and acquisition (M&A).
The operating profit outlook remains at 635 million yen, taking into account increases in personnel expenses resulting from changes in compensation systems and strengthened hiring practices. While the operating margin is expected to decline from the previous year’s 8.8%, the projected result represents a balance between strategic cost investment and earnings. The assumed operating margin is approximately 7.1%, which can be viewed as a preparatory step toward medium- to long-term profitability recovery.
Meanwhile, net income attributable to owners of the parent was revised downward to 327 million yen (–19.0% YoY). This reflects one-time losses from non-operating items such as valuation losses on listed equity holdings. Notably, there is no impact on operating profit or cash flow, and the company’s earning power remains intact.
As of the end of the second quarter, net sales totaled 4.071 billion yen, and operating profit reached 378 million yen, representing progress rates of 45.7% and 59.6%, respectively, against the full-year forecast. This indicates a high degree of confidence in meeting targets. Given the concentration of revenue recognition from consulting and contracted projects in the second half, there remains room for upside, even considering the seasonal nature of earnings.
Taken together, FY9/2025 is expected to see the most considerable top-line growth in the company’s history, with a YoY sales growth rate of +24.3%, while on the earnings side, a conservative plan incorporating strategic personnel investments has been presented. Operating profit remains stable, and when excluding valuation losses, profitability is being maintained in real terms. For shareholders, attention will focus on both the progress of the growth strategy and the company’s cautious earnings management structure that maintains financial soundness.
9. Growth strategy and risks
Focus on M&A, strengthening of strategic domains, and managing dependence on human capital in pursuit of discontinuous growth.
HCH’s growth strategy for sustainable growth beyond 2025 is based on three pillars: “expansion of strategic domains,” “synergy creation through M&A,” and “optimization of human capital investment.” In particular, the company has clearly stated its policy to continuously increase the sales composition ratio of high-value-added domains such as IT consulting, contracted development, and maintenance/operations. In the second quarter of FY9/2025, sales in strategic domains reached 750 million yen, with the ratio increasing to 36.6% of total sales (+3.5 percentage points from the previous quarter). This shift is promoting improvements in profit margin and customer loyalty, and is leading to the establishment of a growth structure that does not rely on the existing SES model.
Furthermore, in its M&A strategy, triggered by the full acquisition of HC Financial Advisor, the company has added management and business restructuring consulting perspectives to its traditional IT development framework, establishing a structure to provide comprehensive solutions to client companies and generate cross-selling synergies. Through this vertically integrated model, the company is strengthening its ability to handle all phases—from upstream processes, such as business reform and system requirements definition, to downstream processes, including development and maintenance/operations. Going forward, the company plans to leverage industry-specific solutions and technology subsidiaries focused on AI/data domains (e.g., TARA) to establish further competitive advantages.
In its mid-term management plan, the company has set ambitious targets of 12.0 billion yen in net sales for FY9/2027 and 1,000 yen in EPS for FY9/2030. All disclosed simulation scenarios are premised on accelerated growth, including M&A. In particular, Scenario C assumes a 5% increase in sales and a 0.1 percentage point increase in profit margin each year, with the execution and quality of M&A and integration processes being key to success.
*These are numerical targets presented as simulations, not commitments under the mid- to long-term management policy.
On the other hand, the company’s risk structure is also evolving in parallel with growth acceleration. The most significant structural risk stems from the labor-intensive nature of the business, specifically, risks related to securing human resources and rising personnel costs. In FY9/2024, SG&A expenses increased due to the introduction of a performance-based compensation system and the implementation of regular salary increases, which suppressed profit growth. As competition for engineers intensifies across the market, the success of initiatives to secure and retain top talent will directly affect the profit level. In addition, since productivity and utilization per engineer have a significant impact on the P&L, retention and skill equalization will be critical to sustaining profit margins.
Moreover, internal management sophistication remains a challenge in light of integration risks (PMI) associated with M&A execution and the increased complexity in incentive design resulting from the new compensation system. Without reinforcement in these non-financial areas, there is a risk that cost control and governance may become superficial during a period of high growth.
HCH’s growth strategy is grounded in a discontinuous growth model that advances both quantitative expansion and qualitative enhancement in parallel. Its driving force lies in the integrated capabilities of strategic domain expansion, M&A execution, and human capital acquisition. How well these elements are balanced and internal controls are operated with precision will be the key to sustaining ROE and ROIC over the medium term and maximizing corporate value.
10. Stock price trends and equity valuation
Valuation reflects anticipated EPS growth. High ROE names carry inherent risks of short-term earnings adjustment.
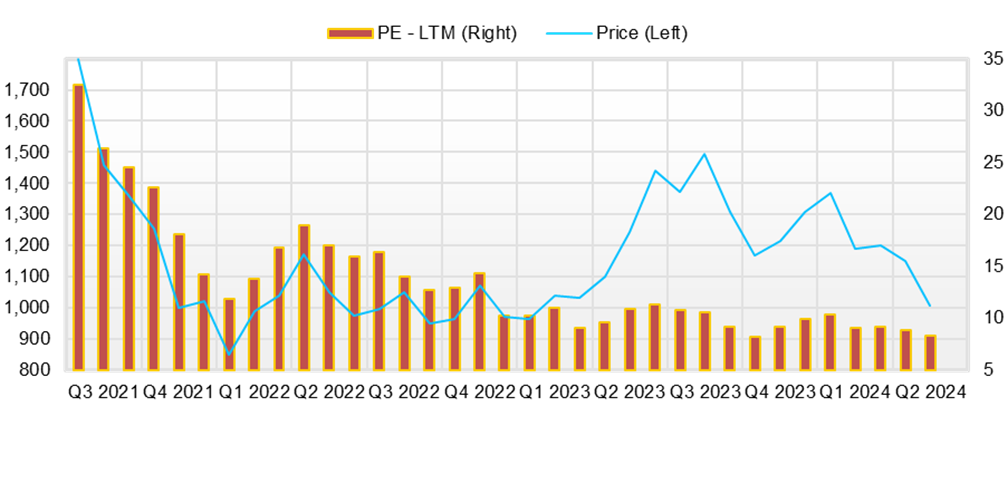
HCH’s stock price trended firmly from the second half of 2024 through spring 2025, supported by upward earnings revisions, progress in M&A, and accumulation of contracted projects. As of July 2025, the current share price level reflects an adjusted PER of 8.9×* and PBR of 2.67×, slightly higher than that of comparable IT staffing firms listed on the Growth Market. However, given that the company achieves a high capital efficiency of 33.9% ROE and adopts a policy of allocating a significant portion of its profit toward growth investments, the valuation can be seen as reasonably justified.
The current PBR of 2.67× exceeds the average PBR over the past three years (approximately 2.3×), indicating that investors are already pricing in the company’s future growth scenarios, particularly the expansion of strategic domains and EPS growth through M&A. EPS growth has exceeded an annual rate of 20% over the past three years. In the current fiscal year as well, top-line driven growth is expected with +24.3% YoY in sales and +0.7% YoY in operating profit. That such EPS growth expectations support the stock price serves as a strength compared to other growth names.
In earnings yield terms, the figure stands at 9.7%, indicating a return close to 10%. Furthermore, with 500 million yen in net cash, the effective PER adjusts to 10.7×. The company’s financial soundness and continued strategic investment provide support to its valuation.
On the other hand, some downward pressure on profitability is being noted in the short term. The most significant concern is the continued rise in personnel expenses and the profit-suppressing effects of the compensation system. The performance-linked incentive system introduced in FY9/2024 has helped suppress turnover and maintain motivation among engineers, but it has also become a factor compressing the operating margin. In FY9/2025, the company’s earnings plan also incorporates compensation system and recruitment reinforcement expenses, and operating profit is projected to remain nearly flat at +0.7% YoY. Thus, while net sales are growing significantly, the stagnation in profit growth may be a short-term cautionary factor in valuation reappraisal.
Furthermore, for a company like HCH pursuing discontinuous growth through M&A, future deal selection and the precision of post-merger integration (PMI) will also influence valuation. Should there be any materialized cases of high-priced acquisitions without a track record or failed integration, the assumptions behind EPS growth could collapse, leading to rapid downward revisions in valuation.
Additionally, as HCH’s business model is inherently labor-intensive, KPIs such as utilization rate, unit billing rate, and turnover rate not only support valuation but also directly impact short-term performance. Should external conditions such as engineer shortages or unit price declines arise, profit elasticity would be limited, possibly prompting a reevaluation of PER/PBR.
*The company’s PER is calculated based on adjusted EPS, which excludes the impact of a one-time increase in expenses related to a loss on valuation of investment securities of 77 million yen, as disclosed in the revised full-year results announced on May 12, 2025.
The current share price of HCH is underpinned by high ROE, high growth, and sound financial standing. For medium- to long-term valuation sustainability, improved profitability in strategic domains and evolution in human capital management strategies will be critical. While short-term risks include weakened sentiment due to decelerated profit growth resulting from rising personnel costs and declines in net profit resulting from one-off costs, the current structure may offer a favorable buying opportunity during share price pullbacks for those who believe in medium- to long-term EPS growth potential.
11. Investment conclusion based on performance and stock price analysis
A medium- to long-term perspective is effective when factoring in short-term earnings adjustments. Focus on the “evolution of earning power” along the trajectory of continuous growth.
While HCH currently faces short-term profit pressure from the compensation system and rising personnel costs, the company is realizing high-ROE management supported by expansion of strategic domains, discontinuous growth through M&A, and a solid financial foundation, making its medium- to long-term potential for corporate value creation extremely high.
First, in the FY9/2025 full-year earnings forecast, net sales are expected to grow +24.3% YoY, mainly driven by an increase in projects in strategic domains such as IT consulting and contracted development. The full acquisition of HC Financial Advisor has enabled the company to construct a vertically integrated model encompassing all processes from upstream to downstream. As a result, unit prices and project sizes for contracted work are increasing. Additionally, collaboration with TARA, a company strong in AI and data applications, is opening up possibilities for expansion into advanced technology domains.
Meanwhile, operating profit is projected to grow only +0.7% YoY and net profit to decline –19.0% YoY, indicating a temporary plateau in profit. However, much of this is attributable to one-time costs, such as valuation losses on investment securities and the introduction of the new compensation system, and there is no impact on the company’s core earning power. Free cash flow for the 12 months of FY9/2024 was 478 million yen. As of the end of the first half of FY9/2025, cash and deposits totaled 1.2 billion yen, with interest-bearing debt at 702 million yen. The company maintains 500 million yen in net cash and a solid financial base that enables both growth investments and shareholder returns.
From a shareholder return perspective, the company paid an annual dividend of 52 yen per share in FY9/2024, marking a fourth consecutive year of dividend increases. The dividend payout ratio was 21.1%, and share buybacks were also implemented, resulting in a total return ratio of 32.8%. This aligns with the mid-term management plan policy of “a total return ratio of 30% or more,” and future dividend increases in conjunction with EPS growth are fully anticipated.
Considering the current share price, the PER of 12.22× and PBR of 2.67× accurately reflect the company’s high capital efficiency (ROE of 33.9%) and growth-oriented capital policy of reinvesting most profits. The earnings yield is 9.7%, and adjusted for net cash, the effective PER is just under 11 times, indicating limited overvaluation.
In the short term, flat operating profit and declining net profit may suppress the upside potential of the share price; however, since these are primarily due to structural increases in personnel costs and compensation system reforms, they are likely to contribute to improvements in retention and profitability in the medium to long term. If the proportion of strategic domains continues to expand, leading to margin recovery and compound EPS growth, the current valuation may be considered relatively undervalued.
In summary, HCH is a “high-growth, high-profitability company” that should be evaluated from a medium- to long-term perspective, particularly during this earnings adjustment phase. It presents a strong investment appeal during pullbacks. Going forward, the sustainability of growth in strategic domains, precision in M&A execution, and efficient utilization of human capital will become important evaluation axes. A perspective that captures the evolution of the business model, now on the path toward discontinuous growth, is required, rather than being swayed by short-term fluctuations in share price.
12. Transition and current assessment of ROE (return on equity)
Consistently maintaining a high level of ROE. A result of management with a focus on capital efficiency
HCH has consistently pursued management with high capital efficiency, and this is reflected in the trend of return on equity (ROE). In FY9/2022, ROE reached an extremely high level of 34.8%. This was brought about by an increase in net income and a relatively light equity structure, with contributions from discontinuous growth through mergers and acquisitions (M&A) and earnings expansion via project accumulation. In FY9/2023, ROE reached 44.7%, and in FY9/2024, it remained high at 33.9%. This can be evaluated as the result of stable improvement in the quality of earnings alongside revenue growth and improved capital efficiency due to share buybacks.
Thus, the overall trend of ROE has remained at a high level, far exceeding the average for listed companies (approximately 9% for all TSE-listed firms), which is a noteworthy point. HCH’s mid-term management policy sets “maintaining an equity ratio of 40% or lower” as a fundamental principle. This reflects a stance of avoiding excessive equity and pursuing a capital structure that strikes a balance between the cost of capital and return. In fact, in line with the policy of “not exceeding the standard for four consecutive quarters,” the company executed its largest-ever share buyback in January 2025.
Additionally, in the mid-term management plan, the EPS target for FY9/2030 (over 1,000 yen) assumes that ROE will continue to be maintained at 30% or higher. The current achievement of 33.9% serves as supporting evidence of the feasibility of this goal. While focusing on profit growth, the company also clearly emphasizes capital efficiency optimization, a rare balance-oriented approach among growth companies.
Therefore, HCH’s ROE is not merely a byproduct of the growth process but rather a high level achieved as a result of consistent alignment between capital policy and profit growth strategy. The company balances financial stability and a stance of strategic reinvestment, and ROE will continue to draw investor attention as an indicator symbolizing the company’s ability to create corporate value. The level and quality of ROE should be positioned as a core evaluation axis for equity investment in HCH.
13. Analysis of economic value creation based on ROIC and WACC
ROIC far exceeds WACC, establishing consistent value creation through returns exceeding the cost of capital
HCH demonstrates excellent performance in both profitability and capital efficiency. A comparison between ROIC (return on invested capital) and WACC (weighted average cost of capital) supports the company’s continued creation of economic value. In FY9/2024, ROIC reached a high level of 20.0%, indicating that the company’s business model inherently yields high investment returns. Meanwhile, WACC is estimated by considering the company’s capital structure, market interest rate environment, and credit risk levels, among other factors, and is generally expected to remain in the 6–8% range, which HCH’s ROIC significantly exceeds.
This structure implies a consistently positive state in terms of economic value added (EVA). In other words, the company consistently earns returns that far exceed the cost of capital on invested capital, and the ROIC–WACC spread is estimated to exceed 10%. This is a significant financial result for companies that pursue value-creating growth, not just expansion.
The following factors lie behind this high ROIC: (1) a light-asset model centered on human capital; (2) control of selling, general, and administrative expenses within a specific range while achieving sales growth; and (3) primary investments in human capital that are not capitalized, keeping the burden of fixed asset investment light. Furthermore, recent M&A targets have mainly been companies with high strategic complementarity, and their post-acquisition contribution to earnings has formed a structure that shortens the capital recovery cycle of invested capital.
On the other hand, maintaining ROIC going forward will be significantly affected by the risk of rising capital costs in additional growth investments, especially mergers and acquisitions (M&A), and the success or failure of post-merger integration (PMI). Particularly in the highly competitive IT human resource market, temporary increases in recruitment costs, training expenses, and compensation associated with talent acquisition may inflate invested capital, requiring ongoing monitoring of investment recovery efficiency.
In addition, depending on future interest rate environments and stock market volatility, there remains the possibility that WACC will gradually rise. For HCH, to maintain and improve ROIC above fluctuations in WACC, it will be essential to achieve both discontinuous EPS growth and a shift to high-value-added projects, which will be key to maximizing corporate value.
At present, HCH can be positioned in the capital markets as “one of the few growth companies consistently generating returns exceeding the cost of capital.” ROIC is not merely a profitability indicator, but also holds essential meaning as a measure of investment efficiency for shareholders. Going forward, how the company maintains and strengthens this ROIC structure through mergers and acquisitions (M&A) and strategic investments will be a key focus for investors.
14. Corporate value creation capability as seen from free cash flow and capital allocation
Abundant cash generation supports both growth investment and shareholder returns. Net cash structure enables a flexible capital strategy.
HCH also maintains an extremely high level of free cash flow (FCF) generation capacity, which serves as a source of its flexible financial strategy and ability to create corporate value. In FY9/2024, FCF amounted to 478 million yen (operating cash flow of 481 million yen minus investment cash flow of –3 million yen), resulting in a stable and net cash inflow. This reflects sales growth while maintaining a certain level of profit, with limited growth investments, and indicates the soundness of the company’s cash generation model.
Despite being a labor-intensive business, the company’s cash flow structure is characterized by efficient working capital management and a non-asset-intensive business model, which minimizes elements that hinder cash accumulation. In the IT human resources services industry, the cycle from order to payment is relatively stable, making it easier to generate cash through operating activities in a planned manner. In addition, the absence of large-scale investment in tangible fixed assets also supports stable FCF.
Moreover, as of the end of FY9/2024, the company held 1.003 billion yen in cash and deposits and 375 million yen in interest-bearing debt, resulting in a net cash position of 628 million yen. Furthermore, without excessively using financial leverage, the equity ratio remains healthy at 44.8%, achieving both suppressed capital costs and resilience in fundraising. Under this net cash structure, the company ensures managerial flexibility and realizes the coexistence of growth and shareholder returns.
In fact, in terms of capital allocation, the company has taken an active stance toward both enhancing its business portfolio through M&A and implementing shareholder return policies. In FY9/2024, the company not only executed its fourth consecutive annual dividend increase (52 yen per share) but also implemented share buybacks (up to 220 million yen), resulting in a total return ratio of 32.8%. This aligns with the mid-term management plan policy of achieving a “total return ratio of 30% or more,” and demonstrates that its capital strategy of balancing dividends and share buybacks is effective.
The company has expressed its intention to continue its M&A strategy, and its ample net cash secures its capacity to execute such deals. This enables a financial structure capable of achieving both growth investments and shareholder returns—a significant strength. Furthermore, capital policies focused on enhancing corporate value based on cash generation are trustworthy strategies for medium- to long-term investors.
HCH, underpinned by its strong financial foundation supported by FCF generation, is rationally executing capital allocation aimed at maximizing corporate value. The company’s strategy of balancing financial flexibility with the quality of reinvestment is expected to significantly contribute to the sustainability of future EPS growth and market valuation. For investors, close attention should be paid to how the company’s FCF level evolves and how it is utilized in new businesses, M&A, and shareholder returns.
15. Future possibilities of shareholder return policy and evaluation of past results
Flexible returns through continuous dividend increases and share buybacks. A capital policy that balances both offensive and defensive strategies in line with earnings growth
HCH, despite being a growth-oriented company, has a clear policy on shareholder returns and has maintained a high level of actual returns. In FY9/2024, the company paid an annual dividend of 52 yen per share, representing a 1-yen increase from the previous fiscal year. With this, the company has achieved four consecutive years of dividend increases, embodying a stable and progressive dividend policy. Although the payout ratio was 21.1%, which is not an excessive level, it reflects a balanced approach with business growth and is a sustainable level worthy of evaluation.
Looking back on the return performance to date, the notable point is that profit growth and return levels have transitioned with a certain degree of consistency. In years when profits increased, the company conducted aggressive dividend increases and share buybacks; even in years when earnings stagnated, it maintained a stance focused on consistent shareholder returns without compromising the return level. This indicates that the company has implemented a comprehensive shareholder return strategy that extends beyond simple payout ratio control, encompassing capital structure management and the prevention of EPS dilution.
Going forward, as long as growth and cash generation capabilities are maintained, further dividend increases and continued implementation of share buybacks are considered possible. Especially given earnings forecasts for FY9/2025 and beyond, which anticipate a recovery in operating profit and net income, additional dividend increases or resumption of flexible share repurchases are seen as highly realistic options. Furthermore, the financial capacity to balance investments such as M&A for growth acceleration and shareholder returns will serve as a reassuring factor for institutional investors seeking long-term holdings.
Therefore, HCH’s shareholder return policy is a strategic response that combines both stability and flexibility and is highly rated for maintaining an exceptionally high level of total returns for a growth company. From the perspectives of both corporate value creation and shareholder value return, the company can be positioned as one that consistently implements a highly reliable capital policy for investors.
16. Corporate value assessment (DCF, PER/PBR analysis)
Valuation that incorporates bullish growth scenarios. Focus on substantial undervaluation adjusted for risk premium and net cash.
The current market valuation is at a level that incorporates relatively bullish growth expectations even within the Growth Market. Specifically, based on FY9/2024 results, the forecast PER is 12.22x, and PBR is 2.67x. Considering the ROE (28.3%), this can be interpreted as a valuation level with a certain degree of rationality. On the other hand, the company holds ample net cash (approximately 500 million yen, or 13% of its 4.0 billion yen market capitalization), and adjusting for this results in an effective PER slightly below 11x. On an earnings yield basis, this corresponds to about 9.7%, and given the company’s growth and capital efficiency, the stock can be considered relatively undervalued.
Regarding the PBR level, considering that the ROE is maintained at a level significantly exceeding the cost of capital, applying the simple theoretical formula PBR ≈ ROE ÷ cost of capital suggests that the current valuation is appropriate. For instance, assuming a cost of equity of 8%, 28.3% ÷ 8% = approximately 3.54 times would be the theoretical upper bound for PBR, indicating that the actual value of 2.67 times is somewhat conservative. This suggests that the current share price may not fully reflect upside potential for growth or the business portfolio expansion scenario.
From a DCF (discounted cash flow) analysis perspective, it is possible to estimate future cash flows based on the currently disclosed mid-term management plan (through FY9/2030), specifically scenario C (EPS: 1,016 yen) and scenario D (EPS: 1,850 yen). If scenario C is realized and EPS becomes approximately 4.1x the current level, and assuming a constant PER of 12x, the theoretical share price could correspond to approximately 4x the current price. Under the more optimistic scenario D, with EPS at approximately 7.5 times, the theoretical share price could exceed 7 times. Of course, these depend on multiple assumptions, such as sustained business growth, human capital expansion, and the effectiveness of mergers and acquisitions (M&A). However, from a DCF-based approach, it can be said that the current share price does not yet fully reflect the company’s long-term growth potential.
On the other hand, in the short term, rising valuations may be constrained by increasing personnel expenses and temporary profit stagnation, which could lead to an inflated PER. Particularly in a labor-intensive business structure, expansion in hiring and reinforcement of the performance-based compensation system may temporarily suppress profit margins and slow the pace of EPS growth, which warrants caution.
Based on the above, HCH’s corporate value, assuming mid- to long-term EPS growth potential and sustained high ROE, can be evaluated as slightly conservative to appropriate at the current share price level. From a DCF perspective, considerable upside potential remains, and both PER and PBR are supported by fundamentals, suggesting that any adjustment phase in the stock price may present a good opportunity for buying on dips. For corporate investors, this is a phase where focus should be placed less on short-term earnings fluctuations and more on mid-term capital profitability and free cash flow growth trajectory.
17. Comparative multiple analysis with peers
HCH remains undervalued compared with peers despite its high profitability and sound financial position, and a revaluation is expected going forward.
The “IT engineer staffing, contracted development, and IT consulting” field to which HCH belongs is structured such that, while being based on human capital, differentiation in high-value-added areas directly affects each company’s market valuation. HCH is not limited to SES (System Engineering Services); it is expanding into value-added services, such as IT consulting, PMO support, and AI solutions, through its group company, TARA. This expansion sets its corporate structure apart from that of typical staffing firms.
Major peers include TechnoPro Holdings (6028), Open Up Group (2154), and SHIFT (3697). These companies all have certain growth track records and are recognized by the market, with PERs as of July 2025 at 24.06x for TechnoPro, 56.70x for SHIFT, and 14.33x for Open Up Group. In contrast, HCH stands at only 12.22x. This is notable given that it has achieved an outstanding capital efficiency with an ROE of 28.3%, yet still receives a conservative market valuation.
In terms of PBR, TechnoPro is at 5.51x, SHIFT at 12.45x, and Open Up Group at 1.99x, while HCH remains at 2.67x. Examining the relationship between ROE and PBR, it appears that the market has lagged in recognizing HCH’s profitability. In other words, if the company’s growth materializes going forward, a valuation re-rating may occur.
Furthermore, HCH’s sound financial position—maintaining net cash while also achieving both aggressive share buybacks and continuous dividend increases—is another characteristic that distinguishes it from peers. Companies like SHIFT, which are high-growth IT firms, have been awarded high valuations, but HCH already derives over 30% of its revenue from strategic domains. If progress is made toward EPS growth and the mid-term management target of 1,000 yen in EPS, it is entirely possible that the company could shift into a similar valuation range.
Among peers, HCH boasts the highest ROE, yet its PER and PBR remain at conservative levels, raising expectations for future revaluation. Especially since few companies in the market combine all three strengths—growth potential, capital efficiency, and financial soundness—HCH’s current stock price can be considered to offer strong investment appeal. During the valuation correction process, a renewed assessment by institutional investors may also come into view.
| Company name (Securities code) |
Market capitalization (Billion yen) |
PER (X) | PBR (X) | ROE (%) | Comment |
| Human Creation Holdings (7361) | 4.0 | 12.22 | 2.67 | 28.3 | Characterized by high ROE and net cash structure |
| Open Up Group (2154) | 157.6 | 14.33 | 1.99 | 17.0 | Major engineering staffing company spanning construction, manufacturing, and IT |
| TechnoPro Holdings (6028) | 445.1 | 24.06 | 5.51 | 18.8 | Leading technical staffing agency. Steady profit growth. |
| SHIFT (3697) | 453.5 | 56.70 | 12.45 | 16.4 | High growth. Focusing on IT consulting and PMO support. |
Key stock price data
Key financial data
| Unit: million yen | 2021 | 2022 | 2023 | 2024 | 2025CE |
| Sales | 5,035 | 5,803 | 6,487 | 7,166 | 8,906 |
| EBIT (Operating Income) | 478 | 545 | 698 | 631 | 635 |
| Pretax Income | 464 | 546 | 701 | 630 | |
| Net Profit Attributable to Owner of Parent | 276 | 343 | 438 | 404 | 327 |
| Cash & Short-Term Investments | 846 | 673 | 1,020 | 1,003 | |
| Total assets | 2,192 | 2,536 | 2,963 | 2,978 | |
| Total Debt | 266 | 546 | 641 | 376 | |
| Net Debt | -580 | -127 | -379 | -627 | |
| Total liabilities | 1,128 | 1,620 | 1,901 | 1,625 | |
| Total Shareholders’ Equity | 1,064 | 916 | 1,062 | 1,353 | |
| Net Operating Cash Flow | 268 | 373 | 723 | 481 | |
| Capital Expenditure | 11 | 3 | 17 | 7 | |
| Net Investing Cash Flow | -52 | -335 | -169 | -3 | |
| Net Financing Cash Flow | 44 | -212 | -206 | -496 | |
| Free Cash Flow | 257 | 370 | 717 | 475 | |
| ROA (%) | 13.63 | 14.51 | 15.95 | 13.60 | |
| ROE (%) | 32.43 | 34.65 | 44.34 | 33.47 | |
| EPS (Yen) | 71.6 | 94.6 | 132.4 | 123.1 | 103.48* |
| BPS (Yen) | 276.2 | 265.6 | 324.1 | 415.9 | |
| Dividend per Share (Yen) | 24.49 | 25.00 | 25.50 | 26.00 | 27.00 |
| Shares Outstanding (Million shares) | 3.85 | 3.85 | 3.85 | 3.57 |
*Adjusted EPS excluding the impact of loss on valuation of investment securities was ¥127.84.
Source: Omega Investment from company data, rounded to the nearest whole number
Share price
Financial data (quarterly basis)
| Unit: million yen | 2023/9 | 2024/9 | 2025/9 | ||||||
| 2Q | 3Q | 4Q | 1Q | 2Q | 3Q | 4Q | 1Q | 2Q | |
| (Income Statement) | |||||||||
| Sales | 1,620 | 1,671 | 1,632 | 1,649 | 1,770 | 1,845 | 1,902 | 2,013 | 2,058 |
| Year-on-year | 16.7% | 11.0% | 5.6% | 5.4% | 9.3% | 10.4% | 16.6% | 22.1% | 16.3% |
| Cost of Goods Sold (COGS) | 1,132 | 1,158 | 1,127 | 1,184 | 1,262 | 1,295 | 1,346 | 1,421 | 1,473 |
| Gross Income | 488 | 513 | 505 | 465 | 508 | 550 | 557 | 592 | 585 |
| Gross Income Margin | 30.1% | 30.7% | 30.9% | 28.2% | 28.7% | 29.8% | 29.3% | 29.4% | 28.4% |
| SG&A Expense | 300 | 324 | 329 | 325 | 373 | 369 | 381 | 380 | 419 |
| EBIT (Operating Income) | 187 | 189 | 176 | 140 | 135 | 180 | 176 | 212 | 166 |
| Year-on-year | 28.9% | 39.5% | -1.7% | -3.7% | -27.9% | -4.5% | -0.4% | 51.7% | 22.7% |
| Operating Income Margin | 11.6% | 11.3% | 10.8% | 8.5% | 7.6% | 9.8% | 9.2% | 10.6% | 8.1% |
| EBITDA | 216 | 218 | 205 | 169 | 166 | 212 | 207 | 243 | 199 |
| Pretax Income | 190 | 190 | 175 | 139 | 135 | 182 | 174 | 212 | 87 |
| Consolidated Net Income | 120 | 126 | 92 | 89 | 92 | 110 | 113 | 132 | 42 |
| Minority Interest | 0 | 0 | 0 | 0 | 0 | 0 | 0 | 0 | 0 |
| Net Income ATOP | 120 | 126 | 92 | 89 | 92 | 110 | 113 | 132 | 42 |
| Year-on-year | 38.2% | 47.9% | -29.4% | -10.9% | -23.4% | -12.9% | 22.4% | 48.3% | -54.4% |
| Net Income Margin | 7.4% | 7.6% | 5.7% | 5.4% | 5.2% | 6.0% | 6.0% | 6.6% | 2.0% |
| (Balance Sheet) | |||||||||
| Cash & Short-Term Investments | 495 | 782 | 1,020 | 952 | 995 | 1,122 | 1,003 | 938 | 1,200 |
| Total assets | 2,794 | 2,999 | 2,963 | 2,791 | 2,997 | 3,035 | 2,978 | 3,004 | 3,365 |
| Total Debt | 878 | 845 | 641 | 587 | 574 | 425 | 376 | 326 | 702 |
| Net Debt | 383 | 63 | -379 | -365 | -420 | -697 | -627 | -612 | -499 |
| Total liabilities | 1,932 | 1,999 | 1,901 | 1,695 | 1,788 | 1,764 | 1,625 | 1,602 | 2,013 |
| Total Sharehjolders’ Equity | 862 | 999 | 1,062 | 1,096 | 1,209 | 1,271 | 1,353 | 1,402 | 1,352 |
| (Profitability %) | |||||||||
| ROA | 17.51 | 17.34 | 15.95 | 15.54 | 13.80 | 12.70 | 13.60 | 15.43 | 12.48 |
| ROE | 50.20 | 51.25 | 44.34 | 47.24 | 38.60 | 33.76 | 33.47 | 35.80 | 31.01 |
| (Per-share) Unit: JPY | |||||||||
| EPS | 36.6 | 38.5 | 28.2 | 27.2 | 27.9 | 33.4 | 34.7 | 40.6 | 13.2 |
| BPS | 263.0 | 305.0 | 324.1 | 334.4 | 366.4 | 387.1 | 415.9 | 431.0 | 429.8 |
| Dividend per Share | 0.00 | 0.00 | 25.50 | 0.00 | 0.00 | 0.00 | 26.00 | 0.00 | 0.00 |
| Shares Outstanding(milion shares) | 3.85 | 3.85 | 3.85 | 3.85 | 3.85 | 3.85 | 3.85 | 3.57 | 3.57 |
Source: Omega Investment from company materials
Financial data (full-year basis)
| Unit: million yen | 2021 | 2022 | 2023 | 2024 |
| (Income Statement) | ||||
| Sales | 5,035 | 5,803 | 6,487 | 7,166 |
| Year-on-year | 10.3% | 15.3% | 11.8% | 10.5% |
| Cost of Goods Sold | 3,607 | 4,030 | 4,522 | 5,087 |
| Gross Income | 1,428 | 1,773 | 1,965 | 2,079 |
| Gross Income Margin | 28.4% | 30.6% | 30.3% | 29.0% |
| SG&A Expense | 950 | 1,228 | 1,267 | 1,448 |
| EBIT (Operating Income) | 478 | 545 | 698 | 631 |
| Year-on-year | 57.5% | 14.0% | 28.0% | -9.6% |
| Operating Income Margin | 9.5% | 9.4% | 10.8% | 8.8% |
| EBITDA | 558 | 659 | 813 | 754 |
| Pretax Income | 464 | 546 | 701 | 630 |
| Consolidated Net Income | 276 | 343 | 438 | 404 |
| Minority Interest | 0 | 0 | 0 | 0 |
| Net Income ATOP | 276 | 343 | 438 | 404 |
| Year-on-year | 31.2% | 24.3% | 27.8% | -7.8% |
| Net Income Margin | 5.5% | 5.9% | 6.8% | 5.6% |
| (Balance Sheet) | ||||
| Cash & Short-Term Investments | 846 | 673 | 1,020 | 1,003 |
| Total assets | 2,192 | 2,536 | 2,963 | 2,978 |
| Total Debt | 266 | 546 | 641 | 376 |
| Net Debt | -580 | -127 | -379 | -627 |
| Total liabilities | 1,128 | 1,620 | 1,901 | 1,625 |
| Total Shareholders’ Equity | 1,064 | 916 | 1,062 | 1,353 |
| (Cash Flow) | ||||
| Net Operating Cash Flow | 268 | 373 | 723 | 481 |
| Capital Expenditure | 11 | 3 | 17 | 7 |
| Net Investing Cash Flow | -52 | -335 | -169 | -3 |
| Net Financing Cash Flow | 44 | -212 | -206 | -496 |
| Free Cash Flow | 257 | 370 | 717 | 475 |
| (Profitability ) | ||||
| ROA (%) | 13.63 | 14.51 | 15.95 | 13.60 |
| ROE (%) | 32.43 | 34.65 | 44.34 | 33.47 |
| Net Margin (%) | 5.48 | 5.91 | 6.76 | 5.64 |
| Asset Turn | 2.49 | 2.45 | 2.36 | 2.41 |
| Assets/Equity | 2.38 | 2.39 | 2.78 | 2.46 |
| (Per-share) Unit: JPY | ||||
| EPS | 71.6 | 94.6 | 132.4 | 123.1 |
| BPS | 276.2 | 265.6 | 324.1 | 415.9 |
| Dividend per Share | 24.49 | 25.00 | 25.50 | 26.00 |
| Shares Outstanding (million shares) | 3.85 | 3.85 | 3.85 | 3.57 |
Source: Omega Investment from company materials