2026-04-10
Home
Japanese

Omega Investment Co., Ltd.
CHUGAI RO (Company note – 1Q update)

| Share price (9/2) | ¥3,995 | Dividend Yield (26/3 CE) | 3.8 % |
| 52weeks high/low | ¥2,515/4,120 | ROE(25/3) | 10.7 % |
| Avg Vol (3 month) | 33.1 thou shrs | Operating margin (25/3) | 7.5 % |
| Market Cap | ¥31.16 bn | Beta (5Y Monthly) | 0.30 |
| Enterprise Value | ¥29.63 bn | Shares Outstanding | 7.800 mn shrs |
| PER (26/3 CE) | 10.4 X | Listed market | TSE Prime section |
| PBR (25/3 act) | 1.1 X |
| Click here for the PDF version of this page |
| PDF version |
1Q FY3/2026 saw increased orders, higher sales, and a smaller operating loss, a good start.
◇ 1Q FY3/2026 results highlights: increased orders, higher sales, and a smaller operating loss.
The 1Q FY3/2026 results that CHUGAI RO (hereinafter, the Company) announced on July 25, 2025, got off to a good start relative to the full-year earnings forecast.
Order intake was 11.71 billion yen (up 44% YoY), order backlog was 43.03 billion yen (up 15% YoY), net sales were 6.34 billion yen (up 20% YoY), operating loss was 0.37 billion yen (loss narrowed YoY), and ordinary loss was 0.25 billion yen (loss narrowed YoY). Profit attributable to owners of parent was 0.70 billion yen (turned to profit YoY).
The key points of these results are the following three.
First, the probability of achieving the full-year company forecast has increased. With order intake and order backlog both rising solidly and profit and loss improving through substantial revenue growth and reduced deficit, progress versus the full-year company forecast is generally steady. Although the Company’s results have strong seasonality and tend to accumulate profit in the second half, the fact that performance has been constant from the beginning of the year and profit and loss are improving is a reassuring factor when considering the certainty of the full-year company forecast.
Second, qualitative enrichment of order intake and profit/loss. As an essential strategy of its Medium-Term Management Plan, the Company is promoting the creation of new markets centered on carbon neutrality and enhancing existing products to meet customer needs. These initiatives in the quarter led to orders for large projects in the Plant Engineering Business and new orders in the Development Business. The latter is presumed to be a new product, electric furnace dust recycling equipment for steel, and can be expected to expand in the medium term (see the Company’s press release dated June 16, 2025, “Received an order for ‘electric furnace dust recycling equipment’ from Tokyo Steel Manufacturing Co., Ltd.”). In addition, on the profit and loss front, the gross profit margin improved by four percentage points YoY, primarily as a result of promoting order intake at appropriate prices.
Third, progress in the sale of cross-shareholdings. In the quarter, 1.28 billion yen in extraordinary income was recorded.
◇ FY3/2026 earnings forecast:
Although the Company discloses only the full-year forecast, because the first quarter was strong, the initial estimates have been left unchanged.
Net sales are 37.50 billion yen (up 3% YoY), operating profit is 3.00 billion yen (up 9% YoY), ordinary profit is 3.15 billion yen (up 4% YoY), and profit attributable to owners of parent is 2.80 billion yen (down 6% YoY). There are also no changes to net income per share of 387.2 yen and an annual dividend per share of 150 yen.
◇Stock price trends and points of focus going forward
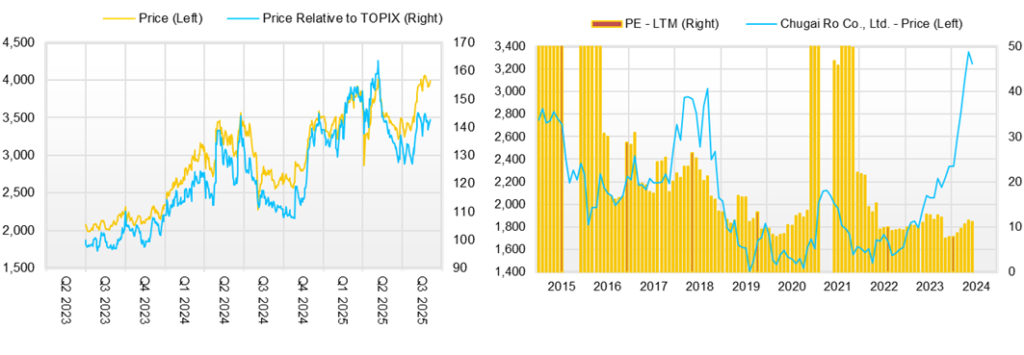
The Company’s stock price rose to 4,045 yen after the announcement of results for FY3/2025, but then from June moved in the 3,200–3,500 yen range. After the announcement of these first quarter results, using the factors described above as clues, it rose again and marked a high of 3,795 yen.
As a result, the current PBR has reached 1.0 times. However, the forward PER is about 9.6 times, and there is still no sense of overheating.
For the stock price to rise further going forward, it is essential that the positive factors of the first quarter continue into the second quarter and beyond, that the increase in order intake and the underpinning of profit and loss continue, and that, as a result, the probability of achieving the full-year FY3/2026 company forecast increases further. That visibility also emerges regarding the likelihood of achieving the targets for the final year of the current Medium-Term Management Plan (net sales of 41.5 billion yen, operating profit of 3.62 billion yen, and ROE of 10%).
Through interviews with the Company, we have confirmed the Company’s recognition of the business environment, and that no significant changes have been seen so far in the order environment. Therefore, it appears we can continue to expect the results of the creation of new markets centered on carbon neutrality that the Company has been developing to date, and the expansion of sales and improvement of profit through brushing up existing products.
However, in the first quarter, because the automotive industry, a key customer, delayed investment to determine the course of U.S. tariffs, order intake in the Heat Treatment Business decreased 19% YoY. Although such a situation is highly likely to be temporary, there is also a possibility that investment destinations will shift from Japan to overseas, and the Company also needs to connect this to winning orders flexibly.
Based on the above, a certain degree of attention is required for the order environment and the customer trends behind it. We would like to check that investment by the automotive industry is steadily captured, that the impact of NIPPON STEEL CORPORATION’s expansion into North America is turned into a positive, and that there is no significant change in customers’ stance toward carbon neutrality.
Order intake trend
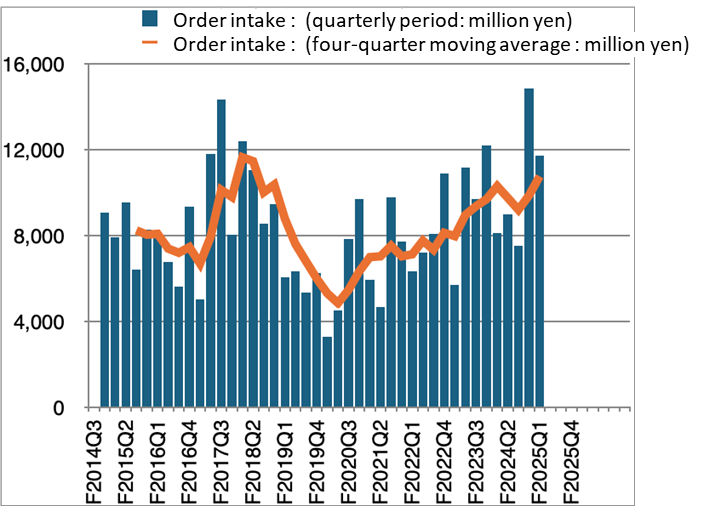
Source: Omega Investment from company materials
Company profile
CHUGAI RO CO., LTD.is Japan’s leading manufacturer of industrial furnaces and industrial burners, whose management philosophy is: “Chugai Ro creates new value through its core of thermal technology, thus contributing to society while realizing the prosperity of the company and the happiness of its employees.” With a track record of developing over 100 types of industrial furnaces, the Company is known as a “department store of industrial furnaces.” Under the slogan “Pioneering the future with thermal technology,” and based on its foundational technologies in thermal technology, engineering capabilities, and advanced technology accumulated since its founding in 1945, the Company provides industrial furnaces and related equipment to the steel, automotive, and information and communications industries. Currently, based on its Management Vision 2026, “Renovate ourselves to develop our future with the technology for carbon neutrality!”, the Company aims to contribute to society and expand corporate value through carbon-neutral technology under its Medium-Term Management Plan (FY2022–FY2026). Attention from the stock market is increasing.
Key financial data
| Unit: million yen | 2021 | 2022 | 2023 | 2024 | 2025 | 2026 CE |
| Sales | 24,717 | 26,317 | 27,976 | 29,283 | 36,247 | 37,500 |
| EBIT (Operating Income) | 389 | 1,264 | 1,310 | 1,479 | 2,737 | 3,000 |
| Pretax Income | 527 | 1,594 | 1,699 | 3,129 | 4,222 | |
| Net Profit Attributable to Owner of Parent | 329 | 1,360 | 1,231 | 2,197 | 2,998 | 2,800 |
| Cash & Short-Term Investments | 7,121 | 11,130 | 7,884 | 10,061 | 4,392 | |
| Total assets | 38,577 | 38,141 | 41,178 | 48,863 | 48,736 | |
| Total Debt | 5,988 | 3,988 | 3,988 | 7,288 | 5,507 | |
| Net Debt | -1,133 | -7,142 | -3,896 | -2,773 | 1,115 | |
| Total liabilities | 16,784 | 14,928 | 17,134 | 21,092 | 20,125 | |
| Total Shareholders’ Equity | 21,681 | 23,068 | 23,860 | 27,570 | 28,329 | |
| Net Operating Cash Flow | 3,300 | 6,090 | -2,500 | -891 | -3,696 | |
| Capital Expenditure | 442 | 317 | 240 | 1,335 | 798 | |
| Net Investing Cash Flow | -551 | 510 | -63 | 550 | 654 | |
| Net Financing Cash Flow | -4,481 | -2,508 | -727 | 2,451 | -2,701 | |
| Free Cash Flow | 3,036 | 5,963 | -2,688 | -2,161 | -4,419 | |
| ROA (%) | 0.77 | 3.55 | 3.10 | 4.88 | 6.14 | |
| ROE (%) | 1.56 | 6.08 | 5.25 | 8.54 | 10.73 | |
| EPS (Yen) | 42.9 | 177.2 | 162.0 | 293.8 | 407.6 | |
| BPS (Yen) | 2,824.1 | 3,005.3 | 3,146.7 | 3,709.0 | 3,859.0 | |
| Dividend per Share (Yen) | 60.00 | 70.00 | 70.00 | 80.00 | 150.00 | |
| Shares Outstanding (Million shares) | 7.80 | 7.80 | 7.80 | 7.80 | 7.80 |
Share price
Financial data (quarterly basis)
| Unit: million yen | 2024/3 | 2025/3 | 2026/3 | ||||||
| 1Q | 2Q | 3Q | 4Q | 1Q | 2Q | 3Q | 4Q | 1Q | |
| (Income Statement) | |||||||||
| Sales | 4,741 | 7,868 | 5,837 | 10,837 | 5,280 | 9,441 | 7,498 | 14,028 | 6,347 |
| Year-on-year | 28.4% | 33.5% | -15.3% | -5.7% | 11.4% | 20.0% | 28.5% | 29.4% | 20.2% |
| Cost of Goods Sold (COGS) | 4,292 | 6,287 | 4,905 | 7,681 | 4,759 | 7,521 | 6,138 | 10,238 | 5,464 |
| Gross Income | 449 | 1,581 | 932 | 3,156 | 521 | 1,920 | 1,360 | 3,790 | 883 |
| Gross Income Margin | 9.5% | 20.1% | 16.0% | 29.1% | 9.9% | 20.3% | 18.1% | 27.0% | 13.9% |
| SG&A Expense | 1,075 | 1,205 | 1,121 | 1,238 | 1,203 | 1,160 | 1,163 | 1,328 | 1,254 |
| EBIT (Operating Income) | -626 | 376 | -189 | 1,918 | -682 | 760 | 197 | 2,462 | -371 |
| Year-on-year | -14.6% | 817.1% | -253.7% | 2.1% | 8.9% | 102.1% | -204.2% | 28.4% | -45.6% |
| Operating Income Margin | -13.2% | 4.8% | -3.2% | 17.7% | -12.9% | 8.0% | 2.6% | 17.6% | -5.8% |
| EBITDA | -531 | 474 | -58 | 2,068 | -551 | 902 | 334 | 2,604 | -253 |
| Pretax Income | -440 | 1,477 | 189 | 1,903 | 50 | 775 | 704 | 2,693 | 1,032 |
| Consolidated Net Income | -291 | 1,015 | 101 | 1,391 | -9 | 544 | 504 | 2,033 | 672 |
| Minority Interest | -8 | -14 | -5 | 46 | 2 | 15 | 16 | 41 | -31 |
| Net Income ATOP | -283 | 1,030 | 106 | 1,344 | -12 | 530 | 487 | 1,993 | 704 |
| Year-on-year | -28.0% | 751.2% | -30.3% | -0.5% | -95.8% | -48.5% | 359.4% | 48.3% | – |
| Net Income Margin | -6.0% | 13.1% | 1.8% | 12.4% | -0.2% | 5.6% | 6.5% | 14.2% | 11.1% |
| (Balance Sheet) | |||||||||
| Cash & Short-Term Investments | 9,165 | 9,688 | 8,640 | 10,061 | 6,097 | 5,567 | 3,855 | 4,392 | 6,071 |
| Total assets | 44,558 | 47,895 | 46,439 | 48,863 | 43,463 | 45,170 | 43,667 | 48,736 | 46,023 |
| Total Debt | 8,184 | 10,280 | 8,402 | 7,288 | 6,209 | 7,180 | 6,687 | 5,507 | 6,397 |
| Net Debt | -981 | 592 | -238 | -2,773 | 112 | 1,613 | 2,832 | 1,115 | 326 |
| Total liabilities | 20,248 | 23,133 | 21,744 | 21,092 | 17,079 | 18,797 | 17,115 | 20,125 | 18,878 |
| Total Sharehjolders’ Equity | 24,131 | 24,591 | 24,544 | 27,570 | 26,178 | 26,143 | 26,321 | 28,329 | 26,908 |
| (Profitability %) | |||||||||
| ROA | 3.34 | 5.40 | 5.29 | 4.88 | 5.61 | 4.23 | 5.22 | 6.14 | 8.30 |
| ROE | 5.84 | 9.68 | 9.40 | 8.54 | 9.82 | 7.76 | 9.24 | 10.73 | 13.99 |
| (Per-share) Unit: JPY | |||||||||
| EPS | -37.5 | 137.7 | 14.3 | 180.8 | -1.6 | 71.9 | 66.3 | 271.5 | 96.6 |
| BPS | 3,204.6 | 3,307.9 | 3,301.7 | 3,709.0 | 3,565.6 | 3,561.1 | 3,585.4 | 3,859.0 | 3,717.8 |
| Dividend per Share | 0.00 | 0.00 | 0.00 | 80.00 | 0.00 | 0.00 | 0.00 | 150.00 | 0.00 |
| Shares Outstanding (million shares) | 7.80 | 7.80 | 7.80 | 7.80 | 7.80 | 7.80 | 7.80 | 7.80 | 7.80 |
Financial data (full-year basis)
| Unit: million yen | 2016 | 2017 | 2018 | 2019 | 2020 | 2021 | 2022 | 2023 | 2024 | 2025 |
| (Income Statement) | ||||||||||
| Sales | 32,795 | 31,146 | 30,829 | 37,089 | 38,089 | 24,717 | 26,317 | 27,976 | 29,283 | 36,247 |
| Year-on-year | 33.6% | -5.0% | -1.0% | 20.3% | 2.7% | -35.1% | 6.5% | 6.3% | 4.7% | 23.8% |
| Cost of Goods Sold | 28,449 | 26,575 | 25,795 | 32,140 | 32,023 | 20,282 | 21,007 | 22,494 | 23,448 | 28,656 |
| Gross Income | 4,346 | 4,571 | 5,034 | 4,949 | 6,066 | 4,435 | 5,310 | 5,482 | 5,835 | 7,591 |
| Gross Income Margin | 13.3% | 14.7% | 16.3% | 13.3% | 15.9% | 17.9% | 20.2% | 19.6% | 19.9% | 20.9% |
| SG&A Expense | 3,669 | 3,797 | 3,853 | 3,962 | 4,354 | 4,046 | 4,046 | 4,172 | 4,356 | 4,854 |
| EBIT (Operating Income) | 677 | 774 | 1,181 | 987 | 1,712 | 389 | 1,264 | 1,310 | 1,479 | 2,737 |
| Year-on-year | 180.9% | 14.3% | 52.6% | -16.4% | 73.5% | -77.3% | 224.9% | 3.6% | 12.9% | 85.1% |
| Operating Income Margin | 2.1% | 2.5% | 3.8% | 2.7% | 4.5% | 1.6% | 4.8% | 4.7% | 5.1% | 7.6% |
| EBITDA | 1,037 | 1,112 | 1,527 | 1,378 | 2,080 | 749 | 1,676 | 1,710 | 1,953 | 3,289 |
| Pretax Income | 715 | 967 | 1,294 | 1,177 | 1,701 | 527 | 1,594 | 1,699 | 3,129 | 4,222 |
| Consolidated Net Income | 572 | 1,000 | 905 | 781 | 1,158 | 364 | 1,429 | 1,295 | 2,216 | 3,072 |
| Minority Interest | 27 | 21 | 40 | 26 | 37 | 35 | 69 | 64 | 19 | 74 |
| Net Income ATOP | 545 | 978 | 864 | 754 | 1,120 | 329 | 1,360 | 1,231 | 2,197 | 2,998 |
| Year-on-year | 79.9% | 79.4% | -11.7% | -12.7% | 48.5% | -70.6% | 313.4% | -9.5% | 78.5% | 36.5% |
| Net Income Margin | 1.7% | 3.1% | 2.8% | 2.0% | 2.9% | 1.3% | 5.2% | 4.4% | 7.5% | 8.3% |
| (Balance Sheet) | ||||||||||
| Cash & Short-Term Investments | 6,923 | 7,833 | 6,858 | 5,169 | 8,658 | 7,121 | 11,130 | 7,884 | 10,061 | 4,392 |
| Total assets | 39,665 | 38,502 | 41,368 | 42,731 | 46,696 | 38,577 | 38,141 | 41,178 | 48,863 | 48,736 |
| Total Debt | 3,988 | 3,988 | 4,010 | 4,995 | 9,988 | 5,988 | 3,988 | 3,988 | 7,288 | 5,507 |
| Net Debt | -2,935 | -3,845 | -2,848 | -174 | 1,330 | -1,133 | -7,142 | -3,896 | -2,773 | 1,115 |
| Total liabilities | 20,300 | 18,131 | 20,131 | 21,774 | 26,006 | 16,784 | 14,928 | 17,134 | 21,092 | 20,125 |
| Total Shareholders’ Equity | 19,292 | 20,295 | 21,138 | 20,875 | 20,589 | 21,681 | 23,068 | 23,860 | 27,570 | 28,329 |
| (Cash Flow) | ||||||||||
| Net Operating Cash Flow | 1,260 | 1,033 | 377 | -1,348 | -580 | 3,300 | 6,090 | -2,500 | -891 | -3,696 |
| Capital Expenditure | 290 | 113 | 420 | 456 | 244 | 442 | 317 | 240 | 1,335 | 798 |
| Net Investing Cash Flow | -499 | 402 | -837 | -478 | -442 | -551 | 510 | -63 | 550 | 654 |
| Net Financing Cash Flow | -405 | -484 | -468 | 279 | 4,510 | -4,481 | -2,508 | -727 | 2,451 | -2,701 |
| Free Cash Flow | 1,016 | 933 | 2 | -1,725 | -775 | 3,036 | 5,963 | -2,688 | -2,161 | -4,419 |
| (Profitability ) | ||||||||||
| ROA (%) | 1.45 | 2.50 | 2.17 | 1.80 | 2.51 | 0.77 | 3.55 | 3.10 | 4.88 | 6.14 |
| ROE (%) | 2.78 | 4.95 | 4.18 | 3.59 | 5.41 | 1.56 | 6.08 | 5.25 | 8.54 | 10.73 |
| Net Margin (%) | 1.66 | 3.14 | 2.81 | 2.04 | 2.94 | 1.33 | 5.17 | 4.40 | 7.50 | 8.27 |
| Asset Turn | 0.87 | 0.80 | 0.77 | 0.88 | 0.85 | 0.58 | 0.69 | 0.71 | 0.65 | 0.74 |
| Assets/Equity | 1.92 | 1.97 | 1.93 | 2.00 | 2.16 | 2.02 | 1.71 | 1.69 | 1.75 | 1.75 |
| (Per-share) Unit: JPY | ||||||||||
| EPS | 70.0 | 125.7 | 111.0 | 97.2 | 145.9 | 42.9 | 177.2 | 162.0 | 293.8 | 407.6 |
| BPS | 2,478.6 | 2,607.8 | 2,716.9 | 2,718.6 | 2,681.5 | 2,824.1 | 3,005.3 | 3,146.7 | 3,709.0 | 3,859.0 |
| Dividend per Share | 60.00 | 60.00 | 60.00 | 60.00 | 60.00 | 60.00 | 70.00 | 70.00 | 80.00 | 150.00 |
| Shares Outstanding (million shares) | 7.80 | 7.80 | 7.80 | 7.80 | 7.80 | 7.80 | 7.80 | 7.80 | 7.80 | 7.80 |