2026-04-10
Home
Japanese

Omega Investment Co., Ltd.
MAMEZO DIGITAL HOLDINGS (Investment report – Basic report)
| Share price (9/2) | ¥1,816 | Dividend Yield (26/3 CE) | 3.4 % |
| 52weeks high/low | ¥1,090/2,020 | ROE(25/3) | 50.6 % |
| Avg Vol (3 month) | 124.3 thou shrs | Operating margin (25/3) | 19.6 % |
| Market Cap | ¥29.15 bn | Beta (5Y Monthly) | N/A |
| Enterprise Value | ¥26.15 bn | Shares Outstanding | 16.050 mn shrs |
| PER (26/3 CE) | 19.3 X | Listed market | TSE Growth |
| PBR (25/3 act) | 10.4 X |
| Click here for the PDF version of this page |
| PDF version |
Upstream business × AI robotics drives the business. A wide WACC spread with ROIC of approximately 47%. Growth sustainability is to be secured through productization and the shift to a standalone operating company.
Investment conclusion
MAMEZO DIGITAL HOLDINGS CO., LTD. is a company with solid structural earnings power, characterized by a large spread where the ROIC (approximately 47%) exceeds the WACC (approximately 7%), driven by a business model centered on intangible assets and high turnover, and backed by financial resilience underpinned by net cash. Strategic investment in AI robotics is accelerating, driven by the adoption of AI in national projects, and the business impact of tariffs is expected to be limited, with further easing anticipated. In light of these developments, we see increased upside potential for the full year earnings compared to previous expectations.
From a stock valuation perspective, with a PER of just over 20x, a PBR of 9–11x, and a dividend payout ratio of 67.1%, the market appears to be pricing in secular EPS growth of around +14% per annum. Compared with a roughly +7% four-year CAGR using the current fiscal year’s company forecast as the endpoint, this can be said to be partly front-running future growth; however, it is generally consistent with the Company’s medium-term plan (FY2025/3 → FY2027/3: sales CAGR +10–12%, operating profit CAGR +15–17% – note that the Company’s forecast EPS is a reference value assuming continued consolidation, because following the absorption-type merger of the three subsidiaries on October 1, 2025, disclosure will be on a non-consolidated basis.) Meanwhile, a dividend yield of approximately 3.2% is likely to support the share price on the downside. As for investment stance, we approach with “neutral to positive,” mindful of a near-term sense of a valuation ceiling, and would actively buy on dips. With the transition to an operating company structure in October ahead, the quality of KPI disclosure after integration will determine the accuracy of investment judgments. For sustaining and re-accelerating valuation, three key points are essential: visualization of progress and a monetization roadmap for the national project, confirmation of further easing in the tariff environment, and upside on an actual-results basis through the accumulation of high-value-added projects.
In the first quarter, net sales were 2.888 billion yen (YoY +6.3%) and operating profit was 538 million yen (YoY +0.8%). Excluding one-off expenses such as advertising and promotion, as well as differences in the number of workable days in the Mobility Automation area and AI robotics investments, this corresponds to a real increase of +13.7% in profit. Progress against full-year plans was steady, with net sales increasing by 24.9% and operating profit by 25.1%. Strategic investment in the AI robotics sector is accelerating with the adoption of a national project, and the Company is advancing its growth strategy while taking into account the uncertainty in the economic environment due to tariff impacts. Shareholder returns have been clarified at an annual dividend of 61 yen per share (introducing a 30 yen interim dividend). Key current indicators are: forecast PER 21.17x, PBR 10.92x, ROE 50.6%, ROIC 47.2%, market capitalization of 30.6 billion yen, dividend yield approximately 3.2%, and net cash of 1.73 billion yen as of FY2025/3 and 1.129 billion yen at the end of FY2026/3 Q1.
1. Company overview
“Client-side perspective × AI software engineering.” Increasing agility by shifting from a holding company to an operating company
The Company is an independent technology company focused on AI software engineering and robotics engineering, offering high-value-added consulting/development/training across four categories: Cloud Consulting, AI Consulting, AI Robotics Engineering, and Mobility Automation. Its mission is “Co-create digitalized world with power of AI software engineering and AI robotics,” and its vision is “Digital-Shift Service Company.” It was listed in June 2024 (TSE Growth Market). Its customers are mainly major companies in finance, telecom, manufacturing, and trading, and it has a strength in supporting in-house development from the upstream phase.
FY2025/3 results were net sales of 10.55 billion yen, operating profit of 2.07 billion yen, and an operating margin of 19.6%. The Company has 813 employees (including 34 temporary employees), with an engineer-centric organization. On October 1, 2025, it plans to absorb and merge its three principal subsidiaries (Mamezou Co., Ltd., KOWAMEX Inc., and NT Solutions Co., Ltd.) and shift from a holding company to an operating company.
The Company aims for a knowledge-intensive model that enters from the ultra-upstream with a “client-side perspective.” It accompanies customers with architecture design and support for in-house development. It aligns with the industry trend from dependence on external development in the large-SI style to an in-house orientation, and its end-to-end upstream × implementation approach makes it easier to raise unit prices and improve retention. In addition, becoming a single-company structure enables integrated operation of brand, hiring, and sales. It is positioned as building the foundation to accelerate its Tier 0.5 strategy (taking the lead in client-side decision-making and design).
After the organizational restructuring, unified KPIs, such as orders, utilization rate, unit price, and quality of disclosure, will become key axes for investor evaluation. If cross-functional collaboration between support for in-house development and AI robotics advances, a higher upstream ratio and improved operating efficiency can be expected, leaving ample room to lift margins in the medium term.
2. Business characteristics and content
Client-side × upstream end-to-end “knowledge-intensive.” Raise unit prices and retention across the four services
The Company operates in a single segment related to Information Services, providing Cloud Consulting (including ERP implementation and training), AI Consulting (data utilization and generative AI implementation), AI Robotics Engineering (MBSE and process improvement), and Mobility Automation (software/hardware development support for automotive and aerospace, among others). Its hallmark is participation from the ultra-upstream with a “client-side perspective,” handling architecture design and support for in-house development from end to end. In contrast to the external-development orientation of large SIs, it rides the tailwind of rising in-house and architecture orientations. It is a model that increases its value-add upstream. Revenue is primarily linked to consulting/development person-months; however, in robotics, the Company aims to build recurring revenue through revenue sharing with partners during the mass-production phase and through licensing and cloud offerings. In the AI robotics area, it has been adopted in a national project. It is advancing R&D aimed at productization and recurring monetization, with a target of reducing motion-change time by more than 80% through next-generation teaching using natural language. In addition, based on the “Mamezou Way” (direct transactions, ultra-upstream, codification of knowledge, etc.), it explicitly outlines its operating philosophy of balancing the acquisition of upstream projects with human resource development.
Engagement from the upstream enhances the definition and design quality of requirements, and tends to curb rework and idle time. As a result, it is a structure that leads to higher hourly unit prices and retention, and, through a cycle involving training services, to maintaining supply capacity. Moreover, across the four categories, it links cloud platforms, AI implementation ⇔ , and on-site automation, facilitating conversion into higher-unit-price composite projects. Productization in robotics has the potential to reduce dependence on person-months and bring greater stability in gross margin and scalability.
The KPIs investors should emphasize are the upstream ratio and average unit price, as well as the utilization rate and turnover rate. Additionally, they should focus on the trend in the stock-revenue ratio (license/cloud, etc.) in the robotics area, as well as the progress in cross-selling to major customers. If outcomes in the national project are visualized and a commercial roadmap is presented, improvement in the mix from person-month to stock revenue will become a driver of evaluation. In addition, if unified project management is maintained after integration and the codification of knowledge based on the “Mamezou Way” continues, a positive cycle in unit price, retention, and talent acquisition is likely to be sustained.
3. Major shareholders and investment trends
Stable control by the controlling shareholder and constraints on free float; the institutional-investor ratio is in a gradual increase phase
The largest shareholder is Mamezo K2TOP Holdings Co., Ltd., with a 67.99% stake. Next is Inaba Denki Sangyo at 2.99%, followed by Japan Custody Bank (trust account) at 2.19% and The Master Trust Bank of Japan (trust account) at 1.95%, among other name-in-trust holdings. While characterized by a stable shareholder structure in which a parent company holds a majority, the tradable shares are relatively limited. As a result, in the short term, supply, demand tends to be easily swayed by flow impacts, and price elasticity tends to be amplified, points to note.
Meanwhile, the formation of an institutional investor base has been gradually progressing since the listing. Public data confirms the presence of names such as Rheos Capital Works (0.90%), Neuberger Berman (0.75%), JOHCM (0.11%, with an increase of 18,000 shares over the past six months), and SBI Okasan AM (0.10%) among domestic and overseas active managers, indicating signs of diversification. However, at present, the controlling shareholder accounts for just under 70%, and constraints on the free-float ratio remain. Consequently, the rate of rise in strong results/positive catalysts, as well as the volatility in adverse conditions, both tend to be relatively large.
The shareholder-return stance centers on dividends; for FY2026/3, the Company has introduced an interim dividend (30 yen) and indicated an annual dividend of 61 yen. The dividend payout ratio is approximately 67.7% against the reference Company’s Forecast EPS of 90.17 yen. Unless there is a revision during the year, the distribution level is set relatively high while continuing growth investments. While the high return policy underpins the stock on the supply–demand side, how the parent company’s equity policy affects the free-float ratio and trading volume remains a medium-term theme to monitor.
Moreover, the absorption-type merger of the three subsidiaries on October 1, 2025, may contribute to brand unification and improved investor recognition. Over the medium to long term, by raising visibility into KPIs and governance, there will be room for expansion of institutional ownership. The quality of disclosure on segments, KPIs, and capital policy after integration will influence the depth of the shareholder base.
4. Medium-term management plan
Diluting “person-month dependence” through integration × commercialization of AI robotics. Targeting sales CAGR +10–12% and operating profit CAGR +15–17%
The medium- to long-term group strategy is to achieve sales CAGR +10–12% and consolidated operating profit CAGR +15–17% for FY2025/3–FY2027/3; to strengthen unified KPI management and deal-winning power through a shift from holding company to operating company in October 2025 (absorption-type merger of three companies); and to reduce dependence on person-months through productization of AI robotics and recurring monetization. In AI robotics, R&D on next-generation teaching using natural language has been adopted in a national project, with a target of “more than 80% reduction” in motion-change time, and with a view toward license/cloud provision and market rollout of skill modules. The design is to capture revenue share with partner manufacturers in the mass-production phase and lift the “quality” of earnings.
Execution rests on people and the organization. For FY2026/3, against a hiring plan of 88 engineers, 49 had been hired as of the end of June (55.7% progress). The turnover rate was in the 5% range in the previous fiscal year, and supply capacity is being strengthened through the twin wheels of hiring and retention. As an integration effect, the Company aims to advance brand unification and optimize project and talent assignments, and to reaccelerate its strength in “ultra-upstream × support for in-house development” across the four services.
On the numerical outlook, recent disclosures also indicate a conservative start. For FY2026/3, the Company indicates, on a hypothetical continued-consolidation basis, net sales of 11.607 billion yen, operating profit of 2.142 billion yen, and EPS of 90.17 yen, starting with guidance that prioritizes certainty while taking into account adoption in the national project and the limited nature of tariff impacts. The annual 61 yen dividend, including the new interim dividend, signals the coexistence of growth investment and shareholder returns.
We see three keys to achieving the plan: visualization of commercialization milestones (PoC → mass production → licensing) in AI robotics; improving trends in KPIs such as upstream ratio, unit price, and utilization rate after integration; and deepening cross-sell to major customers. The Company’s view is that tariff risk has a limited business impact, and the environmental headwinds appear to be controllable. If these premises are met, there is ample room to realize the CAGR targets, benefiting from the tailwind of high ROIC and progress in recurring monetization.
5. Regarding international business
Maintaining a domestic core while widening room for cross-border expansion through “productization” of AI robotics
The current business base is centered in Japan, with a single segment of information services in disclosures and no regional breakdown of sales. Group company locations are currently limited to Tokyo (Mamezou; NT Solutions) and Nagoya (KOWAMEX), with no confirmed overseas bases. Accordingly, at present, the revenue drivers are mainly upstream consulting and development for domestic customers.
By contrast, the cross-border option lies in products rather than person-months. In AI robotics, the Company is conducting R&D on a next-generation teaching tool that can instruct robots in natural language (Japanese, etc.), and it has been adopted in a national project (NEDO “Post-5G Information and Communication System Infrastructure Enhancement Research and Development Project / Software Development Platform Construction in the Robotics Field”). The target is a reduction of more than 80% in motion-change time. Looking ahead, it has in view the provision of licenses and cloud services, as well as the rollout of a marketplace for skill modules, and it envisions revenue sharing with manufacturing partners in the mass-production phase. Compared with labor-intensive contract work, this design is better suited to ensuring scalability in cross-border expansion.
In its first-quarter briefing, the Company reported that the impact of tariffs on the business is limited and is expected to ease going forward. The retreat of headwind perceptions for cross-border supply chains is a tailwind that increases the likelihood of executing product exports and license expansion. In October 2025, the Company also plans to absorb and merge the three principal subsidiaries, aiming to raise agility in sales, hiring, and partner collaboration through brand unification and unified KPI management. In negotiations with overseas partners and in building sales structures, the credibility of a single brand tends to work in favor of the brand.
Overall, the Company’s international business can be described as being in the preparation stage. While current projects are centered in Japan, as productization/SaaS-ization in AI robotics becomes more concrete, cross-border expansion, starting from software (multilingualization, remote implementation, and disclosure of subscription indicators), will become more realistic. As investors, we would like to monitor three points: the commercial roadmap for deliverables from the national project; the mass-production and sales structure in tandem with partner manufacturers; and, in post-integration disclosures, the ratio of recurring revenue (license/cloud).
6. Long-term results
“Upstream × knowledge-intensive” driven by established increases in sales and higher profitability, propelling ROE in the 50% range.e
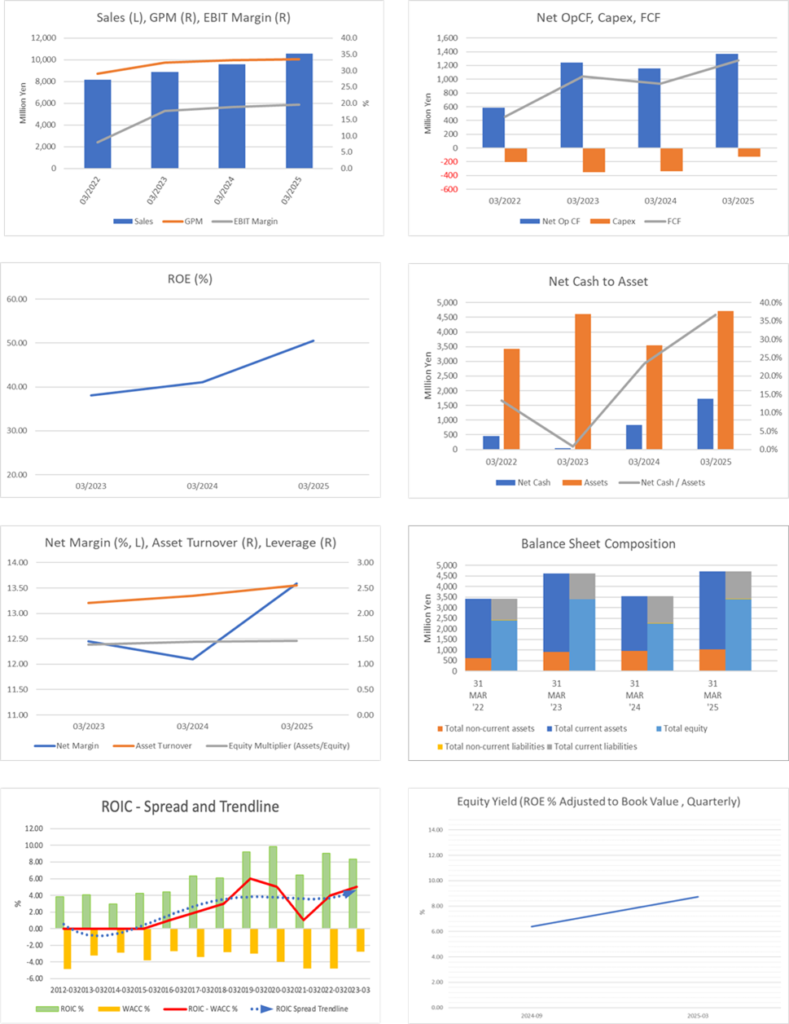
The Company’s trend over the past several fiscal years is evident. Consolidated net sales have consistently grown from 8.174 billion yen (FY2022/3) → 8.859 billion yen (FY2023/3) → 9.586 billion yen (FY2024/3) → 10.552 billion yen (FY2025/3), establishing a rising sales trend. Ordinary profit has also steadily expanded from 674 million yen (FY2022/3) to 2,052 million yen (FY2025/3). The return on equity (ROE) has remained at a high level—47.2%, 38.1%, 41.0%, and 50.6%—and has shown renewed growth in the most recent fiscal year. The number of employees increased from 764 to 813, and the expansion of supply capacity has contributed to the step-up in sales. These can be confirmed from the transitions in consolidated management indicators presented in the Company’s annual securities report.
Regarding profitability, the FY2025/3 operating profit was 2.07 billion yen, with an operating margin of 19.6%. The effect of shifting to a “knowledge-intensive” model, centered on high-value-added projects, is visible in the figures. With net sales of 10.55 billion yen, growth in operating profit (+15.1%) outpaced growth in net sales (+10.1%), suggesting mix improvement and productivity gains.
The latest quarter also continues the trend of higher sales and profits. In FY2026/3 Q1, net sales were 2,888 million yen (YoY +6.3%) and operating profit was 538 million yen (+0.8%), with progress against full-year plans steady at 24.9% for net sales and 25.1% for operating profit. As stated on page 1, on an adjusted basis, excluding special factors, this corresponds to a real 13.7% increase in profit, according to the Company.
In the Company’s long-term results, “higher sales × higher profitability × high ROE” are proceeding in parallel. The selection of projects with a high upstream ratio and continued investment in human resources have supported improvements in financial indicators. Going forward, the focal point will be whether unified KPI management, achieved through the shift to an operating company and productization in the AI robotics area, contributes to sustained growth in sales, rising profit margins, and ultimately, the stable maintenance of high levels of ROE and ROIC.
7. Results in the most recent earnings
Absorbing one-off expenses and strategic investments, a steady start with double-digit profit growth on a factual basis.
In FY2026/3 Q1, net sales were 2,888 million yen (YoY +6.3%), operating profit was 538 million yen (+0.8%), ordinary profit was 540 million yen (+5.6%), and quarterly net income was 364 million yen (+8.8%). Gross profit was 990 million yen (+6.8%). The operating margin remained high at approximately 18.6%. The equity-to-asset ratio was 63.1% (72.3% at the previous fiscal year-end), indicating sound finances. The Company characterized the quarter as a “new record high,” and progress against full-year plans was on track, with net sales at 24.9% and operating profit at 25.1%.
While the headline figure for profitability was close to flat, the substance is positive. On an adjusted basis excluding (i) one-off impacts such as advertising and promotion expenses related to the October 1 group integration and differences in the number of workable days (minus 42 million yen), and (ii) strategic investment in the AI robotics area (minus 26 million yen), operating profit would be 606 million yen, equivalent to +13.7% YoY. By service, other areas—mainly Cloud Consulting and Mobility Automation—led profits, as they absorbed the expansion of AI robotics investment, underpinned overall growth.
On guidance, against the initially “conservative” full-year outlook, the Company expressed “strong expectations” for upside, based on acceleration of strategic investment in AI robotics with adoption in a national project and its view that the business impact of tariffs is limited and that further easing is expected. In the national project, the Company targets a reduction of more than 80% in motion-change time centered on next-generation teaching based on natural language, with future licensing and cloud provision also in view.
Regarding shareholder returns, the Company decided to introduce a 30 yen interim dividend and maintain an annual dividend of 61 yen. Clarifying the dividend policy will serve as a support factor for the downside. It plans to absorb and merge its three principal subsidiaries on October 1, 2025, and transition to an operating company; for the fiscal year, it presents, as a reference value assuming continued consolidation, a full-year outlook of net sales of 11,607 million yen, operating profit of 2,142 million yen, and EPS of 90.17 yen.
In Q1, while absorbing one-off expenses and up-front investments, the Company secured a trend of double-digit profit growth on a factual basis. For the full year, three points are essential: visualization of concrete outcomes from the national project and a commercialization roadmap; accumulation of high-value-added areas that more than offset investment burdens; and improved disclosure of KPIs (unit price, utilization, upstream ratio) accompanying the shift to an operating company. If these are confirmed, the upside potential and sustainability of the valuation will increase.
8. Full-year earnings outlook
An “upside option” in conservative guidance; room implied by adoption in the national project, and 25% progress
For FY2026/3, because the Company will absorb and merge three subsidiaries on October 1 and transition to an operating company, it is not issuing an official “consolidated forecast,” but instead presents, as a reference value assuming continued consolidation, net sales of 11,607 million yen, operating profit of 2,142 million yen, ordinary profit of 2,140 million yen, profit attributable to owners of parent of 1,447 million yen, and EPS of 90.17 yen (with no in-period forecast revisions).
Q1 results were net sales of 2,888 million yen (+6.3%) and operating profit of 538 million yen (+0.8%). Progress rates against full-year plans were 24.9% for net sales and 25.1% for operating profit, which can be evaluated as a more-than-adequate start. The Company, noting that strategic investment in AI robotics is accelerating with the adoption of a national project and that tariff impacts on the business are limited, with easing expected, has expressed strong expectations for upside relative to its initially conservative view.
Dividends: a new interim dividend of 30 yen and a year-end dividend of 31 yen for an annual dividend of 61 yen. Based on the above reference EPS (90.17 yen), the dividend payout ratio is approximately 67.7%, indicating a high certainty of shareholder returns for the entire year.
The assumed scenario is that existing high-value-added areas, such as Mobility Automation, drive earnings, upfront investment in the AI robotics area is absorbed, and through brand unification and optimization of talent assignment accompanying integration, operating efficiency and the upstream ratio see gradual improvement. In Q1, there were one-off factors such as advertising and differences in workable days (minus 42 million yen) and AI robotics investment (minus 26 million yen), suggesting a high adjusted real growth rate (+13.7% YoY equivalent).
There are three focal points for the whole year. First, visualization of outcomes in the national project and a monetization roadmap (including licensing and cloud direction, etc.). Second, confirmation of easing in tariff risk and continued customer investment. Third, improved quality of KPI disclosure after integration (unit price, utilization rate, upstream ratio, and order backlog). If these advances are realized, upside potential relative to the conservatively set reference range will increase. Conversely, if upfront costs for hiring reinforcements, advertising, promotion, or R&D weigh heavily during the year, the slope of profit accretion could flatten somewhat. In any case, the message at the 25% progress point and the dividend policy can be summarized as content that suggests an upward rather than downward bias.
9. Growth strategy and risks
A design to combine implementation capability and capital efficiency for qualitative growth through “upstream × productization × integration”
The Company’s growth drivers consist of three layers. First, based on cross-functional provision of consulting and engineering with a high upstream ratio, it will continue to deepen major companies’ digital projects. It will refine a model that bundles the four categories—cloud, AI, robotics, and mobility—and accompany in-house development from a client-side perspective (customers are mainly major companies in finance, telecom, manufacturing, and trading). This aims to raise unit prices, retention, and project gross margins.
Second, “productization” in the AI robotics area. R&D on next-generation teaching that can instruct robots in natural language has been adopted in a national project. With a target of shortening motion-change time by more than 80%, the Company has in view license provision/cloud offerings, and even the development of a marketplace for skill modules. In the mass-production stage, it envisions revenue sharing with partner manufacturers, reducing dependence on person-months.
Third, through the shift to an operating company in October 2025, it will unify brand, talent, and KPIs, and raise agility from deal acquisition through implementation. Integration will enhance flexibility in project assignment and end-to-end coverage from upstream through implementation, and improvement in the “quality” of earnings (utilization, unit price, and visibility into order backlog) can be expected.
The main risks are the following six points.
① Execution risk in productization: potential time required to establish R&D milestones, quality assurance/safety certification, and a mass-production partner structure.
② Talent acquisition and retention risk: upward pressure on compensation for highly skilled talent; delays in optimization of utilization could compress gross margin.
③ Variations in customer investment cycles: slowdowns in the economy, fluctuations in exchange rates, or shifts in the semiconductor and automotive cycles can impact the pace at which projects materialize.
④ Competitive environment: bidding competition with major SIs and foreign consulting firms; the spread of generative AI could pressure unit prices in some areas.
⑤ Integration risk: temporary inefficiencies could arise during the integration of organizations, systems, and KPIs.
⑥ Trade and policy: tariffs/regulatory trends. At present, the Company assesses the business impact as “limited,” with easing expected, but uncertainty remains regarding policy timing.
As mitigation measures, the Company should disclose stepwise commercialization roadmaps (PoC → mass production → license/SaaS) and quality/safety standards for deliverables from the national project; provide fixed-point disclosure after integration of the upstream ratio, average unit price, utilization, and order backlog; diversify customers and industries and standardize price-revision clauses (inflation, FX, tariffs); continue strengthening hiring and training on the human-resource front; and finally introduce third-party reviews for security and legal compliance. If the three-layer growth measures proceed as planned, an improvement in the mix between person-month revenue and product revenue, along with sustained high levels of ROIC from integration effects, can be expected.
10. Stock price trends and equity valuation
A balance between leading valuation and returns; a phase where the “sustainability” of the high-efficiency model is tested
The Company’s current valuation is stably high at a forecast PER of approximately 21x based on EPS of 90.17 yen. Using shareholders’ equity of 2,810 million yen and 16.05 million shares outstanding as of FY2025/3, BPS is estimated at approximately 175 yen. Assuming the current level, PBR can be calculated as roughly 11x. The annual dividend is 61 yen (with a new interim dividend of 30 yen), and the dividend payout ratio, based on the reference EPS, is approximately 68%. The high-efficiency earnings model and strong shareholder return stance underpin the valuation. The Company, following the merger scheme, presents reference full-year figures assuming continued consolidation (net sales: 11.61 billion yen, operating profit: 2.142 billion yen, EPS: 90.17 yen) and explains that this fiscal year’s targets are conservative due to AI robotics investment and tariff factors.
Attention is also needed to the stock’s supply–demand characteristics. Because the largest shareholder (Mamezo K2TOP Holdings) holds about 68% and stable shareholders occupy the upper ranks, the free float is relatively thin. As a result, around earnings/disclosure events, as well as changes in index-related supply and demand, volatility tends to be amplified. The absorption-type merger of three subsidiaries is scheduled for October 1. While brand unification and KPI integration are positives over the medium to long term, temporary changes in the appearance of disclosures and accounting during the transition period could become short-term stock price drivers.
Four significant risks are considered over the coming year.
① Risk to maintaining leading valuation: the Company presents only a reference range assuming continued consolidation this fiscal year. At the same time, upside expectations can run ahead; if project visualization or KPI disclosure is delayed, a gap adjustment could occur. Q1 progress, 24.9% for net sales and 25.1% for operating profit, is steady, but continued confirmation is needed.
② Execution risk in productization: The next-generation teaching adopted in the national project is a focus area, citing a more than 80% reduction in motion-change time. However, commercialization requires quality assurance/safety certification, collaboration with mass-production partners, and the organization of a sales structure. Delays in milestones or difficulties in standardizing specifications could lead to longer-than-expected investment recovery.
③ Operational risk in the integration transition: due to the absorption-type merger of three subsidiaries on October 1 and the shift to an operating company, in the first year, temporary inefficiencies and “variations in appearance” (timing of expense recognition, continuity of disclosures, etc.) may arise during the process of organizing systems, accounting, and KPI definitions. Fixed-point disclosure of KPIs after integration will be key to shaping investor expectations.
④ Supply–demand and external-environment risk: because the controlling shareholder holds about 68%, the free float is thin, and volatility tends to be amplified around events such as earnings, dividend record dates, and the effective date of integration. As for tariffs, the Company states “impacts are limited, with easing expected,” but uncertainty remains regarding the timing of policy changes.
As easing factors, the annual 61 yen policy, including the new interim dividend (30 yen), can provide downside support. In the short term, the stepwise disclosure of outcomes from the national project, continuity of KPIs after integration, and accumulation of order backlogs, unit prices, and utilization will be the three key conditions for maintaining valuation.
11. Equity investment conclusion from the review of results and stock price
Based on high ROIC, if earnings surprise on the upside, there is significant room for a re-rating
In the most recent results, the Company achieved higher sales and profits, with net sales of 2,888 million yen (+6.3%) and an operating profit of 538 million yen (+0.8%). Progress against full-year plans was at roughly 25%, an above-standard level. On an adjusted factual basis, excluding one-off items such as advertising and differences in workable days (minus 42 million yen) and AI robotics investment (minus 26 million yen), the equivalent is +13.7% profit growth, indicating a solid start in qualitative terms. Adoption in the national project is expected to accelerate commercialization in AI robotics, and the message that tariff impacts on the business are “limited, with easing expected going forward” is also positive. The dividend policy of 61 yen per annum (with a new interim dividend of 30 yen) is a factor supporting the current valuation.
At the same time, the stock price carries elements of leading valuation. As noted above, assuming a forecast PER just over 20x and double-digit PBR with a forecast ROE of around 40% and EPS of 90.17 yen, it is reasonable to interpret that the market is factoring in EPS growth of around +14% per annum; compared with the Company’s medium-term range (sales CAGR +10–12%, operating profit CAGR +15–17%), this is a level that calls for confirmation of growth acceleration. Accordingly, the core strategy for this stock is to maintain a “neutral to positive” stance until upside is demonstrated, with a basic posture of adding nimbly on dips.
Three conditions are necessary for sustaining/re-accelerating valuation: visualization of milestones in AI robotics (PoC → mass production → licensing/cloud, with verification of the effect—more than 80% reduction in motion-change time); explanation of structural improvement in profit margin through unified KPI disclosure after integration (upstream ratio, average unit price, utilization rate, order backlog, etc.); and continuity of returns (maintenance of the annual 61 yen and presentation of capacity). If these are met, not only can maintenance of the leading valuation be achieved, but even re-expansion of multiples through expectations of recurring monetization can come into view. Conversely, if visualization is delayed, short-term momentum is prone to slacken.
On the supply–demand curve, the free float is thin, and price elasticity around events is high. Because the largest shareholder holds approximately 68%, volatility can be amplified. Around key dates such as earnings, dividend record dates, and the effective date of integration, positions should be managed while confirming trading volume. Over the medium term, unified brand operation and consistent KPI disclosure through the shift to an operating company will lead to expansion of institutional ownership and a thicker supply–demand base.
In sum, with a structure of ROIC > WACC and upside options originating from the national project, the basic stance is “neutral to positive.” As long as visualization and consistent disclosure accompany progress, participation focused on buying on dips is rational.
12. Transition of return on equity (ROE) and current evaluation
ROE in the 50% range is the result of “high turnover × light leverage”; also, examining the relationship between dividends and BPS
ROE has remained high over the past four fiscal years, at 47.2,→ 38.1,→ 41.0,%and→ 50.6%, returning to the 50% range in FY2025/3. Net sales were 10.55 billion yen, and profit attributable to owners of the parent was 1.434 billion yen, confirming the coexistence of profit growth and capital efficiency.
The structural background supporting the Company’s ROE level lies in the balance seen in “DuPont analysis”: high profitability (operating margin 19.6% in FY2025/3; net profit margin about 13.6%), high asset turnover (sales/total assets, roughly 2.2x), and leverage that is not overly relied upon (total assets/equity, roughly 1.38x). According to approximate calculations confirmed by the annual securities report, it can be seen that a ROE of around 50% is achieved through “high turnover × light leverage.”
As a check on the current level, BPS at the end of FY2025/3 was 212.39 yen. Meanwhile, at the end of FY2026/3 Q1, shareholders’ equity was 2,810 million yen, and shares outstanding were 16,050,000 shares, and BPS had decreased to approximately 175 yen. This can be explained by a decrease in equity due to the payment of the year-end dividend of 60 yen for the previous year (a total of approximately 960 million yen), partially offset by the quarterly net income of 364 million yen in the same quarter. The figures are based on the quarterly report and the disclosure on dividend revisions.
For a forward evaluation, using the Company’s reference EPS of 90.17 yen for a simple estimate, the ROE would be about 42% based on the FY2025/3 year-end BPS (212.39 yen), and about 52% based on the Q1 BPS (approximately 175 yen), creating a range (both approximate). Given the definition of ROE as using average equity, it is reasonable to view the actual level as converging between these, and the evaluation of “maintaining ROE in the 40% range” is realistic. The premise that EPS and BPS are consistent with the values stated in the quarterly report and annual securities report is supported.
Investment implications suggest that three key factors determine the sustainability of ROE: sustaining profitability (improving the upstream ratio, unit price, and utilization), maintaining asset turnover (the speed of project completion and the quality of the order backlog), and balancing dividends with equity. In particular, for FY2026/3, a policy of an annual 61 yen dividend (with a new interim dividend of 30 yen) has been indicated, and attention should be paid to consistency with trends in BPS.
13. Analysis of economic value creation based on ROIC and WACC
A thick EVA spread with ROIC in the 47% range × light leverage; verify sustainability with “person-month + product”
The current return on invested capital (ROIC) is 47.2%. In this report, if we set the cost of capital (WACC) at 7%, the spread reaches approximately 40 percentage points, and EVA (equal to (ROIC − WACC) × invested capital) is significantly positive. The sources of the spread are threefold: high profitability, high asset turnover, and leverage that is not overly relied upon. First, profitability is underpinned by an operating margin of 19.6% in FY2025/3 (net sales 10.55 billion yen; operating profit 2.07 billion yen). Next, asset efficiency: total assets were 4.71 billion yen (4,712 million yen), and from a simple ratio with sales, the approximate total-asset turnover can be interpreted as approximately 2.2 times (10.55/4.71 ≒ 2.24). As for the financial structure, the equity-to-asset ratio moved from 72.3% (FY2025/3) to 63.1% (FY2026/3 Q1); with light leverage and a small contribution from the cost of debt, WACC tends to remain relatively low.
From the perspective of EVA sustainability, even if the expansion of B/S (integration, accelerated hiring, R&D) increases invested capital, maintaining a project mix with a high upstream ratio and productizing AI robotics can drive NOPAT growth, making it entirely possible to sustain the spread. In particular, products have low marginal costs and can be designed to add earnings while keeping capital intensity in check, which underpins EVA. These figures are also consistent with the Company’s disclosed business policy, operating margin, and sales scale.
At the same time, we check sensitivities. Even if ROIC falls to 35%, with WACC assumed at 7% the spread still secures +28 percentage points. Even if the WACC rises to 8%, with a ROIC of 47.2%, the spread remains +39.2 percentage points, remaining substantial. Conversely, in a scenario where ROIC temporarily declines due to inefficiencies in the first year of integration and WACC rises simultaneously due to increases in interest rates/risk premiums, EVA could decrease. Therefore, visualizing the quality of invested capital (working capital turnover and recovery on fixed asset investment) and the ramp-up of product revenue in quarterly KPIs will be key practical points for defending the spread.
With a combination of high profitability, high turnover, and light leverage, the Company is currently designed to generate substantial EVA on an ongoing basis. Going forward, the speed of commercializing products, managing working capital and CapEx after integration, and the fixed-point disclosure of KPIs will determine the sustainability of the spread—i.e., the capacity to create shareholder value.
14. Corporate value creation from the perspective of free cash flow and capital allocation
Generate FCF through high operating CF × light investment; aim to balance dividends and growth investment.
The Company’s value creation is supported by the stability of operating cash flow (OCF) arising from a high-profitability model with a high upstream ratio. On a consolidated basis, since FY2021/3 OCF has increased consistently, expanding to 1,371.725 million yen in FY2025/3. In contrast, the absolute amount of investing cash flow shrank sharply YoY (from 1,922.398 million yen in FY2024/3 to minus 180.241 million yen in FY2025/3), suggesting an increased capacity to generate cash. As a result, cash and cash equivalents at period-end increased to 1,832.835 million yen.
As for shareholder returns since the beginning of the fiscal year, after paying a year-end dividend of 60 yen for FY2025/3, the policy for FY2026/3 has shifted to introducing a new interim dividend of 30 yen and maintaining an annual 61 yen. The Company clearly states its policy of “continuing stable dividends while securing internal reserves,” aiming to balance growth investment, net, and dividends while generating OCF.
From the perspective of financial safety, the equity-to-asset ratio in FY2026/3 Q1 was 63.1%, maintaining light leverage. Shares outstanding are 16,050,000 shares, confirming the stability of capital policy. While advancing hiring and R&D that accompany the expansion of the business, guidance that reconciles a full-year reference EPS of 90.17 yen with the dividend plan serves as evidence of consistency in capital allocation.
There are three medium-term capital-allocation themes. First, prioritize allocation to investment in people (hiring and training) and the productization of AI robotics (licensing and cloud) to reduce dependence on person-months and improve the quality of FCF. Second, after the planned Mamezou integration on October 1, optimize working-capital turnover and project allocation through unified KPI management, and curb the “amplitude” of FCF. The integration is an absorption-type merger that shifts from a holding company to an operating company, aiming to create synergies and allow agile allocation.
As risks, delays in productization milestones and temporary inefficiencies during the integration transition could distort the timing of FCF, while the clarified return policy and high OCF provide support. Overall, the Company aims for a capital allocation that balances growth investment and dividends on a foundation of high operating CF × light investment, and its capacity to return FCF can be evaluated as a structure that is likely to be sustained over the medium term.
15. Future possibilities for shareholder-return measures and an evaluation of past results
Clarifying policy with “stable dividends” as the axis, high OCF provides support and expands future options
Shareholder returns are currently centered on dividends. For FY2026/3, the policy has been revised, introducing a new interim dividend (30 yen) and indicating a total annual dividend of 61 yen with a year-end dividend of 31 yen. The Company clearly states “continuing stable dividends while securing internal reserves,” and the shift from a single year-end dividend to semiannual dividends can be regarded as a clarification of cash-flow visibility and shareholder commitment.
Meanwhile, the reference full-year EPS is 90.17 yen. The dividend payout ratio, based on this premise, is approximately 67.7%, indicating a stance focused on dividends. Shares outstanding are 16,050,000 shares, and treasury stock is 0; at present, no share buybacks or balances have been confirmed. (Note: the payout ratio is a rough calculation of 61 yen ÷ EPS of 90.17 yen.)
What underpins the sustainability of dividends is cash flow. In the consolidated key indicators, OCF expanded to 1,371.725 million yen (as of FY2025/3), while investing CF shrank substantially to minus 180.241 million yen YoY, and cash and cash equivalents at period-end accumulated to 1,832.835 million yen. The combination of high profitability and light investment boosts FCF generation capacity and supports the stability of dividend resources.
As for future possibilities, if the unification of KPIs and optimization of project and talent allocation accompanying the shift to an operating company planned for October 1 contribute to smoothing earnings, the sustainability of the dividend policy will increase further. The more productization in the AI robotics area progresses and stock revenue takes off, the greater the future discretion for additional returns becomes, backed by low marginal costs.
That said, note that the free float is relatively thin. As the largest shareholder holds approximately 68%, when considering the choice of return measures, liquidity and the impact on supply and demand need to be assessed carefully. Currently, the Company clearly states that dividends are central, and the results, from a year-end dividend of 60 yen in the previous fiscal year to an annual dividend of 61 yen this fiscal year, are consistent.
16. Corporate value evaluation (DCF, PER/PBR analysis)
The “present value of high efficiency” is broadly consistent; keys to re-rating are demonstration of FCF and progress in recurring monetization.
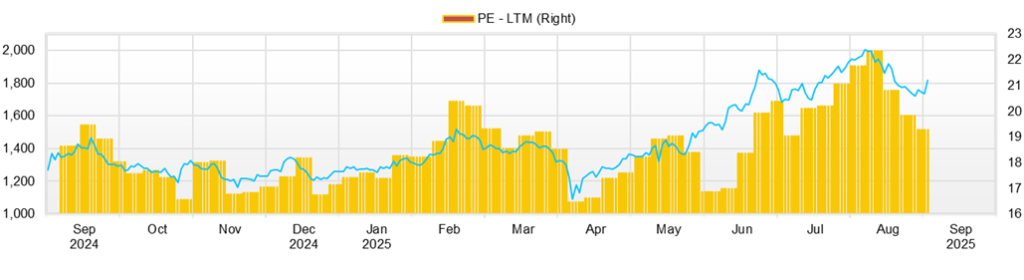
As of August 14, 2025, the share price was 1,912 yen. Using the Company’s reference EPS of 90.17 yen yields a forecast PER of approximately 21.2x, and assuming an annual dividend of 61 yen, a dividend yield of roughly 3.19% results. With 16.05 million shares outstanding, the market capitalization is about 30.69 billion yen (about 30.7 billion yen). PBR is roughly 9.0x on the FY2025/3-year-end BPS of 212.39 yen, and if we assume a decrease in BPS at Q1 following the dividend payment, it can be refined in a range of around 11x.
In relative valuation, high efficiency, characterized by an ROE of 50.6% and an operating margin of 19.6%, supports a PER in the low 20s. As long as landing within the medium-term plan range (sales CAGR +10–12% / operating profit CAGR +15–17%) is in view, the current multiple is within a reasonable zone. On the other hand, in a structure where BPS tends to be reduced by dividends, demonstration of EPS/FCF becomes the main battleground for maintaining valuation.
We check consistency with a simple reverse DCF. With a WACC of 7%, terminal growth of 1.5%, and EV of about 29.6 billion yen after deducting net cash (Q1 disclosure), the implied next-year FCF that satisfies present value is about 1.6 billion yen (EV × (WACC-g)). Considering operating CF of 1.372 billion yen in FY2025/3 and reference operating profit of 2.142 billion yen in FY2026/3 (about 1.5 billion yen converted to after-tax NOPAT), an FCF margin of around 13–14% is required, “achievable, but awaiting demonstration” is an appropriate positioning.
Using the same EV, the multiples are approximately 13.8x (FY2026/3 reference EBIT) to 14.3x (FY2025/3 actual) for EV/EBIT, and roughly 2.5x for EV/Sales. Given the widespread use of ROIC > WACC (as discussed in the previous section), these are within an acceptable range. Triggers for re-rating are threefold: concrete progress in licensing and cloud for AI robotics, consistent KPI disclosure following integration, and continuity of the dividend policy. As visualization progresses, the assumptions in the reverse DCF can be relaxed, opening up the upside. If it is delayed, pressure to normalize PER tends to take the lead.
17. Comparative multiple analysis with peers
A “high-ROE × light-asset” premium within an acceptable range; relative valuation across three types—SI/cloud SI / independent SI
Peers for comparison are COMTURE (3844), Serverworks (4434), and R&D COMPUTER (3924). All three are centered on SI, but business characteristics differ. COMTURE is strong in large projects from core systems to DX and is a “stable-earnings type” with high maturity and reproducibility. Its usual range is mid PER × mid PBR, and continuity of the dividend policy forms the base of valuation. By contrast, Serverworks is an “AWS-centric cloud SI.” While it has a thick recurring layer, SG&A burdens and the cost of acquiring talent tend to be substantial, so PER tends to be at the upper end of the range, and PBR tends to converge to low to mid levels. R&D COMPUTER has a strong “stable-operations type” color with a high ratio of maintenance/operations, with low to mid PER × mid PBR, and dividend yield tends to be the axis of valuation.
MAMEZO DIGITAL HOLDINGS features a structure in which PBR sticks to a high level, backed by high ROE (50.6%), a high operating margin (19.6%), and a knowledge-intensive, light-asset model. PER is in the range of just over 20x, and as long as productization (licensing/cloud in AI robotics) and consistent KPI disclosure after integration progress, the combination of “mid PER × high PBR” remains consistent. Conversely, in a phase where changes in the project mix or up-front costs for hiring/training normalize ROE into the 20% range, it is reasonable to assume normalization of PBR (convergence toward peer bands). Note also that the dividend is 61 yen per year, with a mid-level yield, which contributes to the stability of the supply–demand balance on the downside. Taken together, the current level of this stock is within the range of the premium for high efficiency. Going forward, commercialization milestones in AI robotics, continuous disclosure of upstream ratios, unit prices, utilization rates, and order backlogs, as well as actual results on the stock ratio of products, will be key factors in maintaining/expanding the premium.
| Companies (Code) | Business type | Expected P/E ratio (times) |
PBR (times) |
ROE (%) |
Dividend yield (%) |
Market capitalization (billion yen) |
| MAMEZO DIGITAL HD(202A) | Knowledge-intensive SI × AI robotics | 21.2 | 10.92 | 50.6 | 3.19 | 306 |
| COMTURE(3844) | Cloud-focused independent systems integrator | 16.36 | 2.89 | 17.92 | 2.82 | 545 |
| Serverworks(4434) | AWS-centric cloud system integration | 20.81 | 1.51 | 6.1 | 0.00 | 176 |
| R&D COMPUTER(3924) | Independent system integrator (Development and maintenance management) | 13.03 | 2.81 | 17.5 | 4.13 | 162 |
Key stock price data
Key financial data
| Unit: million yen | 2022 | 2023 | 2024 | 2025 CE |
| Sales | 8,175 | 9,586 | 10,552 | N/A |
| EBIT (operating profit) | 651 | 1,799 | 2,070 | |
| Pretax Income | 1,351 | 1,672 | 2,034 | |
| Net Profit Attributable to Owner of Parent | 1,134 | 1,160 | 1,434 | N/A |
| Cash & Short-Term Investments | 469 | 828 | 1,833 | |
| Total assets | 3,424 | 3,544 | 4,715 | |
| Total Debt | 10 | 0 | 103 | |
| Net Debt | -459 | -828 | -1,730 | |
| Total liabilities | 1,021 | 1,282 | 1,305 | |
| Total Shareholders’ Equity | 2,403 | 2,262 | 3,409 | |
| Net Operating Cash Flow | 588 | 1,155 | 1,372 | |
| Capital Expenditure | 202 | 335 | 127 | |
| Net Investing Cash Flow | -1,145 | 1,922 | -180 | |
| Net Financing Cash Flow | -27 | -2,288 | -187 | |
| Free Cash Flow | 455 | 933 | 1,271 | |
| ROA (%) | N/A | 28.42 | 34.72 | |
| ROE (%) | N/A | 41.04 | 50.57 | |
| EPS (Yen) | 70.6 | 72.3 | 89.4 | |
| BPS (Yen) | 149.7 | 140.9 | 212.4 | |
| Dividend per Share (Yen) | N/A | 4.35 | 60.00 | 61.00 |
| Shares Outstanding (Million shares) | N/A | 16.05 | 16.05 |
Source: Omega Investment from company data, rounded to the nearest whole number.
Share price
Financial data (quarterly basis)
| Unit: million yen | 2025/3 | 2026/3 | |||
| 1Q | 2Q | 3Q | 4Q | 1Q | |
| (Income Statement) | |||||
| Sales | 2,718 | 2,548 | 2,572 | 2,714 | 2,888 |
| Year-on-year | 16.4% | 6.3% | |||
| Cost of Goods Sold (COGS) | 1,790 | 1,745 | 1,735 | 1,747 | 1,898 |
| Gross Income | 928 | 803 | 837 | 968 | 990 |
| Gross Income Margin | 34.1% | 31.5% | 32.5% | 35.6% | 34.3% |
| SG&A Expense | 394 | 366 | 358 | 347 | 452 |
| EBIT (operating profit) | 534 | 438 | 478 | 621 | 538 |
| Year-on-year | 48.1% | 0.8% | |||
| Operating profit Margin | 19.6% | 17.2% | 18.6% | 22.9% | 18.6% |
| EBITDA | 554 | 458 | 498 | 642 | 557 |
| Pretax Income | 504 | 437 | 479 | 614 | 540 |
| Consolidated Net Income | 335 | 286 | 326 | 486 | 364 |
| Minority Interest | 335 | 286 | 326 | 486 | 364 |
| Net Income ATOP | 99.8% | 8.8% | |||
| Year-on-year | 12.3% | 11.2% | 12.7% | 17.9% | 12.6% |
| Net Income Margin | |||||
| (Balance Sheet) | 926 | 1,208 | 1,383 | 1,833 | 1,432 |
| Cash & Short-Term Investments | 3,827 | 3,743 | 3,915 | 4,715 | 4,457 |
| Total assets | 210 | 3 | 3 | 103 | 303 |
| Total Debt | -716 | -1,205 | -1,380 | -1,730 | -1,129 |
| Net Debt | 1,517 | 1,146 | 992 | 1,305 | 1,646 |
| Total liabilities | 2,310 | 2,597 | 2,923 | 3,409 | 2,810 |
| Total Shareholders’ Equity | |||||
| (Profitability %) | 34.72 | 35.33 | |||
| ROA | 50.57 | 57.15 | |||
| ROE | |||||
| (Per-share) Unit: JPY | 20.9 | 17.8 | 20.3 | 30.3 | 22.7 |
| EPS | 143.9 | 161.8 | 182.1 | 212.4 | 175.1 |
| BPS | 0.00 | 0.00 | 0.00 | 60.00 | 0.00 |
| Dividend per Share | 16.05 | 16.05 | 16.05 | 16.05 | 16.05 |
Source: Omega Investment
Financial data (full-year basis)
| Unit: million yen | 2022 | 2023 | 2024 |
| (Income Statement) | |||
| Sales | 8,175 | 9,586 | 10,552 |
| Year-on-year | N/A | 8.2% | 10.1% |
| Cost of Goods Sold | 5,794 | 6,406 | 7,017 |
| Gross Income | 2,381 | 3,181 | 3,535 |
| Gross Income Margin | 29.1% | 33.2% | 33.5% |
| SG&A Expense | 1,729 | 1,381 | 1,465 |
| EBIT (operating profit) | 651 | 1,799 | 2,070 |
| Year-on-year | N/A | 15.1% | 15.1% |
| Operating profit Margin | 8.0% | 18.8% | 19.6% |
| EBITDA | 698 | 1,899 | 2,152 |
| Pretax Income | 1,351 | 1,672 | 2,034 |
| Consolidated Net Income | 1,134 | 1,160 | 1,434 |
| Minority Interest | 1,134 | 1,160 | 1,434 |
| Net Income ATOP | #N/A | 5.1% | 23.6% |
| Year-on-year | 13.9% | 12.1% | 13.6% |
| Net Income Margin | |||
| (Balance Sheet) | 469 | 828 | 1,833 |
| Cash & Short-Term Investments | 3,424 | 3,544 | 4,715 |
| Total assets | 10 | 0 | 103 |
| Total Debt | -459 | -828 | -1,730 |
| Net Debt | 1,021 | 1,282 | 1,305 |
| Total liabilities | 2,403 | 2,262 | 3,409 |
| Total Shareholders’ Equity | |||
| (Cash Flow) | 588 | 1,155 | 1,372 |
| Net Operating Cash Flow | 202 | 335 | 127 |
| Capital Expenditure | -1,145 | 1,922 | -180 |
| Net Investing Cash Flow | -27 | -2,288 | -187 |
| Net Financing Cash Flow | 455 | 933 | 1,271 |
| Free Cash Flow | |||
| (Profitability ) | N/A | 28.42 | 34.72 |
| ROA (%) | N/A | 41.04 | 50.57 |
| ROE (%) | 13.87 | 12.10 | 13.59 |
| Net Margin (%) | N/A | 2.35 | 2.56 |
| Asset Turn | N/A | 1.44 | 1.46 |
| Assets/Equity | |||
| (Per-share) Unit: JPY | 70.6 | 72.3 | 89.4 |
| EPS | 149.7 | 140.9 | 212.4 |
| BPS | N/A | 4.35 | 60.00 |
| Dividend per Share | N/A | 16.05 | 16.05 |
Source: Omega Investment