2026-04-10
Home
Japanese

Omega Investment Co., Ltd.
f-code (Investment report – 2Q update)
| Share price (9/26) | ¥2,040 | Dividend Yield (25/12 CE) | 0.0 % |
| 52weeks high/low | ¥985/2,985 | ROE(24/12) | 18.3 % |
| Avg Vol (3 month) | 220.1 thou shrs | Operating margin (TTM) | 27.9 % |
| Market Cap | ¥25.32 bn | Beta (5Y Monthly) | 1.65 |
| Enterprise Value | ¥28.76 bn | Shares Outstanding | 12.409 mn shrs |
| PER (25/12 CE) | 19.5 X | Listed market | TSE Growth |
| PBR (24/12 act) | 3.7 X |
| Click here for the PDF version of this page |
| PDF version |
Strengthening earnings momentum with three-layered growth drivers. With a 2Q record profit, consecutive M&A, and share buybacks as levers, upside to guidance is within reach.
◇ Investment conclusion: bullish. M&A contributes to the trinity of SaaS, AI, and education; 2Q progress was 52% for revenue and 54% for operating profit; parallel financing and share buybacks leave room for upside.
The investment conclusion for f-code, Inc. (hereinafter, the “Company”) is “bullish.” The model that centers on the core SaaS “CODE Marketing Cloud” and strengthens comprehensive capabilities by incorporating UI/UX, SEO, CRM, and other functions through M&A has proven effective, and firm profitability and ROE justify a premium. Cumulative results for the second quarter were revenue of 5,212 million yen and operating profit of 1,177 million yen, representing substantial increases in revenue and profit, with sufficient progress toward the full-year plan. The likelihood of achievement is high, and the structure is such that further operating leverage will take hold in the second half.
Growth drivers are a dual track of external expansion and in-house development. Consecutive M&A in the education and community domain (Deitora, Real us, and VST) is expected to add about 320 million yen to full-year operating profit, reinforcing the cycle of hiring, training, and cross-selling. By repurchasing a total of 200,000 shares of treasury stock and building up debt financing, the Company can operate shareholder returns and growth investment simultaneously, generating tailwinds both for supply–demand conditions and for business expansion. In addition, under IFRS, it recognized 745 million yen in other income through a fair value remeasurement of contingent consideration, while recognizing impairment on the part of goodwill. The stance of containing future volatility through conservative measurement while winning on base earnings is appropriate.
Points to watch are the speed of PMI (post-merger integration: the post-acquisition integration process) and the visualization of KPIs (number of learners, renewal rate, ARPU, orders, and gross profit for AI projects). Provided that the sustainability of ROE and the effectiveness of PMI are monitored at this stage, the upside scenario remains dominant. In light of the above, we recommend adding positions nimbly on dips and increasing the weighting on triggers such as KPI disclosure, PMI progress, and additional large orders or upward revisions.
◇ 2Q FY2025/12 highlights: record-high levels for both revenue and profit, driven by both M&A and products
In the first half of FY2025/12, the Company achieved significant increases in revenue and profit, with revenue of 5,212 million yen (YoY +155.8%), operating profit of 1,177 million yen (YoY +96.8%), profit before tax of 1,093 million yen (YoY +98.8%), and profit attributable to owners of the parent of 646 million yen (YoY +88.3%). Progress was steady at 52% for revenue and 54% for operating profit, renewing the Company’s record quarterly level.
On the business front, organic growth at group companies was augmented by cross-selling, and the launch of new services such as website improvement optimized for AI search (LLMO service) also contributed. Moreover, the Company announced M&A for an online school (Deitora), influencer support/career school (Real us), and video editing school (VST), which is expected to add about 320 million yen to annual operating profit and strengthen the full-year earnings base.
On the financial side, while raising over 5 billion yen in the period to date, the Company repurchased a total of 200,000 shares of treasury stock (approximately 350 million yen) in the first half, ensuring flexibility in capital policy.
As special factors under IFRS, the Company recognized 745 million yen in “other income” associated with a fair value remeasurement of contingent consideration, while recognizing “other expenses” due to impairment of goodwill, etc., at certain consolidated subsidiaries. The former is a remeasurement based on a policy of conservatively estimating the range of achievement after M&A, and the latter reflects discipline in making a conservative estimate of future cash flows. Both are managed on an ongoing basis within the IFRS framework and do not impair the trend of base earnings growth.
Multi-layered growth drivers are functioning through the cross-selling of stock and flow, new services, and disciplined M&A, and we assess that the likelihood of full-year achievement is high within a structure weighted toward the second half.
Although special factors were recognized on both the revenue and expense sides, the growth in the operating profit and the post-M&A monetization scenario are clear. The execution of buybacks and the securing of funding capacity are also tailwinds, making this a phase in which it is easy to hold an upward scenario from both the governance and capital policy angles.
◇ Segment analysis: the two pillars (Marketing / AI and technology) maximize earnings through cross-selling synergies
The Company’s segments consist of two pillars—the “Marketing domain” and the “AI and technology domain”—and by cross-selling stock-type SaaS revenue with side-by-side project revenue, it simultaneously achieves revenue expansion and margin improvement. As of 2Q, the structure is clear: Marketing leads on the revenue side, and AI and technology leads on the profit side.
- Marketing domain: A model that layers execution support, such as ad operations, UI/UX improvement, and CRM optimization on top of the Company’s own SaaS, such as website customer engagement and EFO. In 2Q, the revenue composition was 57.4%, revenue progress 54.4%, and segment profit progress 47.9%. Cross-selling across the group is expanding, and a multi-layered revenue structure has taken hold in which project revenue (flow) is added to recurring subscriptions (stock).
- AI and technology domain: Provides the use of generative AI, website production, system and app development, infrastructure construction, and AI reskilling support. It plays the role of capturing advanced demand originating from Marketing and raising value-added and pricing. In 2Q, it accounted for 42.6% of revenue, with revenue progress of 49.4% and segment profit progress of 65.7%, serving as the driver on the profit side.
M&A synergies are also advancing. In the first half, the Company successively consolidated (1) Deitora (digital-skill education), (2) Real us (influencer support/career school), and (3) VST (video editing school), assuming a full-year addition of about 320 million yen to operating profit. Starting from education and community assets, this creates a cycle of talent supply and customer development, supporting the creation of projects in both domains.
Company-wide, as of the second quarter, revenue progress was 52% and operating profit progress was 54%, representing a smooth start even under an earnings structure weighted toward the second half. Cross-selling across segments and the operation of M&A are increasing the likelihood of achieving the full-year outlook.
◇ Earnings forecast: the full-year “revenue of 10.0 billion yen and operating profit of 2.2 billion yen” is highly likely to be achieved; profit leadership is shifting to AI and technology
The Company’s plan for FY2025/12 (revenue of 10.0 billion yen, operating profit of 2.2 billion yen, profit attributable to owners of the parent of 1,285 million yen, and EPS of 104.84 yen) remains unchanged, and progress as of 2Q is steady at 52% for revenue and 54% for operating profit. Guidance is conservative, and even taking second-half seasonality into account, the likelihood of achievement is high.
The profit engine is two-layered. For the full year, the Company plans segment profit of 2,041 million yen for Marketing and 722 million yen for AI and technology, with the latter—where unit prices and gross profit can grow—designed to raise the Company-wide margin. In fact, as of 2Q, segment profit progress was 47.9% for Marketing versus 65.7% for AI and technology, indicating that data support the shift in profit leadership.
External growth drivers are also strong. The three deals announced in the first half, Deitora, Real us, and VST, are expected to add about 320 million yen to annual operating profit (contribution this term varies with consolidation timing). Starting from education and community assets, they are expected to create a cycle of hiring, training, and project development, and to raise both project unit prices and order certainty in both Marketing and AI and technology.
Capital policy and funding arrangements are working both offensively and defensively. While raising over 5 billion yen in the period to date, the Company repurchased a total of 200,000 shares of treasury stock (approximately 350 million yen), ensuring flexibility for M&A funding and PMI investment while also sending a clear signal of shareholder returns.
Through (1) profit leading in AI and technology, (2) M&A contributions in the education and community domain, and (3) the simultaneous operation of nimble financing and share buybacks, the Company retains room for upside in addition to achieving guidance. Full-year profit momentum is strong.
In addition to operating profit progress of 54%, the 65.7% progress in AI and technology further raises the certainty level. The three M&A deals simultaneously promote cross-selling and unit price increases; depending on the ramp-up of PMI, this is a phase in which the probability of profit upside increases.
◇ Share price trend and points to watch: after posting a year-to-date high following earnings results, the stock declined on profit taking and formed a timely dip. Investors are recommended to stay bullish.
The investment conclusion remains “maintain bullish.” The valuation range, the market’s assessment of an actual PBR of 3.70x, a forward PER of 18.39x, and a market capitalization of 25.3 billion yen, is a reasonable premium given the high ROE (18.3%) and the growth scenario of M&A × co-selling.
The stock price posted a year-to-date high of 2,985 yen on August 15, the first trading day after the August 14 earnings announcement. Thereafter, it came under pressure from profit-taking and entered a downtrend, moving as follows: August 26: 2,573 yen → August 27: 2,505 yen → August 28: 2,465 yen → August 29: 2,458 yen. In September, the decline continued, with the following prices: September 1, 2,391 yen; September 2, 2,359 yen; and on September 3, it formed a bottom zone with a closing price of 2,120 yen and a sharp increase in trading volume. Subsequently, it tested a second bottom at 2,000 yen on September 12 and 1,966 yen on September 16. From September 18, it shifted into a trading range of 2,000–2,150 yen, with prices of 2,103 yen on September 18, 2,128 yen on September 22, and 2,060 yen on September 24. The maximum drawdown from the high on August 15 was approximately −34% on September 16.
The linkage between catalysts and market reaction is clear. In addition to the strong second-quarter results (revenue of 5,212 million yen and operating profit of 1,177 million yen), the company also disclosed IFRS items on the same day, including the remeasurement of contingent consideration (+745 million yen / partial impairment -363 million yen). A new high and an expansion in trading volume occurred on the following 15th, confirming event-driven fund inflows. In addition, the M&A of Real US/Buist, announced in August, strengthened education/community assets and heightened expectations for co-selling and unit price improvement in the second half.
The valuation continues to reflect growth expectations. PER of 18.39x and PBR of 3.70x are levels that factor in (1) full-year progress (revenue 52.1% / operating profit 53.5%), (2) upside potential from consecutive M&A, and (3) profit-leading performance in AI / Technology.
Technically, there is thick support at 2,000–2,050 yen (around September 12, 16, and 24), selling pressure on rebounds at 2,350–2,450 yen (September 1 and 2), and strong resistance at 2,900–3,000 yen. The assumed scenario is: around 2,000 yen = a buy-on-dips candidate / above 2,450 yen = a full-fledged recovery trend / a break above 3,000 yen = a reacceleration of momentum.
Conditions for strengthening the overweight are (1) periodic disclosure of M&A PMI (education/community × Marketing/AI) KPIs (number of participants, retention rate, ARPU; AI order intake/gross profit), (2) timely disclosure of upward revisions or large orders, (3) continued additional share buybacks, and (4) accumulation of track record in introducing new services such as LLMO support. We judge the area around 2,000 yen to be a level for nimble add-ons.
Company profile
◇ A company listed on the Growth Market that accelerates growth by combining SaaS with DX support
f-code, Inc. is a growth company that integrates SaaS originating from marketing with DX support and scales up while expanding its business domains through M&A.
It was established on March 15, 2006, and is headquartered in Shinjuku-ku, Tokyo. Capital was 55.849 million yen as of the end of June 2025. The group consists of 15 companies, with about 850 executives and employees, and its structure is designed to strengthen integration and coordination as the scale of business expands.
The business model is characterized by leveraging expertise in digital marketing, its founding business, and, in addition to providing proprietary products such as entry form optimization and website customer engagement, providing end-to-end side-by-side support from strategy design to implementation. In its history as well, it has expanded stepwise from consulting to SaaS and further to DX support through AI and technology.
Its mission is “Create the better world with Marketing Technology.” It sets forth a value proposition of correcting disparities in corporate digital utilization and promoting DX in each industry with customer experience (CX) as the starting point, and it will continue to aim for growth on the dual tracks of M&A and product enhancement.
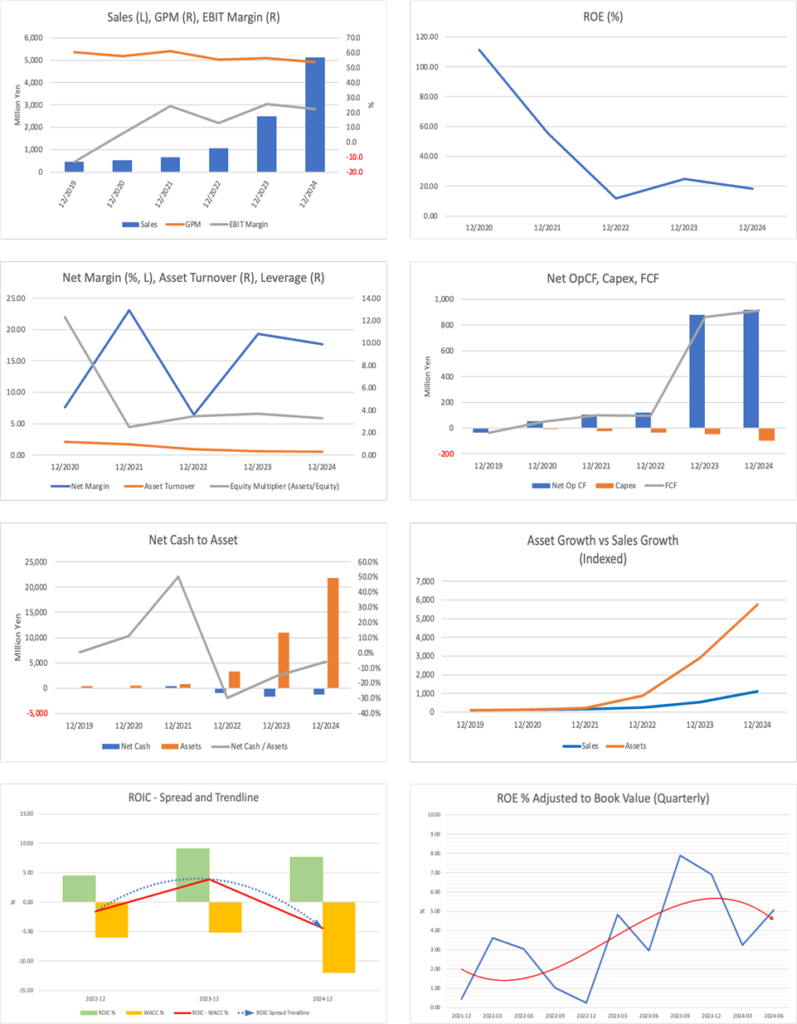
Key financial data
| Unit: million yen | 2021 | 2022 | 2023 | 2024 | 2025 CE |
| Sales | 661 | 1,072 | 2,482 | 5,131 | 10,000 |
| EBIT (Operating Income) | 160 | 138 | 638 | 1,149 | |
| Pretax Income | 150 | 124 | 605 | 1,323 | 2,033 |
| Net Profit Attributable to Owner of Parent | 152 | 69 | 480 | 906 | 1,285 |
| Cash & Short-Term Investments | 602 | 978 | 4,040 | 6,236 | |
| Total assets | 843 | 3,281 | 10,975 | 21,825 | |
| Total Debt | 178 | 1,961 | 5,721 | 7,527 | |
| Net Debt | -424 | 983 | 1,681 | 1,291 | |
| Total liabilities | 351 | 2,592 | 7,655 | 15,720 | |
| Total Shareholders’ Equity | 492 | 690 | 3,187 | 6,728 | |
| Net Operating Cash Flow | 103 | 121 | 878 | 916 | |
| Capital Expenditure | 24 | 35 | 46 | 99 | |
| Net Investing Cash Flow | -16 | -1,441 | -3,404 | -2,881 | |
| Net Financing Cash Flow | 189 | 1,695 | 5,586 | 4,158 | |
| Free Cash Flow | 100 | 97 | 860 | 911 | |
| ROA (%) | 22.37 | 3.36 | 6.73 | 5.52 | |
| ROE (%) | 55.52 | 11.74 | 24.75 | 18.27 | |
| EPS (Yen) | 18.6 | 8.4 | 23.2 | 77.9 | 104.8 |
| BPS (Yen) | 60.0 | 83.2 | 302.2 | 548.8 | |
| Dividend per Share (Yen) | 0.00 | 0.00 | 0.00 | 0.00 | 0.00 |
| Shares Outstanding (Million shares) | 8.20 | 8.29 | 10.55 | 12.17 |
Source: Omega Investment from company data, rounded to the nearest whole number.
Share price
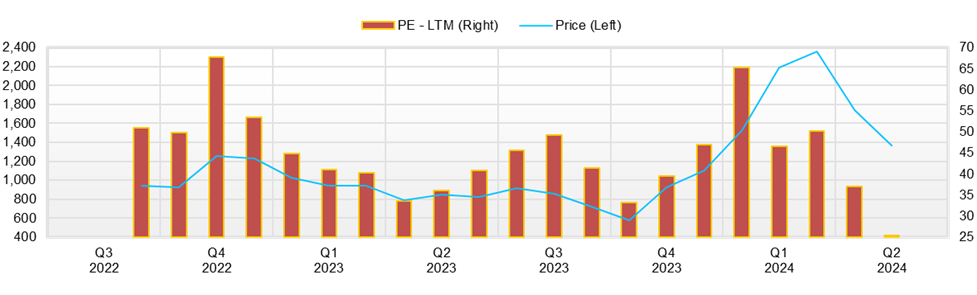
Key stock price data
Financial data (quarterly basis)
| Unit: million yen | 2023/12 | 2024/12 | 2025/12 | ||||||
| 2Q | 3Q | 4Q | 1Q | 2Q | 3Q | 4Q | 1Q | 2Q | |
| (Income Statement) | |||||||||
| Sales | 479 | 716 | 902 | 1,035 | 1,002 | 1,040 | 2,053 | 2,417 | 2,796 |
| Year-on-year | 78.2% | 135.5% | 234.1% | 168.7% | 109.3% | 45.2% | 127.7% | 133.4% | 178.9% |
| Cost of Goods Sold (COGS) | 168 | 292 | 423 | 401 | 482 | 429 | 1,050 | 808 | 1,261 |
| Gross Income | 311 | 424 | 479 | 635 | 520 | 611 | 1,003 | 1,608 | 1,535 |
| Gross Income Margin | 65.0% | 59.2% | 53.1% | 61.3% | 51.9% | 58.8% | 48.9% | 66.6% | 54.9% |
| SG&A Expense | 202 | 237 | 250 | 320 | 310 | 299 | 737 | 1,185 | 1,093 |
| EBIT (Operating Income) | 110 | 187 | 229 | 315 | 210 | 312 | 266 | 423 | 442 |
| Year-on-year | 55.2% | 378.9% | 1675.9% | 181.1% | 91.6% | 66.7% | 16.1% | 34.5% | 110.3% |
| Operating Income Margin | 22.9% | 26.2% | 25.4% | 30.4% | 21.0% | 30.0% | 13.0% | 17.5% | 15.8% |
| EBITDA | 127 | 205 | 252 | 356 | 257 | 333 | 292 | 460 | 484 |
| Pretax Income | 103 | 179 | 215 | 296 | 255 | 344 | 383 | 541 | 553 |
| Consolidated Net Income | 63 | 144 | 197 | 191 | 164 | 222 | 327 | 352 | 357 |
| Minority Interest | 0 | -0 | -0 | 8 | 4 | 2 | 15 | 28 | 36 |
| Net Income ATOP | 63 | 144 | 198 | 183 | 160 | 220 | 313 | 325 | 322 |
| Year-on-year | 42.0% | 654.1% | 3095.2% | 144.6% | 153.9% | 52.8% | 58.1% | 77.6% | 100.5% |
| Net Income Margin | 13.2% | 20.1% | 21.9% | 17.7% | 16.0% | 21.2% | 15.2% | 13.4% | 11.5% |
| (Balance Sheet) | |||||||||
| Cash & Short-Term Investments | 4,137 | 3,887 | 4,040 | 4,937 | 7,233 | 7,021 | 6,236 | 4,969 | 7,206 |
| Total assets | 7,187 | 10,552 | 10,975 | 14,588 | 17,973 | 17,629 | 21,825 | 24,553 | 25,838 |
| Total Debt | 3,987 | 5,649 | 5,721 | 8,430 | 8,484 | 7,988 | 7,527 | 9,155 | 11,104 |
| Net Debt | -150 | 1,762 | 1,681 | 3,493 | 1,251 | 967 | 1,291 | 4,187 | 3,898 |
| Total liabilities | 4,382 | 7,437 | 7,655 | 10,980 | 12,424 | 11,803 | 15,720 | 18,607 | 19,755 |
| Total Shareholders’ Equity | 2,805 | 2,981 | 3,187 | 3,408 | 5,988 | 6,277 | 6,728 | 6,619 | 6,741 |
| (Profitability %) | |||||||||
| ROA | 3.85 | 4.67 | 6.73 | 5.94 | 5.45 | 5.40 | 5.34 | 5.20 | 5.38 |
| ROE | 9.46 | 15.61 | 24.75 | 19.01 | 15.58 | 16.44 | 17.67 | 20.30 | 18.52 |
| (Per-share) Unit: JPY | |||||||||
| EPS | 3.0 | 6.9 | 9.4 | 17.3 | 13.2 | 18.2 | 25.5 | 26.4 | 26.3 |
| BPS | 267.5 | 283.5 | 302.2 | 282.1 | 494.5 | 518.3 | 548.8 | 536.8 | 552.5 |
| Dividend per Share | 0.00 | 0.00 | 0.00 | 0.00 | 0.00 | 0.00 | 0.00 | 0.00 | 0.00 |
| Shares Outstanding (million shares) | 10.49 | 10.49 | 10.55 | 10.61 | 12.11 | 12.11 | 12.17 | 12.35 | 12.40 |
Source: Omega Investment from company materials
Financial data (full-year basis)
| Unit: million yen | 2021 | 2022 | 2023 | 2024 |
| (Income Statement) | ||||
| Sales | 661 | 1,072 | 2,482 | 5,131 |
| Year-on-year | 24.3% | 62.3% | 131.5% | 106.7% |
| Cost of Goods Sold | 258 | 479 | 1,084 | 2,379 |
| Gross Income | 403 | 593 | 1,398 | 2,752 |
| Gross Income Margin | 61.0% | 55.3% | 56.3% | 53.6% |
| SG&A Expense | 242 | 455 | 759 | 1,603 |
| EBIT (Operating Income) | 160 | 138 | 638 | 1,149 |
| Year-on-year | 407.6% | -13.9% | 362.0% | 80.0% |
| Operating Income Margin | 24.3% | 12.9% | 25.7% | 22.4% |
| EBITDA | 164 | 172 | 711 | 1,238 |
| Pretax Income | 150 | 124 | 605 | 1,323 |
| Consolidated Net Income | 152 | 69 | 479 | 934 |
| Minority Interest | 0 | 0 | 0 | 28 |
| Net Income ATOP | 152 | 69 | 480 | 906 |
| Year-on-year | 275.3% | -54.5% | 591.7% | 88.8% |
| Net Income Margin | 23.1% | 6.5% | 19.3% | 17.7% |
| (Balance Sheet) | ||||
| Cash & Short-Term Investments | 602 | 978 | 4,040 | 6,236 |
| Total assets | 843 | 3,281 | 10,975 | 21,825 |
| Total Debt | 178 | 1,961 | 5,721 | 7,527 |
| Net Debt | -424 | 983 | 1,681 | 1,291 |
| Total liabilities | 351 | 2,592 | 7,655 | 15,720 |
| Total Shareholders’ Equity | 492 | 690 | 3,187 | 6,728 |
| (Cash Flow) | ||||
| Net Operating Cash Flow | 103 | 121 | 878 | 916 |
| Capital Expenditure | 24 | 35 | 46 | 99 |
| Net Investing Cash Flow | -16 | -1,441 | -3,404 | -2,881 |
| Net Financing Cash Flow | 189 | 1,695 | 5,586 | 4,158 |
| Free Cash Flow | 100 | 97 | 860 | 911 |
| (Profitability ) | ||||
| ROA (%) | 22.37 | 3.36 | 6.73 | 5.52 |
| ROE (%) | 55.52 | 11.74 | 24.75 | 18.27 |
| Net Margin (%) | 23.06 | 6.47 | 19.33 | 17.65 |
| Asset Turn | 0.97 | 0.52 | 0.35 | 0.31 |
| Assets/Equity | 2.48 | 3.49 | 3.68 | 3.31 |
| (Per-share) Unit: JPY | ||||
| EPS | 18.6 | 8.4 | 23.2 | 77.9 |
| BPS | 60.0 | 83.2 | 302.2 | 548.8 |
| Dividend per Share | 0.00 | 0.00 | 0.00 | 0.00 |
| Shares Outstanding (million shares) | 8.20 | 8.29 | 10.55 | 12.17 |
Source: Omega Investment from company materials