2026-04-10
Home
Japanese

Omega Investment Co., Ltd.
Sansei Landic (Investment report – Basic)
| Share price (10/6) | ¥1,333 | Dividend Yield (25/12 CE) | 3.5 % |
| 52weeks high/low | ¥920/1,380 | ROE(24/12 act) | 8.5 % |
| Avg Vol (3 month) | 14.5 thou shrs | Operating margin (24/12 act) | 7.3 % |
| Market Cap | ¥11.44 bn | Beta (5Y Monthly) | 0.23 |
| Enterprise Value | ¥21.17 bn | Shares Outstanding | 8.584 mn shrs |
| PER (25/12 CE) | 9.9 X | Listed market | TSE Standard |
| PBR (24/12 act) | 0.8 X |
| Click here for the PDF version of this page |
| PDF version |
Share price revaluation in the spotlight: the earnings power of rights adjustment and the growth trajectory drawn by the “22.0 billion yen in purchases” plan.
Investment conclusion
The share price has started straightforwardly to factor in the series of measures that contribute to shareholder value, namely the share buyback, the dividend increase, the upward revision to full-year profit, and the uplift of the medium-term plan targets. Given the low required rate of return derived from the low beta (β 0.41) and capital efficiency with ROE of 8.5%, PBR of 0.74x, PER of 9.79x, and market capitalization of 10.8 billion yen are still modest and can be interpreted as reflecting a significant discount to growth and the sustainability of ROE. Therefore, there is substantial room for share price re-rating.
The Company has built up highly reproducible earnings by operating an integrated process, proposal of projects → purchases → rights adjustment → sales—centered on the revitalization of real estate with complex rights relationships such as leasehold land and old unutilized properties. The combination of this rights-adjustment know-how and inventory-turnover design increases the predictability of results and underpins share price valuations.
Results showed high progress with cumulative 2Q net sales of 14.51 billion yen (+11.7%) and operating income of 2.24 billion yen (+118.4%). The full-year forecast was revised upward to net sales of 24.0 billion yen, operating income of 2.02 billion yen, ordinary income of 1.65 billion yen, and net income of 1.10 billion yen; the year-end dividend was also increased to 26 yen (annual 43 yen). Purchases were 7.968 billion yen in 2Q (+12.2%). Multiple large purchases are planned for the second half, and the annual purchase plan was increased from 17.6 billion yen to 22.0 billion yen. A robust pipeline enhances the visibility of next fiscal year’s sales and profit. The targets for the final fiscal year (FY2027) of the medium-term plan were also raised to operating income of 2.5 billion yen and ordinary income of 2.0 billion yen, indicating upside potential in earnings power. In capital policy, a share buyback of 194,900 shares (approximately 200 million yen) was completed from February to May. In August, the disposal and payment of 17,800 treasury shares as RS (Restricted Stock) for the employee stock ownership plan was completed, a design that balances investment in human capital with capital efficiency.
According to our analysis, at the beginning of the year, the market expected secular EPS growth to be flat to slightly positive, but the current share price factors in annual growth of 5–6%. In light of strengthened purchases and the upward revision to the medium-term plan, we think this assumption remains conservative. Achieving ROE of 10% is now in sight, and a correction to PBR of 1.0x is becoming more realistic on an 18–24 month horizon.
Our proposed investment stance is “bullish over the medium to long term,” and we would take a particularly active approach on short-term dips. Management’s shareholder-friendly measures and steady earnings generation support the stock’s valuation, leaving plenty of scope for the current valuation discount to narrow further.
1. Company overview
A pure-play in rights adjustment × real estate revitalization. Small in size but strong in discernment and execution capability
The Company’s core business is the real estate sales business, which applies “rights adjustment” to properties with complex real estate rights and enhances their value for sale. The consolidated group consists of the parent and two subsidiaries (Sansei Landic Funding and Hachimantai Tourism Revitalization GK).
The typical property types the Company handles are the three categories of (i) Leasehold land (land subject to leasehold rights), (ii) Old unutilized properties (land with buildings occupied by tenants, etc.), and (iii) Freehold; these may appear alone or in combination. Properties are sourced from brokers and other channels, then purchased after due examination of legal regulations and rights relationships, and sold after enabling liquidity and higher-value use through rights adjustment, this is the business model.
Recent scale: In the first half of FY12/2025, consolidated net sales were 14.51 billion yen, and operating income was 2.24 billion yen. Total assets were 32.249 billion yen, and the equity ratio was 42.7%. Interim net income was 1.41 billion yen, demonstrating high quarterly profitability.
The Company’s strength lies in converting into economic value, through specialized knowledge and negotiating power, areas such as Leasehold land and Old unutilized properties that tend to be left undervalued precisely because “rights are involved.” By operating standardized investigation/negotiation processes, as well as rights-adjustment schemes tailored to each case, the model builds earnings while balancing gross margin and inventory turnover.
Because value creation is “rights-driven,” sensitivity to the economic cycle is relatively low, and sourcing capability, along with execution capability, tends to form barriers to entry. As a result, the Company’s pipeline raises medium-term sales visibility and contributes to stabilizing the resource for shareholder returns. Although small, it differentiates itself through specialization; continuous strengthening of purchases and the honing of rights-adjustment capability are the keys to expanding corporate value.
2. Business characteristics and contents
Expertise in leasehold land, old unutilized properties, and standardized processes that turn rights into value
The Company’s core is a model in which it purchases real estate that tends to be left undervalued due to complex rights relationships, conducts rights adjustments through negotiation, legal work, and engineering, enables liquidity and higher-value use, and then sells. The three categories handled are (i) Leasehold land (land subject to leasehold rights), (ii) Old unutilized properties (land with buildings occupied by tenants, etc.), and (iii) Freehold, and the Company handles both standalone and mixed cases. The basic structure is to raise economic value through rights adjustment and earn a selling profit.
Leasehold land often becomes “dormant assets” due to long-term leasing and generational changes, resulting in contracts that become ambiguous and delays in revising ground rents. The Company undertakes coordination and management on behalf of owners and lessees, enhancing usability. The processes are standardized, and operations are run based on logic that reflects regulatory issues such as frontage obligations and designation of private road locations.
In 2Q FY12/2025, sales were 183 cases, and net sales were 14.51 billion yen (+11.7% YoY). The breakdown was as follows: Leasehold land, 8.074 billion yen; Old, unutilized properties, 4.377 billion yen; Freehold, 1.786 billion yen; and other income, 273 million yen, with Leasehold land driving the results. Other income supplements result from ground rents and brokerage/commission fees, among others. Purchases were a steady 7.968 billion yen (+12.2%), and the full-year purchase plan was increased from 17.6 billion yen to 22.0 billion yen. Seasonality has shifted in recent years from the former “first-half purchases / second-half sales” to “second-half purchases / first-half sales,” and on a full-year basis, purchases and sales are becoming more stable.
From an investment-conclusion perspective, (i) deep expertise in rights issues and negotiating power, (ii) standardization of investigation/adjustment flows, and (iii) agility in purchases and exits constitute barriers to entry. A portfolio centered on Leasehold land has relatively low sensitivity to the economy and interest rates and tends to form an earnings structure with suppressed volatility. On the other hand, because individual projects have high idiosyncrasies, the thickness of the pipeline determines the certainty of results. The recent surge in purchases and the shift in seasonality are positioned as factors that enhance the visibility of sales in the next fiscal year and beyond.
3. Major shareholders and investment trends
“Owner + employees + individuals” as the core. Tightening supply–demand with “buybacks and RS”
The shareholder base is three-layered: owner-managers, employee stock ownership plans, and individual investors. As of the end of December 2024, the major shareholders were Mr. Takashi Matsuzaki (15.61%), Mr. Shoji Matsuura (5.52%), Japan Custody Bank (trust account) (4.93%), Ms. Junko Ozawa (3.59%), and the Sansei Employee Stock Ownership Plan (2.84%), among others. By shareholder category, “individuals” account for a dominant 85.88%, forming a long-term-friendly base. Treasury shares at fiscal year-end totaled 309,834 shares, providing a buffer against fluctuations in supply and demand.
In 2025, capital policy brought an apparent change on the supply–demand side. The share buyback, completed from February to May, involved a total of 194,900 shares and 200 million yen, demonstrating an awareness of shareholder value returns and capital efficiency. In August, the Company disposed of 17,800 treasury shares as RS for the employee stock ownership plan (down from the initial plan of 20,000 shares due to partial forfeiture). The simultaneous progress of shrinking the free float through buybacks and granting incentives to employees achieves sustained engagement and stabilization of supply and demand.
Institutional investor involvement is currently limited but has room for expansion. Against a base centered on individuals with a strong owner presence, domestic public investment trusts and pension-type small-cap strategies are dotted around, and holdings by asset managers such as Sumitomo Mitsui DS Asset Management are confirmed. If shareholder measures and earnings momentum continue, there is room to attract fund demand.
Practical implications: (i) the thickness of owner holdings ensures consistency of governance and a long-term orientation; (ii) buybacks + RS tighten supply–demand and improve its quality; and (iii) although liquidity risk remains due to the heavy individual base, accumulation of IR/disclosure and results-linked measures can encourage institutional investor participation. The current shareholder structure is likely to function as “supply-demand support” in a scenario of PBR correction.
4. Medium-term management plan
Upward revision through expansion of purchases × capital efficiency. Final-year targets: operating income 2.5 billion yen, ordinary income 2.0 billion yen, ROE 9–12%
The Company raised the final-year targets of the medium-term management plan (August 2024–FY2027) on August 8, 2025. The revised figures are operating income of 2.5 billion yen (+0.5 billion) and ordinary income of 2.0 billion yen (+0.35 billion), while the ROE target of 9–12% remains unchanged. The outlook is for profit margins to exceed the plan in the three areas of Leasehold land, Old unutilized properties, and Freehold, along with continued steady purchases. At the same time, each profit forecast for FY12/2025 full-year was revised upward, which serves to substantiate the feasibility of the medium-term plan.
The growth drivers are both the quantity and quality of purchases. In 2025, multiple large purchases are planned for the second half, and the annual purchase plan has been raised to 22.0 billion yen. Real estate for sale is expected to increase, reflecting the expansion of purchases in the second half. The Company’s view is that if the current purchase level is maintained, the final-year targets are sufficiently achievable. By price band, the ratio of large projects “over 500 million yen” is on an upward trend, and projects are scaling up.
On strategy, the Company sets out an integrated approach across business, financial, and non-financial fronts. In business, it broadens the base through the “expansion of derivative businesses” and “area expansion/diversification of deal-sourcing channels,” among other strategies. In finance, it involves “identification and optimization of capital costs,” “optimization of cash allocation,” and “strengthening shareholder returns.” On the non-financial side, it supports ROE improvement through human capital, sustainability, governance, and strengthening IR/PR.
Significant quarterly volatility is a built-in characteristic of this model. The Company also clearly states that it “prioritizes stable growth over the medium to long term rather than short-term straight-line increases,” and results fluctuate depending on the timing of purchases. However, over the medium term, it aims to achieve a stable growth curve, and its policy is to create earnings opportunities by increasing inventories (such as real estate for sale) alongside the expansion of purchases. Investors should follow the main KPIs: (i) execution against the purchase plan, (ii) the balance between the ratio of large projects and turnover, and (iii) the ROE range (9–12%).
5. Regarding international operations
A domestically self-contained model with limited foreign-exchange impact
The Company’s business consists of a single segment (real estate sales business). There are no overseas sales or tangible fixed assets located outside of the country. In other words, both earnings and assets are self-contained within the domestic economy. The two consolidated subsidiaries are also located domestically, including Hachimantai Tourism Revitalization GK (location: Hachimantai City, Iwate Prefecture), and there are no overseas subsidiaries or bases. Operating cash flow and financing are run mainly through transactions with domestic financial institutions.
This domestic concentration is consistent with the fact that the Company’s competitive advantage is rooted in rights relationships unique to Japan (Leasehold land and Old unutilized properties under the former Leasehold and House Lease Law, etc.). As a result of accumulating “Japan-specific practical know-how,” such as complex rights adjustments, neighborhood negotiations, and the application of building regulations, the standardization of the value chain and negotiating power support profitability. Deploying an equivalent model overseas would require high costs to adapt to each country’s systems and business practices; we believe that, in the short to medium term, growth is maximized through deeper cultivation of the domestic market.
From a risk perspective, the very low sensitivity to foreign exchange makes analysis straightforward for investors. There are no foreign-currency-denominated transactions associated with operating activities. Market risk, such as exchange rates to which the Company is exposed, is primarily indirect price/exchange-rate risk through investment securities (mainly investment trusts). Therefore, the direct impact of rapid yen exchange-rate movements on profit and loss and the balance sheet is limited; interest rates (domestic borrowings) and real estate market conditions are the primary drivers of performance.
Key points to note are: (i) among external factors, exchange rates are noise, while interest rates and the purchasing environment are the main risks; (ii) owing to the absence of overseas bases, lightweight fixed costs and quick decision-making are maintained; and (iii) if, when expanding business scale in the future, the Company were to choose funding circulation and sales channels using “overseas resources” (e.g., exits to overseas investors, co-investment schemes), new risks in exchange, regulations, and compliance would arise and should be monitored. The current base scenario aims to balance scale expansion and capital efficiency through a domestic focus, and the driver of PBR correction should realistically be sought not in internationalization, but in domestic purchasing capability, turnover, and shareholder measures.
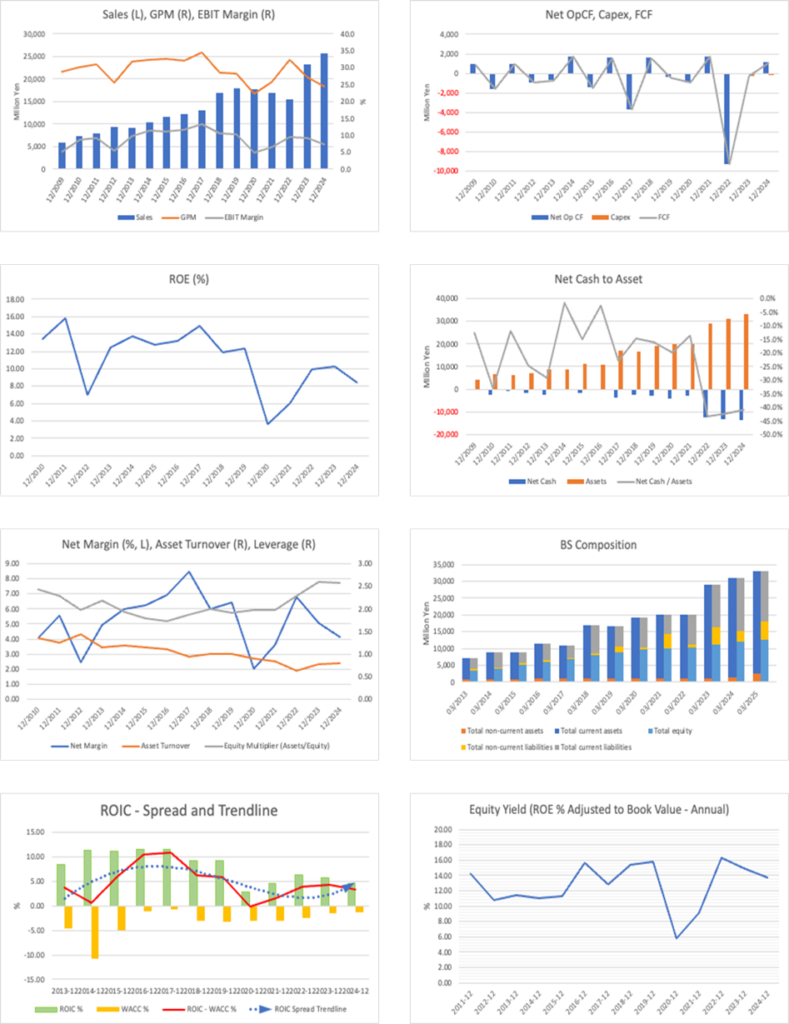
6. Long-term performance
Gradual expansion and one-off fluctuations; net sales up approximately +44% over five years; ROE in the 8–10% range
Over the past five years, including the COVID-19 period, the Company has steadily increased net sales. Consolidated net sales expanded from 17.77 billion yen in 2020 to 25.62 billion yen in 2024 (+44%, an annual average of approximately 9–10%). Ordinary income also doubled from 709 million yen in 2020 to 1.585 billion yen in 2024 (both consolidated; fractional amounts rounded to the nearest thousand yen). Although profitability fluctuates by year, operating income was 2.155 billion yen in 2023 (operating margin of approximately 9%) and, after a pause at 1.882 billion yen in 2024, rapidly recovered to 2.240 billion yen on a cumulative basis for the second quarter of FY12/2025 (+118% YoY), maintaining an upward trend in the medium term while tolerating volatility.
In terms of capital efficiency, ROE has recently hovered in the 8–10% range, with the latest figure at 8.5%. The equity ratio has been stable at around 40%. This level is consistent with the Company’s model of accumulating profit through inventory turnover, associated with rights adjustments, without relying on excessive leverage. The financial position at fiscal period-end is also sound: in the second quarter, total assets were 32.249 billion yen, and the equity ratio was 42.7%. The Company possesses a certain resilience to changes in the funding environment.
The factors supporting this long-term trend are the buildup of purchasing capability and rights-adjustment throughput. The thickness of the project pipeline has stabilized sales opportunities, and an increase in the ratio of large purchases can be confirmed at present. In addition, seasonality has shifted to first-half sales / second-half purchases, and although quarterly fluctuations remain, purchases and sales for the full year have become more stable than before.
From an investor’s perspective, three points form the base strength of medium-term returns: (i) a net sales CAGR of approximately 7–8%; (ii) maintenance of the ROE range of 8–10%; and (iii) inventory management that absorbs purchasing volatility. Quarterly profit and loss fluctuations are inherently large, and the evaluation (PBR) is easily influenced by how progress appears. Therefore, the KPIs to be followed are the annual amount of purchases (plan: 22.0 billion yen), inventory turnover, and tracking of the ROE range. If these continue, the sustainability of the re-rating will increase, in our view.
7. Results in the most recent financial statements
Leasehold land led; gross profit and cash flow improved; the second quarter saw higher revenue and profit, and an improved financial structure.
For the cumulative second quarter of FY12/2025, net sales were 14.51 billion yen (+11.7% YoY), operating income was 2.24 billion yen (+118.4%), ordinary income was 2.08 billion yen (+141.1%), and interim net income attributable to owners of parent was 1.41 billion yen (+146.1%). Interim net income per share was 172.40 yen, a rebound from the previous year, together with an improved sales mix, which lifted profit. At the end of the second quarter, total assets were 32.249 billion yen, and the equity ratio was 42.7%.
On the sales front, the number of cases sold was 183, and net sales increased YoY. The breakdown shows that Leasehold land accounts for 8.074 billion yen (+69.1%), leading the results, followed by Freehold at 1.786 billion yen (+238.0%), while Old unutilized properties account for 4.377 billion yen (−41.4%). Other income (ground rents; brokerage and commission fees, etc.) was 273 million yen (+25.8%). Overall, growth in Leasehold land and Freehold was the main driver of higher net sales.
In terms of profitability, both gross profit and operating income exceeded the levels of the same period of the previous year. Actual results showed a gross profit of 4.607 billion yen, SG&A expenses of 2.367 billion yen, and an operating income of 2.240 billion yen, marking progress ahead of the initial plan. By segment as well, profit margins are expected to exceed the plan, mainly in Leasehold land.
Purchases totaled 7.968 billion yen (+12.2%) on a cumulative basis for the second quarter. As multiple large purchases are planned from the third quarter onward, the annual purchase plan was increased from 17.6 billion yen to 22.0 billion yen. As a result, the thickness of inventories and the resources for sales in the next fiscal year and beyond are secured, increasing the visibility of growth.
Finance and cash flow are on an improving trend. Against the backdrop of increased sales, real estate for sale and interest-bearing debt decreased compared with the end of the previous fiscal year, and the equity ratio rose to 42.7%. Operating cash flow was a positive 3.391 billion yen, and financing cash flow was negative due to repayments of long-term borrowings, indicating a healthy cycle.
As a point to note, by business characteristics, the Company is managed on the premise of seasonality, with black ink in the first half and red ink in the second half. This clearly indicates that, as initially planned, a loss is expected in the second half. Even so, the full-year forecast for each profit level has been revised upward, and the year-end dividend is planned to increase to 26 yen (annual 43 yen). The crux of these results is that, while tolerating short-term fluctuations, the Company is increasing the certainty of annual profit by accumulating purchases and turnover.
8. Full-year earnings forecast
Net sales are conservative; profit revised upward; despite a planned loss in the second half, full-year profit increases; annual dividend of 43 ye.n
The Company revised its plan to net sales of 24.0 billion yen (−6.3% YoY), operating income of 2.02 billion yen (+7.3%), ordinary income of 1.65 billion yen (+4.1%), and net income of 1.10 billion yen (+4.7%). The reason for the upward revision is the outlook for profit margins to exceed the plan in each of Leasehold land, Old unutilized properties, and Freehold. Net sales were recalculated conservatively in light of market conditions and the sales mix. The year-end dividend is planned to be increased to 26 yen, and the annual dividend is scheduled at 43 yen (interim dividend of 17 yen + year-end dividend of 26 yen).
Progress on a cumulative basis for the second quarter is as follows: net sales of 14.511 billion yen, approximately 60% of the plan; operating income of 2.240 billion yen; ordinary income of 2.076 billion yen; and net income of 1.410 billion yen, with each profit item already exceeding the full-year plan. This is due to the design associated with seasonality (a planned loss in the second half), and the policy is to maintain full-year profit growth.
The operational premise is strengthened purchases. Cumulative purchases for the second quarter were 7.968 billion yen (+12.2%), and the annual purchase plan was increased from 17.6 billion yen to 22.0 billion yen. By incorporating multiple large projects in the latter half, the intention is to thicken the resources (inventories) for next fiscal year’s sales. Even by price band in the latest data, an increase in the ratio of over 500 million yen can be confirmed, and scaling-up is progressing.
Going forward, we would examine: (i) the validity of the design of full-year profit growth despite a planned loss in the second half (including whether there are any provisions or front-loaded expenses, and how detailed the sales plan is for the third to fourth quarters); (ii) the degree of achievement of 22.0 billion yen in purchases and the quality of inventories; and (iii) the sustainability of the 43-yen dividend (next fiscal year’s EPS and cash generation). The Company states it prioritizes stable growth over the medium term, and clearly manages to smooth the medium-term curve while tolerating quarterly fluctuations. Practically, rather than just short-term progress rates, it is advisable to track, via KPIs, whether the cycle of purchases → inventories → sales is running according to plan.
9. Growth strategy and risks
Expansion through purchasing capability × three-in-one management. Short-term volatility is by design; interest rates and market conditions are the main risks.
The Company’s growth drivers are centered on (i) deepening of existing businesses (Leasehold land and Old unutilized properties), (ii) commercialization of derivative businesses and area expansion, and (iii) diversification of deal acquisition channels; under “three-in-one” management that integrates financial and non-financial aspects, the plan is designed to aim for improvement in ROE and correction of PBR. Specifically, the Company clarifies, as policies through FY2027, the business strategy (expansion of derivative businesses, diversification of the business menu, area expansion, etc.), the financial strategy (identification and optimization of capital costs, optimization of cash allocation, strengthening shareholder returns, etc.), and the non-financial areas (human capital, governance, operational efficiency, etc.).
What currently drives growth is the quantity and quality of purchases. Multiple large purchases are incorporated in the second half to thicken the resources (inventories) for sales in the next fiscal year. By price band, the ratio of over 500 million yen continues to rise, and projects are scaling up. The Company summarizes its view as “if the current level of purchases is maintained, the targets for the final fiscal year of the medium-term plan are sufficiently achievable.”
Risks are (i) fluctuations in the domestic economy and interest rates (the real estate industry is highly sensitive), (ii) rising interest rates and funding constraints associated with reliance on interest-bearing debt, (iii) the possibility of litigation and disputes arising from rights-adjustment negotiations, and (iv) quarterly volatility (timing of purchases and concentration of large projects). While the Company states its management stance of diversifying funding arrangements, securing on-hand liquidity, and strengthening BCP and governance, sudden changes in the external environment can affect results and finances.
Monitoring indicators are fourfold: (i) the degree of achievement of annual purchases (plan of 22.0 billion yen) and the large-project ratio, (ii) the balance between inventory turnover and gross margin, (iii) operation of dividends and share buybacks with awareness of capital costs, and (iv) consistency of a full-year perspective against quarterly fluctuations. As long as the purchasing pipeline remains thick, momentum in evaluation toward achieving the medium-term plan and correcting PBR is likely to be maintained. Because interest-rate shocks and deterioration in the funding environment can cap valuation upside, we emphasize confirming financial capacity and progress in diversifying funding sources.
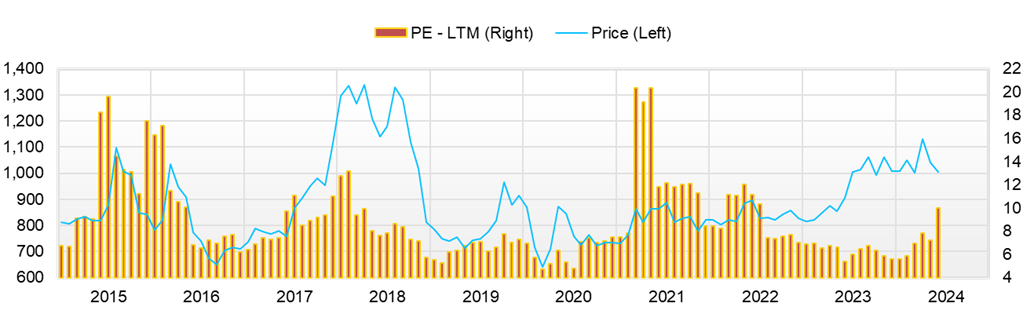
10. Share price trend and equity valuation
Breaking upward, yet PBR remains low; higher trading volume and shareholder measures reinforce momentum.
The Company’s share price range over the most recent 12 months (September 1, 2024–September 1, 2025) was 920–1,349 yen. The year-to-date low in 2025 was 920 yen (April 7) and the high was 1,349 yen (August 22); the closing price on September 1 was 1,266 yen. This represents a decrease of approximately −6% from the high and an increase of about +38% from the April low. Since August, although daily trading volume has mainly been in the 10,000–30,000-share range, on August 8, it swelled to over 80,000 shares, which led to the renewal of the year-to-date high thereafter.
Valuation: forecast PER 9.79x, PBR 0.74x, ROE 8.5%, ROIC 4.5%, β 0.41, and market capitalization 10.8 billion yen. The dividend is 43 yen per year in the Company’s plan, and the implied dividend yield based on the September 1 closing price is approximately 3.4%, which acts as a near-term support factor.
On supply and demand, prices and trading volume broke through key levels in tandem with the timing of Company announcements during April–August (full-year outlook, dividends, and medium-term plan revision), strengthening momentum. PBR remains in the 0.7x range, leaving a gap in which progress in evaluating shareholder measures and the upward revision of the medium-term plan exceed revaluation in terms of multiples. Going forward, (i) continuation of expanded purchases, (ii) maintenance of turnover and gross margin, and (iii) visualization of capital efficiency (ROE range) are seen as keys to making the scenario of PBR of 1.0x more realistic.
As short-term risks, although the share price rose after the financial results and the medium-term plan revision, event-driven swings warrant attention when the stock is in a high-price zone. First, by business characteristics, because the Company designs its plan on the premise of a second-half loss, if a quarterly loss or front-loaded expenses occur in the third or fourth quarter, progress in profit may temporarily appear worse, potentially leading to the closing of positions by short-term players spilling over onto a thin order book. Second, the financial environment. Because the Company’s model is a real estate inventory-turnover model, it is sensitive to the terms of funding for interest-bearing debt. An upswing in domestic interest rates or changes in the lending stance of financial institutions directly affect inventory turnover and capital efficiency. It can become a factor that suppresses valuation due to higher capital costs. The timing of execution of the purchase plan is also a risk. While presenting a revision to 22.0 billion yen per year, large projects require time for negotiation and coordination. If timing mismatches occur, the resources for sales in the next fiscal year will thin out, which tends to lead to deeper profit troughs. Technicals also warrant attention. Interpretations that “all the news is out” or breaks in news flow may destabilize supply and demand, thereby expanding volatility. That said, if the annual 43-yen dividend is maintained, a yield in the 3% range will provide support. Although risks exist, as long as shareholder returns and inventory turnover keep the cycle going, the scenario of PBR correction is unlikely to waver.
11. Equity investment conclusion from the review of results and share price
The prelude to re-rating continues; purchases, capital policy, and ROE targets open up the medium-term outlook.
For the cumulative second quarter of FY12/2025, net sales were 14.5 billion yen (+11.7%), and operating income was 2.24 billion yen (+118.4%), a high progress rate. The Company revised its full-year outlook upward to operating income of 2.02 billion yen, ordinary income of 1.65 billion yen, and net income attributable to owners of parent of 1.10 billion yen, and plans an annual dividend of 43 yen. This effectively indicates a medium-term trend of profit increase, taking into account quarterly fluctuations.
The basis for higher visibility of results is the pipeline. Cumulative purchases for the second quarter of FY12/2025 were 7.968 billion yen (+12.2%). The Company expects multiple large projects in the second half and has also increased the annual purchase plan. The design is to build up resources for sales in the next fiscal year and beyond, positioning the cycle of purchases → inventories → sales as the engine of medium-term growth.
Capital policy also supports momentum. A share buyback was completed from February to May, and in August, the Company disposed of treasury shares as RS for the employee stock ownership plan. By balancing returns with investment in human capital, the Company has clarified its orientation toward capital efficiency.
The goal of the medium-term plan has also been reset in a more ambitious direction. While maintaining the level of purchases and a higher ratio of large projects are prerequisites, based on the current degree of execution, the probability of achievement is rising.
In the short term, attention is required to volatility “by design.” The Company assumes a second-half loss; one-quarter losses in the third/fourth quarters, or front-loaded expenses, can easily worsen the optics. Evaluation should emphasize consistency among turnover, gross margin, and inventory management on a full-year basis. In addition, changes in the funding environment and interest rates can affect inventory turnover and capital efficiency; it is practical to monitor borrowings outstanding alongside operating cash flow.
In sum, a solid earnings model based on the structure (rights adjustment × standardization) is enhanced by the buildup of purchases and consistency of capital policy, and we view the medium-term re-rating scenario as continuing. The current valuation (e.g., PBR 0.74x, PER 9.79x) remains at a discount; if settlement into the ROE range (9–12%) and continuation of the dividend policy can be confirmed, there remains ample room for PBR correction. As an investment stance, while tolerating quarterly fluctuations, it is worth positively considering medium- to long-term inclusion, conditional on progress in KPIs for purchases, turnover, cash flow, and returns.
12. Trends in return on equity (ROE) and the current assessment
From 8.5% toward the 9–12% range; recovery in profitability and capital policy provides support.
The Company’s ROE has trended 3.6% → 6.0% → 9.9% → 10.2% → 8.5% over the most recent five fiscal years. Although 2024 paused due to inventory buildup and more substantial capital, the structural improvement trend is intact. At the end of the second quarter of FY12/2025, the equity ratio was 42.7%, an appropriate leverage level that leaves room for ROE improvement. In addition, the execution of the share buyback (a cumulative 194,900 shares; approximately 200 million yen) and the increase in treasury shares to 487,000 shares at the end of the second quarter of FY12/2025 are tailwinds for capital efficiency.
Management maintains a medium-term ROE target of 9–12% and operates with awareness of capital costs consistent with the final-year profit targets (operating income: 2.5 billion yen; ordinary income: 2.0 billion yen). With the current expansion of purchases, lift in gross margin, and agile returns, it is entirely realistic to re-enter the target range in 2026–2027.
Drivers are threefold: (i) profit margin (maintain/improve gross margin with a portfolio centered on Leasehold land), (ii) turnover (do not break the design of stable full-year purchases and sales), and (iii) leverage (raise ROE with optimal capital while avoiding excessive debt dependence). For practical monitoring, we would continuously confirm the balance and turnover of inventories (real estate for sale), the trend in borrowing costs, and the policy on the use of treasury shares. Setting/executing a share buyback program, as well as utilizing RS for the employee stock ownership plan, serve as means to balance human capital and capital efficiency.
The ROE of 8.5% for 2024 is not enough to markedly shift expectations, but it is consistent with the sustained trend. As long as profit growth continues and shareholder measures remain consistent, achieving a double-digit ROE (9–12%) is in sight and is viewed as a step toward PBR correction.
13. Analysis of economic value creation based on ROIC and WACC
ROIC 4.5% > WACC about 2.4%; EVA is positive and sustainable
We estimate the Company’s capital cost from the bottom up. For the cost of equity using CAPM, with the risk-free rate at the 10-year JGB = 1.6%, Japan’s ERP = 5.27%, and β = 0.41, CoE = 1.6% + 0.41 × 5.27% = approximately 3.76%.
For the cost of debt, we weight the average rates disclosed in the securities report (short-term: 1.800%, long-term due within one year: 2.111%, long-term: 1.657%) by fiscal period-end balances to obtain approximately 1.83% (pre-tax). With the statutory effective tax rate of 30.6%, we set the after-tax CoD = approximately 1.27%.
For capital structure, we use, at the end of the second quarter of FY12/2025, interest-bearing debt of 16.379 billion yen and net assets of 13.779 billion yen (D/V ≒ 0.54, E/V ≒ 0.46). This yields WACC ≒ E/V × CoE (about 0.46 × 3.76%) + D/V × after-tax CoD (about 0.54 × 1.27%) = about 2.4%. Using market-value weights (market capitalization 10.8 billion yen; debt about 16.4 billion yen) lowers E/V somewhat and moves WACC slightly lower.
With ROIC = 4.5% as a benchmark, the spread (ROIC − WACC) is approximately +2.1 percentage points. In other words, EVA is in positive territory, indicating that the business is generating returns above its capital cost. As of the second quarter of FY12/2025, decreases in interest-bearing debt, resulting from increased sales and inventory compression, also help suppress the WACC. While the continued discount at PBR in the 0.7x range reflects short-term volatility and a liquidity premium associated with small size, the persistence of a positive spread provides the theoretical basis for PBR correction.
In terms of sensitivity, even if the 10-year JGB were to rise toward around 2% and borrowing rates were lifted by about 50–70 bps, WACC would remain roughly in the 2.8–3% range, and the spread would still be positive against the current ROIC (4.5%) (assuming constant mix and tax rate). However, if higher interest rates were prolonged and refinancing of the debt mix progressed, the pace of increase in WACC through a higher after-tax CoD would accelerate; therefore, ROIC needs to move higher through inventory turnover and maintenance of gross margin.
As long as the relationship ROIC > WACC is maintained during the medium-term plan period, EVA creation will continue. The keys to its sustainability are (i) execution and turnover of the 22.0 billion yen purchase plan, (ii) securing gross margin on large projects, and (iii) optimal leverage management through consistency in capital policy (treasury shares and dividends). Stability of the spread can underpin re-rating (toward PBR of 1.0x).
14. Corporate value creation from the viewpoint of free cash flow and capital allocation
Thickening the cycle of inventory compression → operating CF generation → returns
Cash generation in the second quarter of FY12/2025 was favorable. Operating cash flow was a positive 3.391 billion yen. The main factors were interim income before income taxes of 2.076 billion yen and 1.898 billion yen in proceeds from a decrease in inventories (real estate for sale), with inventory turnover directly translating into monetization.
Investing cash flow was −163 million yen (main factor: 202 million yen for acquisition of property, plant, and equipment), and financing cash flow was −2.533 billion yen (repayments of long-term borrowings of 3.839 billion yen > borrowings of 2.087 billion yen), indicating a repayment-first approach. Cash and cash equivalents at period-end increased to 5.061 billion yen.
On the inventory side, real estate for sale decreased from 25.333 billion yen to 23.422 billion yen (−1.911 billion yen). Cash and deposits increased by 716 million yen, indicating that inventory compression contributed to the improvement in the cash position.
Free cash flow (conveniently defined as operating CF − investment in property, plant, and equipment) is estimated at approximately 3.189 billion yen (= 3.391 − 0.202), indicating strengthened internal generation capacity for purchase funds from own resources. While this is an indicative figure based on defined assumptions, it reflects improvement in the inventory cycle.
Capital allocation is labeled as “optimization,” and the Company clearly states that it will strengthen shareholder returns. The cumulative share buyback of 199.9 million yen (194,900 shares) in February–May was completed. In August, 17,800 treasury shares were disposed of as RS for the employee stock ownership plan (payment completed). The stance is clear in balancing human capital with capital efficiency.
The dividend policy is to increase to 43 yen per year. The basic policy is stated as “continuous and stable dividends, together with proactive returns in line with results.”
Investors should confirm as KPIs (i) the trade-off between inventory balance and operating CF, (ii) the sustainability of free CF (inventory turnover × gross margin), (iii) consistency of the returns mix (dividends + treasury shares + RS), and (iv) progress in refinancing/repayment of borrowings. The current inventory compression and repayment-first financing CF, and the agile operation of dividend increases and treasury shares, are consistent with the medium-term plan’s optimization of cash allocation.
15. Future potential of shareholder returns and assessment of results to date
Progressive dividends + agile treasury shares lay the groundwork for PBR correction.
The Company’s return policy is “continuous and stable dividends + proactive returns in line with results.” While allocating retained earnings to strengthening the business foundation, the Company clearly states that maximizing shareholder interests is positioned as a management issue. As a result, it executed 41 yen per year in 2024 (interim: 16 yen/year-end: 25 yen), and for 2025, it set a plan to increase to 43 yen per year (interim: 17 yen/year-end: 26 yen). Management indicates the “outlook for the twelfth consecutive year of dividend increases,” reflecting a commitment to progressivity.
Regarding treasury shares, under the program for February–May 2025, the Company completed market purchases of 194,900 shares for 199.96 million yen. In addition, the number of treasury shares at the end of the second quarter of FY12/2025 increased to 487.3 thousand shares (309.8 thousand shares at the end of the previous fiscal year). Meanwhile, in August 8, it disposed of 17,800 shares as RS for the employee stock ownership plan (payment completed; disposal price 1,112 yen; total 19.79 million yen). By combining buybacks with the use of RS, the Company is simultaneously tightening the supply–demand balance and strengthening its human capital.
As for future potential, three points are realistic: (i) maintaining progressive dividends (linked to the full-year profit-increase plan), (ii) agile operation of treasury shares (considering progress, share price level, and capital efficiency), and (iii) continued use of RS (broadening the base of employee shareholdings). In its medium-term plan, the Company lists as financial strategy “identification and optimization of capital costs/optimization of cash allocation / strengthening shareholder returns,” and together with improved cash-generation capacity, there is room to continue and strengthen the twin pillars of dividends and treasury shares.
From an evaluation perspective, while a discount in the PBR 0.7x range persists, the successive execution of dividend increases and buybacks tends to act as a catalyst for re-rating. Because quarterly volatility and changes in the interest-rate environment can impair the optics of near-term EPS and turnover, we would keep close watch on the following as KPIs: (i) maintaining execution of the dividend (43 yen per year), (ii) continued use of treasury shares, (iii) the trend in remaining treasury shares and the free-float ratio, and (iv) tracking of the ROE range. The current policy and results are consistent with the capital-efficiency orientation of the medium-term plan and have a certain persuasiveness as groundwork for PBR correction (toward 1.0x).
16. Corporate value evaluation (DCF, PER/PBR analysis)
The implication of PBR 0.74x is ROE = 5–6%; DCF has room to rise depending on assumptions
The Company’s current valuation is PER 9.79x / PBR 0.74x / market capitalization 10.8 billion yen. The Company plans to achieve operating income of 2.02 billion yen, ordinary income of 1.65 billion yen, and net income of 1.10 billion yen. The year-end dividend is 26 yen (annual 43 yen). ROE is 8.5% and ROIC is 4.5% at present levels.
We first back-calculate the implication of PBR. Using the approximate Gordon-type formula P/B ≒ (ROE − g) / (r − g), and setting g = 1% and the cost of equity r = 7%* in view of a small-cap discount, P/B = 0.74 implies an ROE of about 5.4%. This is below the actual 8.5% and the Company’s target of 9–12%. The current discount can be interpreted as a “discount to the sustainability of ROE.” If settlement into the target range can be confirmed, there is theoretically room for correction of PBR toward 1.0x.
*A conservative hurdle assumption for the valuation model, including small-cap and liquidity discounts.
Next, we indicate a range using a simplified DCF (assumptions stated and calculated). Applying the effective tax rate of 30.6% to the operating income of 2.02 billion yen yields a NOPAT ≒ of approximately 1.40 billion yen. With a ROIC of 4.5% and a growth rate of g = 1%, the required reinvestment rate is approximately 44% (= g / ROIC); thus, the FCFF basis is approximately 780 million yen. We estimate the WACC at approximately 2.4% based on the mid-period balance sheet (interest-bearing debt: 16.379 billion yen; net assets: 13.779 billion yen) and borrowing average rates/tax rate (we also present alternative cases that incorporate a small-cap premium). Net interest-bearing debt is 11.3 billion yen after subtracting cash equivalents of 5.061 billion yen. The terminal value is calculated by (FCFF one year ahead × (1 + g)) / (WACC-g).
- Case A (WACC 2.4%, g 1%): enterprise value about 56.3 billion yen → equity value about 45.0 billion yen (after net debt).
- Case B (WACC 4.0%, g 1%): enterprise value about 26.3 billion yen → equity value about 14.9 billion yen.
- Case C (WACC 5.5%, g 1%): enterprise value about 17.5 billion yen → equity value about 6.2 billion yen.
The current market capitalization of 10.8 billion yen corresponds to the middle to lower end of the range when a WACC of 4.0–5.5% (incorporating small-cap risk) is applied. In other words, the market is assuming a higher capital cost and/or discounting the sustainability of ROE/FCF.
Multiples remain low, and under conservative WACC assumptions, the DCF still leaves room to rise. What investors should confirm are (i) settlement into ROE of 9–12%, (ii) execution of 22.0 billion yen in purchases → inventory turnover → sustained FCF, and (iii) continuation of the 43-yen dividend and operation of treasury shares. If these proceed, the probability of PBR correction (toward ~1.0x) will increase.
17. Comparative multiple analysis with peers
PBR is in the 0.7x range versus over 1.0x for peers; differences in ROE, scale, and business model are discount factors
KATITAS (8919, Prime), which renovates existing detached houses, most recently trades at approximately PER 19x, PBR of about 4.52x, and an actual ROE exceeding 22.2%, combining high profitability and high valuation. Sun Frontier Fudousan (8934, Prime), which also operates renovation and hotel businesses, has a PER of about 7.23x, PBR of about 1.06x, and ROE of about 14.9%. Star Mica Holdings (2975, Prime), which renovates condominium units, has a PER of about 10.61x, a PBR of about 1.35x, and an ROE of about 12.1%. In all cases, PBR over 1.0x is the baseline.
Sansei Landic is at PBR in the 0.7x range, PER in the 9x range, and actual ROE in the 8% range. The Company’s PBR discount can be interpreted as mainly driven by three factors: (i) relatively lower ROE levels, (ii) a liquidity premium stemming from small market capitalization and trading volume, and (iii) high project-specificity inherent in a “rights adjustment × purchase-led” model that results in quarterly volatility. By contrast, at KATITAS, standardized operations and high turnover are directly linked to high ROE and PBR. At Sun Frontier Fudousan and Star Mica HD, diversification and the coexistence of rental income contribute to smoothing profits.
That said, the evaluation gap is reversible. If stabilization into the ROE range of 9–12% stated in the medium-term plan, achieving the 22.0 billion yen purchase plan with maintained turnover, and continuing the 43-yen dividend, as well as agile operation of treasury shares, can be confirmed, PBR will likely correct toward 1.0x more readily. In particular, if profit can be smoothed by securing a gross margin centered on Leasehold land and controlling the ratio of large projects, the rationale for approaching over 1.0x the book, in line with peers, will be stronger. The current 0.7x range heavily reflects a discount to the sustainability of ROE and a liquidity discount, and there remains plenty of scope for re-rating depending on KPI progress.
| Company name | Market capitalization (billion yen) |
PER (CE) |
PBR (Actual) |
ROE (Actual) |
Dividend Yield (CE) |
| Sansei Landic (3277) | 10.8 | 9.79 | 0.74 | 8.5% | Approx. 3.3% |
| KATITAS(8919) | 211.3 | 19.04x | 4.52x | 22.2 % | 2.65% |
| Sun Frontier Fudousan(8934) | 112.1 | 7.23x | 1.06x | 14.9% | 3.34% |
| Star Mica Holdings (2975) | 39.3 | 10.61x | 1.35x | 12.1% | 2.65% |
Key stock price data
Key financial data
| Unit: million yen | 2020/12 | 2021/12 | 2022/12 | 2023/12 | 2024/12 | 2025/12 CE |
| Sales | 17,775 | 16,836 | 15,533 | 23,269 | 25,620 | 24,000 |
| EBIT (Operating Income) | 847 | 1,118 | 1,469 | 2,155 | 1,883 | 2,020 |
| Pretax Income | 712 | 1,004 | 1,270 | 1,756 | 1,585 | 1,650 |
| Net Profit Attributable to Owner of Parent | 358 | 609 | 1,060 | 1,183 | 1,051 | 1,100 |
| Cash & Short-Term Investments | 4,330 | 5,361 | 3,837 | 3,770 | 5,013 | |
| Total assets | 20,071 | 20,051 | 28,977 | 30,976 | 33,107 | |
| Total Debt | 8,342 | 8,108 | 16,399 | 16,879 | 18,506 | |
| Net Debt | 4,012 | 2,747 | 12,562 | 13,109 | 13,493 | |
| Total liabilities | 10,004 | 9,749 | 17,921 | 18,899 | 20,349 | |
| Total Shareholders’ Equity | 10,067 | 10,302 | 11,056 | 12,077 | 12,759 | |
| Net Operating Cash Flow | -917 | 1,705 | -9,268 | -12 | 1,143 | |
| Capital Expenditure | 21 | 40 | 28 | 304 | 138 | |
| Net Investing Cash Flow | -288 | -51 | -267 | -766 | -715 | |
| Net Financing Cash Flow | 953 | -608 | 7,971 | 303 | 1,223 | |
| Free Cash Flow | -923 | 1,682 | -9,282 | -291 | 1,049 | |
| ROA (%) | 1.82 | 3.04 | 4.32 | 3.95 | 3.28 | |
| ROE (%) | 3.58 | 5.98 | 9.93 | 10.23 | 8.46 | |
| EPS (Yen) | 42.3 | 73.6 | 129.6 | 143.8 | 127.2 | 135.1 |
| BPS (Yen) | 1,192.9 | 1,249.5 | 1,356.8 | 1,465.5 | 1,541.8 | |
| Dividend per Share (Yen) | 25.00 | 26.00 | 28.00 | 33.00 | 41.00 | 43.00 |
| Shares Outstanding (Million Shares) | 8.47 | 8.47 | 8.49 | 8.58 | 8.58 |
Source: Omega Investment from company data, rounded to the nearest whole number.
Share price
Financial data (quarterly basis)
| Unit: million yen | 2023/12 | 2024/12 | 2025/12 | ||||||
| 2Q | 3Q | 4Q | 1Q | 2Q | 3Q | 4Q | 1Q | 2Q | |
| (Income Statement) | |||||||||
| Sales | 5,494 | 7,485 | 3,804 | 7,207 | 5,785 | 8,358 | 4,270 | 8,848 | 5,664 |
| Year-on-year | 47.6% | 141.8% | -11.0% | 11.1% | 5.3% | 11.7% | 12.3% | 22.8% | -2.1% |
| Cost of Goods Sold (COGS) | 3,858 | 5,681 | 3,067 | 5,521 | 4,228 | 6,448 | 3,122 | 5,842 | 4,062 |
| Gross Income | 1,635 | 1,803 | 737 | 1,686 | 1,558 | 1,910 | 1,149 | 3,006 | 1,602 |
| Gross Income Margin | 29.8% | 24.1% | 19.4% | 23.4% | 26.9% | 22.9% | 26.9% | 34.0% | 28.3% |
| SG&A Expense | 1,097 | 1,128 | 914 | 1,115 | 1,102 | 1,125 | 1,077 | 1,200 | 1,168 |
| EBIT (Operating Income) | 539 | 676 | -177 | 571 | 455 | 785 | 72 | 1,806 | 434 |
| Year-on-year | 15.6% | 135.5% | -165.8% | -49.0% | -15.5% | 16.2% | -140.5% | 216.6% | -4.6% |
| Operating Income Margin | 9.8% | 9.0% | -4.7% | 7.9% | 7.9% | 9.4% | 1.7% | 20.4% | 7.7% |
| EBITDA | 559 | 692 | -161 | 587 | 476 | 806 | 92 | 1,827 | 460 |
| Pretax Income | 378 | 587 | -254 | 493 | 369 | 728 | -4 | 1,728 | 349 |
| Consolidated Net Income | 256 | 387 | -144 | 328 | 245 | 485 | -7 | 1,175 | 236 |
| Minority Interest | 0 | 0 | 0 | 0 | 0 | 0 | 0 | 0 | 0 |
| Net Income ATOP | 256 | 387 | -144 | 328 | 245 | 485 | -7 | 1,175 | 236 |
| Year-on-year | -24.4% | 97.9% | -195.1% | -52.0% | -4.0% | 25.2% | -94.9% | 258.2% | -4.0% |
| Net Income Margin | 4.7% | 5.2% | -3.8% | 4.6% | 4.2% | 5.8% | -0.2% | 13.3% | 4.2% |
| (Balance Sheet) | |||||||||
| Cash & Short-Term Investments | 4,266 | 5,388 | 3,770 | 4,479 | 4,988 | 4,728 | 5,013 | 5,788 | 5,730 |
| Total assets | 30,777 | 30,632 | 30,976 | 30,487 | 30,561 | 29,940 | 33,107 | 31,353 | 32,250 |
| Total Debt | 16,520 | 16,262 | 16,879 | 16,787 | 16,211 | 15,595 | 18,506 | 15,747 | 16,379 |
| Net Debt | 12,254 | 10,874 | 13,109 | 12,308 | 11,223 | 10,867 | 13,493 | 9,959 | 10,649 |
| Total liabilities | 18,944 | 18,412 | 18,899 | 18,354 | 18,163 | 17,173 | 20,349 | 17,712 | 18,471 |
| Total Shareholders’ Equity | 11,833 | 12,220 | 12,077 | 12,133 | 12,398 | 12,768 | 12,759 | 13,641 | 13,779 |
| (Profitability %) | |||||||||
| ROA | 4.81 | 5.08 | 3.95 | 2.75 | 2.66 | 3.02 | 3.28 | 6.14 | 6.01 |
| ROE | 11.42 | 12.79 | 10.23 | 6.98 | 6.74 | 7.32 | 8.46 | 14.73 | 14.43 |
| (Per-share) Unit: JPY | |||||||||
| EPS | 31.0 | 47.0 | -17.4 | 39.8 | 29.7 | 58.6 | -0.9 | 142.4 | 29.1 |
| BPS | 1,435.9 | 1,482.9 | 1,465.5 | 1,472.3 | 1,501.2 | 1,542.9 | 1,541.8 | 1,665.9 | 1,701.6 |
| Dividend per Share | 0.00 | 0.00 | 33.00 | 0.00 | 16.00 | 0.00 | 25.00 | 0.00 | 17.00 |
| Shares Outstanding(Million shares) | 8.58 | 8.58 | 8.58 | 8.58 | 8.58 | 8.58 | 8.58 | 8.58 | 8.58 |
Source: Omega Investment from company materials
Financial data (full-year basis)
| Unit: million yen | 2014/12 | 2015/12 | 2016/12 | 2017/12 | 2018/12 | 2019/12 | 2020/12 | 2021/12 | 2022/12 | 2023/12 | 2024/12 |
| (Income Statement) | |||||||||||
| Sales | 10,446 | 11,569 | 12,300 | 13,099 | 16,833 | 18,020 | 17,775 | 16,836 | 15,533 | 23,269 | 25,620 |
| Year-on-year | 13.7% | 10.8% | 6.3% | 6.5% | 28.5% | 7.1% | -1.4% | -5.3% | -7.7% | 49.8% | 10.1% |
| Cost of Goods Sold | 7,055 | 7,798 | 8,344 | 8,566 | 12,028 | 12,902 | 13,788 | 12,468 | 10,486 | 16,927 | 19,318 |
| Gross Income | 3,391 | 3,770 | 3,957 | 4,532 | 4,805 | 5,119 | 3,986 | 4,368 | 5,047 | 6,342 | 6,302 |
| Gross Income Margin | 32.5% | 32.6% | 32.2% | 34.6% | 28.5% | 28.4% | 22.4% | 25.9% | 32.5% | 27.3% | 24.6% |
| SG&A Expense | 2,204 | 2,216 | 2,295 | 2,434 | 2,702 | 2,891 | 2,750 | 2,877 | 3,031 | 3,569 | 4,420 |
| EBIT (Operating Income) | 1,187 | 1,300 | 1,446 | 1,762 | 1,766 | 1,861 | 847 | 1,118 | 1,469 | 2,155 | 1,883 |
| Year-on-year | 31.6% | 9.6% | 11.2% | 21.9% | 0.2% | 5.4% | -54.5% | 31.9% | 31.5% | 46.7% | -12.6% |
| Operating Income Margin | 11.4% | 11.2% | 11.8% | 13.5% | 10.5% | 10.3% | 4.8% | 6.6% | 9.5% | 9.3% | 7.3% |
| EBITDA | 1,260 | 1,406 | 1,532 | 1,833 | 1,822 | 1,912 | 896 | 1,161 | 1,517 | 2,236 | 1,962 |
| Pretax Income | 1,044 | 1,196 | 1,329 | 1,672 | 1,539 | 1,759 | 712 | 1,004 | 1,270 | 1,756 | 1,585 |
| Consolidated Net Income | 626 | 724 | 854 | 1,111 | 1,007 | 1,159 | 358 | 609 | 1,060 | 1,183 | 1,051 |
| Minority Interest | 0 | 0 | 0 | 0 | 0 | 0 | 0 | 0 | 0 | 0 | 0 |
| Net Income ATOP | 626 | 724 | 854 | 1,111 | 1,007 | 1,159 | 358 | 609 | 1,060 | 1,183 | 1,051 |
| Year-on-year | 37.5% | 15.6% | 17.9% | 30.2% | -9.4% | 15.1% | -69.1% | 70.5% | 73.9% | 11.6% | -11.2% |
| Net Income Margin | 6.0% | 6.3% | 6.9% | 8.5% | 6.0% | 6.4% | 2.0% | 3.6% | 6.8% | 5.1% | 4.1% |
| (Balance Sheet) | |||||||||||
| Cash & Short-Term Investments | 2,276 | 2,254 | 2,435 | 3,558 | 3,594 | 4,134 | 4,330 | 5,361 | 3,837 | 3,770 | 5,013 |
| Total assets | 8,793 | 11,398 | 10,833 | 16,916 | 16,777 | 19,294 | 20,071 | 20,051 | 28,977 | 30,976 | 33,107 |
| Total Debt | 2,414 | 3,958 | 2,712 | 7,439 | 6,048 | 7,203 | 8,342 | 8,108 | 16,399 | 16,879 | 18,506 |
| Net Debt | 139 | 1,704 | 277 | 3,881 | 2,454 | 3,069 | 4,012 | 2,747 | 12,562 | 13,109 | 13,493 |
| Total liabilities | 3,531 | 5,363 | 3,977 | 8,909 | 7,869 | 9,399 | 10,004 | 9,749 | 17,921 | 18,899 | 20,349 |
| Total Shareholders’ Equity | 5,262 | 6,034 | 6,856 | 8,006 | 8,908 | 9,895 | 10,067 | 10,302 | 11,056 | 12,077 | 12,759 |
| (Cash Flow) | |||||||||||
| Net Operating Cash Flow | 1,761 | -1,451 | 1,611 | -3,666 | 1,617 | -420 | -917 | 1,705 | -9,268 | -12 | 1,143 |
| Capital Expenditure | 91 | 58 | 111 | 57 | 66 | 61 | 21 | 40 | 28 | 304 | 138 |
| Net Investing Cash Flow | -111 | -116 | -184 | 107 | -64 | -71 | -288 | -51 | -267 | -766 | -715 |
| Net Financing Cash Flow | -612 | 1,588 | -1,278 | 4,667 | -1,495 | 984 | 953 | -608 | 7,971 | 303 | 1,223 |
| Free Cash Flow | 1,697 | -1,491 | 1,536 | -3,692 | 1,572 | -446 | -923 | 1,682 | -9,282 | -291 | 1,049 |
| (Profitability %) | |||||||||||
| ROA | 7.07 | 7.17 | 7.68 | 8.01 | 5.98 | 6.42 | 1.82 | 3.04 | 4.32 | 3.95 | 3.28 |
| ROE | 13.72 | 12.82 | 13.24 | 14.96 | 11.90 | 12.32 | 3.58 | 5.98 | 9.93 | 10.23 | 8.46 |
| (Per-share) Unit: JPY | |||||||||||
| EPS | 90.2 | 90.1 | 104.9 | 134.4 | 119.6 | 137.1 | 42.3 | 73.6 | 129.6 | 143.8 | 127.2 |
| BPS | 664.8 | 744.2 | 841.3 | 958.0 | 1,054.5 | 1,170.2 | 1,192.9 | 1,249.5 | 1,356.8 | 1,465.5 | 1,541.8 |
| Dividend per Share | 6.00 | 10.00 | 12.00 | 18.00 | 21.00 | 23.00 | 25.00 | 26.00 | 28.00 | 33.00 | 41.00 |
| Shares Outstanding (Million shares) | 7.91 | 8.11 | 8.15 | 8.35 | 8.45 | 8.46 | 8.47 | 8.47 | 8.49 | 8.58 | 8.58 |
Source: Omega Investment from company materials