2026-03-30
Home
Japanese

Omega Investment Co., Ltd.
TAKARA & COMPANY (Investment report – 1Q update)
| Share price (10/15) | ¥4,100 | Dividend Yield (26/5 CE) | 2.9 % |
| 52weeks high/low | ¥2,577/4,355 | ROE(25/5 act) | 14.1 % |
| Avg Vol (3 month) | 28.0 thou shrs | Operating margin (25/5 act) | 13.6 % |
| Market Cap | ¥53.93 bn | Beta (5Y Monthly) | 0.5 |
| Enterprise Value | ¥33.69 bn | Shares Outstanding | 13.153 mn shrs |
| PER (26/5 CE) | 17.1 X | Listed market | TSE Prime section |
| PBR (25/5 act) | 1.7 X |
| Click here for the PDF version of this page |
| PDF version |
Steady growth compounded by “Disclosure, Language, and AI.”1Q FY2026/5: re-rating potential on sizable net cash and low beta.
Conclusion
Solid start in 1Q FY2026/5. Overweight for the medium term; in the short term, buy event-driven dips.
For TAKARA & COMPANY LTD. (“TAKARA & COMPANY”), we think it is reasonable to adopt an Overweight stance for the medium term, raising the portfolio weight in stages, while in the short term employing a strategy of buying on weakness as events such as clarification of capital policy and numerical disclosures on new services approach. The rationale is: a year-on-year increase in both revenue and profit in 1Q FY2026/5; ample financial capacity with net cash of 18.937 billion yen; low volatility with a beta of 0.54; and early signs of demand led by technological innovation in systems for increasingly diversified and sophisticated disclosure, as well as AI translation. Valuation stands at a forward PER of 17.1x, a trailing PBR of 1.7x, ROE of 14.07%, and ROIC of 14.03%; the key focus is the sustainability of capital-efficiency metrics.
The first pillar supporting this conclusion is consolidated performance in 1Q FY2026/5: net sales of 9.086 billion yen (YoY +8.6%), operating income of 1.712 billion yen (YoY +3.7%), ordinary income of 1.789 billion yen (YoY +4.8%), and net profit attributable to owners of the parent of 1.193 billion yen (YoY +4.1%), showing steady top- and bottom-line growth centered on core businesses. Earnings per share for the quarter were 92.33 yen. Second, the “AI File Translation Service” from Takara Printing (a TAKARA & COMPANY group company) × ErudAite is positioned to shorten translation lead times for financial materials to under one-tenth of conventional levels, thereby enhancing customer value by accelerating English-language disclosure. Third, the launch of the practitioner-focused owned media “TAKARA Compass” can broaden lead generation by expanding touchpoints around adjacent themes such as integrated reporting, IPO, and web. In addition, the change in major shareholder in September 2025—MIRI Capital Management LLC becoming the largest shareholder with an 11.02% stake—suggests rising pressure to improve capital efficiency through engagement. By contrast, the disposal of treasury shares that same month (2,300 restricted shares) appears primarily as a short-term incentive, and its impact as a capital policy is limited.
The company’s strength lies in its specialized, end-to-end offering that bundles “disclosure support” and “language services” atop a strong customer base. By adding interpreting/translation capabilities and accelerating AI translation to its know-how in producing and operating statutory and voluntary disclosures, the company is well placed to capture demand for English-language IR and integrated reporting and to compound delivered value. The AI-translation model combines speed with expert post-editing to secure quality, and planned group-wide sales collaboration lays the groundwork for medium-term expansion in added value.
In our previous Basic Report, we posited the hypotheses that “rising pressure to improve capital efficiency could act as a catalyst” and that “the balance between financial stability and room for improvement underpins the medium- to long-term investment appeal.” This assessment has, in fact, materialized in the form of a change in the largest shareholder, and we think it is appropriate insofar as external governance pressure has clearly intensified.
By contrast, with respect to progress on capital policy, what we have confirmed thus far is limited to the grant of 2,300 restricted shares to directors and directors of subsidiaries. Given that only a short time has elapsed since the prior report, and it is still early for M&A to surface, it is prudent to adopt a somewhat cautious view on the likelihood of a large-scale share buyback. In addition, while lead generation initiatives anchored in AI translation and media have begun, quantitative disclosure of contributions to revenue and orders remains limited at this stage. It has not yet provided the decisive trigger needed to lift the equity market’s perception further.
Taking the above into account, the company is in a transition phase, layering digital/AI capabilities onto its high-margin core businesses to sharpen visibility. Stable growth in 1Q FY2026/5, a sizable net-cash position, and the presence of outside shareholders underpin the medium-term investment case. In the near term, identifiable events—clarification of capital-allocation policy, disclosure of KPIs for the AI-translation initiative, and quantification of cross-sell progress—should serve as share-price catalysts. Accordingly, an Overweight stance for the medium term is warranted, while in the short term, a pragmatic approach is to buy event-driven pullbacks.
◇ 1Q FY2026/5 Financial Results Highlights: Solid start with increased revenue and profit, contributed by the expansion of disclosure support and consolidation effects, while profit margin slightly slowed due to cost increases.
The company’s 1Q FY2026/5 ended with solid increases in revenue and profit, with net sales of 9.086 billion yen (+8.6% YoY), operating profit of 1.712 billion yen (YoY +3.7%), ordinary income of 1.789 billion yen (+4.8% YoY), and quarterly profit attributable to owners of parent of 1.193 billion yen (YoY +4.1%). Quarterly net income per share is 92.33 yen. The driving force was the Disclosure-related business, where, in addition to the growth of convocation notices for general meetings of shareholders and integrated reports, the consolidation of J-Trust Co., Ltd. as a subsidiary contributed, expanding the segment’s net sales to 6.873 billion yen (YoY +9.3%) and segment profit to 1.503 billion yen (YoY +4.4%). By product, Financial Instruments and Exchange Act-related was 2.888 billion yen (YoY +8.5%), Companies Act-related was 1.896 billion yen (YoY +14.3%), IR-related was 1.582 billion yen (YoY +5.8%), and Others was 507 million yen (YoY +7.9%), with all four major categories increasing. The Interpreting & Translation business also grew, with net sales of 2.212 billion yen (YoY +6.2%), backed by the recovery in demand for large-scale events, seminars, and internal meetings for interpreting, and an upside in sales related to AI interpreting.
In terms of profitability, the operating margin declined slightly to approximately 18.8% (approximately 19.7% in the previous year). The factor was an increase in SG&A expenses, with increases in salaries and allowances, depreciation, and amortization of goodwill confirmed, and total SG&A expenses expanded to 2.314 billion yen (2.054 billion yen in the previous year). On the other hand, an increase in non-operating income, primarily due to higher dividends received and interest received, led to an increase in profit at the ordinary income level (dividends received: 65.28 million yen, interest received: 7.82 million yen). The occurrence of a foreign exchange loss of 6.65 million yen was a headwind, but it was absorbed on a net basis. Quarterly comprehensive income increased from the previous year to 1.332 billion yen. As for seasonality, the trend of sales being concentrated in the first and fourth quarters was maintained again this time. The financial position is highly sound, with total assets of 38.451 billion yen and an equity ratio of 79.2%, and the equity ratio increased from the end of the previous fiscal year.
The top line was strong due to the expansion of sales and consolidation effects, and an increase in dividends and interest also supported profits. On the other hand, the profit margin slowed slightly due to an increase in SG&A expenses and the amortization of goodwill. For the next quarter and beyond, cost absorption, unit price improvement, and numerical disclosure of AI interpreting and translation will be the keys to evaluation.
◇ Segment Analysis: The two pillars (Disclosure Support / Interpreting & Translation) continued to expand in the 1Q FY2026/5, with disclosure support maintaining its position as the core of sales and profit.
The company’s reportable segments are the “Disclosure-related business” and the “Interpreting & Translation business.” In the 1Q FY2026/5, the sales for each segment were 6.873 billion yen for the former and 2.212 billion yen for the latter, totaling 9.086 billion yen. The composition ratio was approximately 75.6% / 24.4%, and segment profits were 1.503 billion yen and 169 million yen, respectively, with disclosure support dominating both sales and profit.
The backbone of the services consists of the Disclosure-related business, which handles the production and operation of statutory disclosures such as financial results summaries, securities reports, and convocation notices, and voluntary disclosures such as integrated reports and IR/ESG materials, and the Interpreting & Translation business, which provides interpreting for international conferences and events, translation of documents, and extends to localization and transcreation. The customer base for the former is mainly domestic listed companies, while the latter mainly provides services in Japan and the United States. The group operates these two businesses with a holding company structure consisting of the company and 20 subsidiaries, for a total of 21 companies.
The product breakdown for the 1Q FY2026/5 was 2.888 billion yen for Financial Instruments and Exchange Act-related, 1.896 billion yen for Companies Act-related, 1.582 billion yen for IR-related, 507 million yen for Others, and 2.212 billion yen for Interpreting & Translation. The sum of these is the 9.086 billion yen in sales to external customers, and together with the segment profits mentioned above, it reveals the high profit contribution of disclosure support (segment profit margin of approximately 21.9%) and the steady growth of interpreting and translation (approximately 7.6%).
The implication as of this quarter is that in disclosure support, the three main areas of the Financial Instruments and Exchange Act, the Companies Act, and IR are growing in a balanced manner, driving the overall profitability with quantitative stability and high margins, while in interpreting and translation, the structure of pushing up sales through a broader scope including high-value-added areas such as localization continues. The complementary nature of the two pillars also functions during the period, and the fact that it encompasses cross-selling potential in areas such as English-language disclosure and IR support for overseas investors is a strength of this segment structure.
◇ FY2026/5 Earnings Forecast: Full-year forecast remains unchanged at 33.0 billion yen in net sales, 4.4 billion yen in operating profit, and 3.1 billion yen in net income; 1Q progress is strong at about 40% for profit.
The full-year forecast is consistent with the final target of the “Medium-Term Management Plan 2026,” and the first-quarter progress is substantial at just under 40% for operating and net income.
The full-year forecast remains unchanged, with net sales of 33.0 billion yen, operating profit of 4.4 billion yen, profit attributable to owners of parent of 3.1 billion yen, and net income per share of 240.06 yen. This level is consistent with the final year targets of the “Medium-Term Management Plan 2026” revised by the company in July 2025 (net sales of 33.0 billion yen, operating profit of 4.4 billion yen, net income of 3.1 billion yen, operating margin of 13.3%, ROE of 10.0%), and the consistency of the indicators can be confirmed. First-quarter results were net sales of 9.086 billion yen, operating profit of 1.712 billion yen, and quarterly profit attributable to the owners of the parent of 1.193 billion yen. Progress toward the full-year plan is strong, at approximately 27.5%, 38.9%, and 38.5%, respectively. The dividend is planned to continue at 120 yen per year (60 yen interim, 60 yen year-end), with no change.
There are two growth drivers. The first is the strengthening of the WizLabo group and expansion of the customer base in response to the increasing sophistication of disclosure demand, which the company attributes to driving revenue growth in the previous fiscal year. In addition, tailwinds from the system side, such as the sophistication of EDINET, IFRS adoption, and the mandatory simultaneous disclosure in Japanese and English, will be medium-term follow-up factors. The second is the launch of AI file translation by Takara Printing × ErudAite, which aims to reduce delivery time to one-tenth or less of the conventional time, and has the potential to meet the needs for English-language IR disclosure. The initiative of acquiring and educating prospective customers with “Takara Compass” also works in a complementary manner.
On the other hand, the risks include the obsolescence of knowledge due to the advancement of AI, as well as fluctuations in non-recurring projects resulting from a decrease in the number of IPOs and financing deals. In response, the company has clarified its policy of maintaining a competitive advantage by promptly incorporating AI technology and expanding the functions of its products. On the capital policy front, there was the use of treasury stock for compensation and a change in the top shareholder, but at this point, there is no particular explanation of the impact on the earnings forecast.
The profit progress in the first quarter is high at about 40% against the full-year plan, and the probability of achieving the plan is considered good at this point. If demand from system compliance and new products, such as AI translation, contributes, there is also potential for an upside, but we want to keep a close watch on the fact that if the weakness in the IPO market is prolonged, it will be a source of volatility for non-recurring projects.
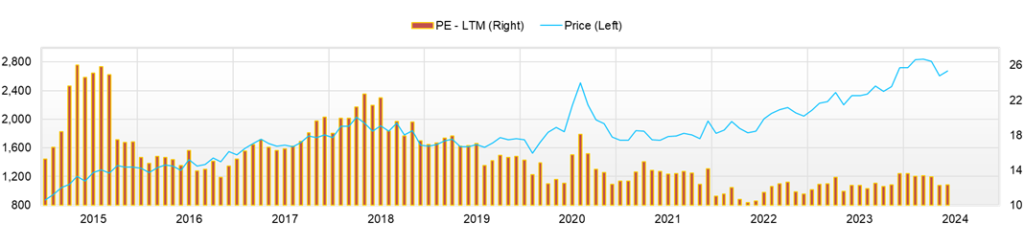
◇ Stock Price Trend and Points to Watch: Testing the YTD high of 4,355 yen (29 Sept). If accompanied by events, an upside breakout; in normal conditions, the target dips in the 4,000-yen range.
From the end of August to the end of September, the share price rose +7.2% from 3,955 yen to 4,240 yen, marking a year-to-date high of 4,355 yen on 29 September and closing that day at 4,240 yen. Trading volume increased to 69.9 thousand shares, indicating a test of the highs with momentum. On 1 September, the stock closed at 4,055 yen (+2.53% day-on-day), on 4 September at 3,960 yen (−1.37%), and on 26 September at 4,250 yen (+2.04%), showing straightforward moves when newsflow coincides with events. Valuation stands at a forward PER of 17.1x, a trailing PBR of 1.7x, a beta of 0.54, a market cap of 54.7 billion yen, and net cash of 18.937 billion yen. If earnings plans continue to be met and capital policy becomes more concrete, investors will be inclined to see room for re-rating on the earnings side (PER).
As for the correlation between news and share price: (i) after the launch of “TAKARA Compass” (announced 1 Sept), the close was 4,055 yen (+2.53% day-on-day), a positive reaction; (ii) the disposal of treasury shares to directors, etc. (announced 4 Sept; 2,300 shares at 3,830 yen) produced a modest decline the next business day (3,960 yen, −1.37%), a neutral reaction; and (iii) disclosure of a change in the largest shareholder (MIRI Capital Management LLC, voting rights 11.02%) on 26 Sept saw a buying response, closing at 4,250 yen (+2.04%). In addition, the start of the AI File Translation Service (announced 8 Aug) broadens the groundwork for evaluation as a structural theme, faster English-language disclosure.
Technically, the 4,000-yen area has functioned as support (low of 3,960 yen on 4 Sept → close of 3,995 yen on 5 Sept → close of 4,020 yen on 8 Sept, a rebound). The immediate resistance band is 4,250–4,355 yen; a breakout accompanied by volume would signal further upside potential. The market’s view can be summarized as pricing in defensive attributes—low beta and sizable net cash, while layering expectations on growth investments (AI translation, owned media) and governance pressure (change in the largest shareholder).
Conditions for an Overweight view to gain traction are: (i) clarification of capital policy (share buybacks, optimal capital structure policy); (ii) disclosure of KPIs and earnings contribution for AI translation/English-language disclosure support; (iii) quantitative expansion in orders/ARPA; and (iv) an upward revision at first-half results. As for entry timing, in phases when news and volume arrive together, follow an upside breakout; in normal conditions, make incremental additions on dips into the 4,000–4,100 yen range.
An event-driven tone continues to prevail. Most recently, as selling pressure around the resistance band is absorbed, any expansion in volume alongside new developments should support a re-rating. In normal conditions, using dips around 4,000 yen while waiting for the next quantitative disclosures (capital policy / AI-related KPIs / results) is a pragmatic stance.
Company profile
◇ Steady growth on the two axes of “Disclosure, Language,” with sales composition in the 1Q FY2026/5 at approximately 75% for disclosure and 25% for interpreting and translation.
TAKARA & COMPANY LTD. is a holding company listed on the Prime Market of the Tokyo Stock Exchange, with its two pillars being disclosure support for listed companies and interpreting and translation. The company’s origins date back to its founding in 1952, but it was established in April 1960. The number of consolidated employees is 1,245 (as of May 31, 2025), with a structure of 886 in the Disclosure-related business, 318 in the Interpreting & Translation business, and 41 in the holding company.
The business model consists of two segments: (1) the Disclosure-related business, which is responsible for the creation and operation of statutory disclosure documents (securities reports, convocation notices, etc.) based on the Financial Instruments and Exchange Act and the Companies Act, and voluntary disclosures (integrated reports, IR/ESG), and (2) the Interpreting & Translation business, which provides interpreting for conferences and events, and translation and localization of documents. The group operates in a holding company format, with Takara Printing Co., Ltd. and Simul International, Inc. as its major subsidiaries, accounting for over 10% of sales. This establishes a complementary relationship between the “disclosure support production system” and “language services,” and has the industrial characteristic of being able to cover a wide range of needs, including English-language disclosure and support for overseas IR for client companies.
Key financial data
| Unit: million yen | 2021 | 2022 | 2023 | 2024 | 2025 | 2026 CE |
| Sales | 24,777 | 25,318 | 27,568 | 29,278 | 29,679 | 33,000 |
| EBIT (operating profit) | 2,707 | 3,561 | 3,812 | 4,232 | 4,049 | 4,400 |
| Pretax Income | 2,933 | 3,630 | 4,010 | 4,454 | 6,018 | |
| Net Profit Attributable to Owner of Parent | 1,640 | 2,250 | 2,596 | 3,014 | 4,076 | 3,100 |
| Cash & Short-Term Investments | 9,745 | 10,296 | 13,139 | 14,641 | 19,146 | |
| Total assets | 30,972 | 30,924 | 33,444 | 36,195 | 40,058 | |
| Total Debt | 702 | 441 | 367 | 107 | 209 | |
| Net Debt | -9,042 | -9,856 | -12,773 | -14,534 | -18,937 | |
| Total liabilities | 8,504 | 7,560 | 8,361 | 8,194 | 9,331 | |
| Total Shareholders’ Equity | 21,920 | 23,069 | 24,763 | 27,645 | 30,335 | |
| Net Operating Cash Flow | 2,569 | 2,802 | 4,794 | 3,412 | 4,391 | |
| Capital Expenditure | 1,183 | 945 | 824 | 1,052 | 957 | |
| Net Investing Cash Flow | -1,395 | -957 | -763 | -889 | 1,248 | |
| Net Financing Cash Flow | 1,193 | -1,234 | -1,192 | -1,371 | -1,127 | |
| Free Cash Flow | 2,486 | 2,734 | 4,608 | 2,860 | 4,083 | |
| ROA (%) | 5.71 | 7.27 | 8.06 | 8.66 | 10.69 | |
| ROE (%) | 8.63 | 10.00 | 10.85 | 11.50 | 14.06 | |
| EPS (Yen) | 130.0 | 171.3 | 197.7 | 231.8 | 314.0 | 240.1 |
| BPS (Yen) | 1,672.2 | 1,754.8 | 1,895.9 | 2,130.2 | 2,337.1 | |
| Dividend per Share (Yen) | 54.00 | 58.00 | 70.00 | 80.00 | 120.00 | 120.00 |
| Shares Outstanding (Million shares) | 13.15 | 13.15 | 13.15 | 13.15 | 13.15 |
Source: Omega Investment from company data, rounded to the nearest whole number.
Share price
Key stock price data
Financial data (quarterly basis)
| Unit: million yen | 2024/5 | 2025/5 | 2026/5 | ||||||
| 1Q | 2Q | 3Q | 4Q | 1Q | 2Q | 3Q | 4Q | 1Q | |
| (Income Statement) | |||||||||
| Sales | 8,419 | 6,585 | 5,857 | 8,418 | 8,370 | 6,507 | 6,163 | 8,639 | 9,086 |
| Year-on-year | 1.2% | 10.1% | 9.3% | 6.4% | -0.6% | -1.2% | 5.2% | 2.6% | 8.6% |
| Cost of Goods Sold (COGS) | 4,744 | 4,092 | 3,773 | 4,933 | 4,785 | 4,117 | 3,842 | 4,809 | 5,222 |
| Gross Income | 3,675 | 2,493 | 2,084 | 3,485 | 3,586 | 2,389 | 2,321 | 3,829 | 3,865 |
| Gross Income Margin | 43.7% | 37.9% | 35.6% | 41.4% | 42.8% | 36.7% | 37.7% | 44.3% | 42.5% |
| SG&A Expense | 1,777 | 1,778 | 1,710 | 1,989 | 1,856 | 1,894 | 1,908 | 2,177 | 2,072 |
| EBIT (operating profit) | 1,833 | 671 | 310 | 1,418 | 1,652 | 448 | 370 | 1,579 | 1,712 |
| Year-on-year | 1.6% | 67.2% | -6.6% | 11.2% | -9.9% | -33.2% | 19.4% | 11.4% | 3.7% |
| Operating profit Margin | 21.8% | 10.2% | 5.3% | 16.8% | 19.7% | 6.9% | 6.0% | 18.3% | 18.8% |
| EBITDA | 2,136 | 988 | 622 | 1,737 | 1,953 | 765 | 694 | 1,914 | 2,072 |
| Pretax Income | 1,879 | 672 | 466 | 1,437 | 1,708 | 508 | 410 | 3,393 | 1,789 |
| Consolidated Net Income | 1,291 | 408 | 289 | 1,061 | 1,153 | 322 | 247 | 2,387 | 1,194 |
| Minority Interest | 8 | 10 | 6 | 11 | 7 | 8 | 8 | 12 | 0 |
| Net Income ATOP | 1,283 | 398 | 283 | 1,050 | 1,146 | 314 | 239 | 2,376 | 1,194 |
| Year-on-year | 1.2% | 72.8% | 24.9% | 20.6% | -10.7% | -21.1% | -15.4% | 126.2% | 4.1% |
| Net Income Margin | 15.2% | 6.0% | 4.8% | 12.5% | 13.7% | 4.8% | 3.9% | 27.5% | 13.1% |
| (Balance Sheet) | |||||||||
| Cash & Short-Term Investments | 14,463 | 14,274 | 14,057 | 14,641 | 16,248 | 16,534 | 15,910 | 19,146 | 19,862 |
| Total assets | 32,567 | 33,121 | 31,703 | 36,195 | 34,614 | 35,209 | 33,879 | 40,058 | 38,452 |
| Total Debt | 257 | 172 | 139 | 107 | 100 | 93 | 85 | 209 | 184 |
| Net Debt | -14,207 | -14,102 | -13,917 | -14,534 | -16,148 | -16,441 | -15,824 | -18,937 | -19,677 |
| Total liabilities | 6,380 | 6,720 | 5,593 | 8,194 | 6,088 | 6,544 | 5,539 | 9,331 | 7,630 |
| Total Shareholders’ Equity | 25,858 | 26,063 | 25,766 | 27,645 | 28,161 | 28,294 | 27,959 | 30,335 | 30,440 |
| (Profitability %) | |||||||||
| ROA | 8.24 | 8.63 | 9.16 | 8.66 | 8.57 | 8.18 | 8.39 | 10.69 | 11.29 |
| ROE | 10.47 | 11.04 | 11.40 | 11.50 | 10.65 | 10.28 | 10.24 | 14.06 | 14.07 |
| (Per-share) Unit: JPY | |||||||||
| EPS | 98.2 | 30.6 | 21.8 | 80.9 | 88.3 | 24.2 | 18.4 | 183.0 | 92.3 |
| BPS | 1,979.7 | 2,008.3 | 1,985.4 | 2,130.2 | 2,170.0 | 2,179.8 | 2,154.0 | 2,337.1 | 2,358.7 |
| Dividend per Share | 0.00 | 40.00 | 0.00 | 40.00 | 0.00 | 45.00 | 0.00 | 75.00 | 0.00 |
| Shares Outstanding (million shares) | 13.15 | 13.15 | 13.15 | 13.15 | 13.15 | 13.15 | 13.15 | 13.15 | 13.15 |
Source: Omega Investment
Financial data (full-year basis)
| Unit: million yen | 2018 | 2019 | 2020 | 2021 | 2022 | 2023 | 2024 | 2025 |
| (Income Statement) | ||||||||
| Sales | 15,792 | 18,258 | 19,117 | 24,777 | 25,318 | 27,568 | 29,278 | 29,679 |
| Year-on-year | 4.2% | 15.6% | 4.7% | 29.6% | 2.2% | 8.9% | 6.2% | 1.4% |
| Cost of Goods Sold | 9,590 | 11,388 | 11,484 | 15,071 | 14,891 | 16,596 | 17,542 | 17,554 |
| Gross Income | 6,202 | 6,870 | 7,633 | 9,706 | 10,427 | 10,972 | 11,736 | 12,125 |
| Gross Income Margin | 39.3% | 37.6% | 39.9% | 39.2% | 41.2% | 39.8% | 40.1% | 40.9% |
| SG&A Expense | 4,541 | 4,946 | 5,247 | 6,878 | 6,641 | 6,923 | 7,253 | 7,818 |
| EBIT (operating profit) | 1,534 | 1,780 | 2,245 | 2,707 | 3,561 | 3,812 | 4,232 | 4,049 |
| Year-on-year | 3.9% | 16.0% | 26.1% | 20.6% | 31.5% | 7.1% | 11.0% | -4.3% |
| Operating profit Margin | 9.7% | 9.7% | 11.7% | 10.9% | 14.1% | 13.8% | 14.5% | 13.6% |
| EBITDA | 2,149 | 2,424 | 2,852 | 3,646 | 4,732 | 5,031 | 5,482 | 5,326 |
| Pretax Income | 1,691 | 1,913 | 2,453 | 2,933 | 3,630 | 4,010 | 4,454 | 6,018 |
| Consolidated Net Income | 1,137 | 1,273 | 1,685 | 1,804 | 2,301 | 2,625 | 3,049 | 4,110 |
| Minority Interest | 26 | 36 | 130 | 164 | 51 | 29 | 35 | 35 |
| Net Income ATOP | 1,111 | 1,237 | 1,555 | 1,640 | 2,250 | 2,596 | 3,014 | 4,076 |
| Year-on-year | 2.7% | 11.3% | 25.8% | 5.4% | 37.2% | 15.4% | 16.1% | 35.2% |
| Net Income Margin | 7.0% | 6.8% | 8.1% | 6.6% | 8.9% | 9.4% | 10.3% | 13.7% |
| (Balance Sheet) | ||||||||
| Cash & Short-Term Investments | 6,751 | 7,845 | 7,365 | 9,745 | 10,296 | 13,139 | 14,641 | 19,146 |
| Total assets | 20,033 | 22,442 | 26,450 | 30,972 | 30,924 | 33,444 | 36,195 | 40,058 |
| Total Debt | 102 | 749 | 2,808 | 702 | 441 | 367 | 107 | 209 |
| Net Debt | -6,650 | -7,096 | -4,557 | -9,042 | -9,856 | -12,773 | -14,534 | -18,937 |
| Total liabilities | 5,488 | 7,082 | 9,867 | 8,504 | 7,560 | 8,361 | 8,194 | 9,331 |
| Total Shareholders’ Equity | 14,248 | 15,000 | 16,083 | 21,920 | 23,069 | 24,763 | 27,645 | 30,335 |
| (Cash Flow) | ||||||||
| Net Operating Cash Flow | 1,577 | 1,829 | 3,111 | 2,569 | 2,802 | 4,794 | 3,412 | 4,391 |
| Capital Expenditure | 601 | 528 | 1,146 | 1,183 | 945 | 824 | 1,052 | 957 |
| Net Investing Cash Flow | -940 | -806 | -5,229 | -1,395 | -957 | -763 | -889 | 1,248 |
| Net Financing Cash Flow | -481 | -30 | 1,477 | 1,193 | -1,234 | -1,192 | -1,371 | -1,127 |
| Free Cash Flow | 1,468 | 1,753 | 2,689 | 2,486 | 2,734 | 4,608 | 2,860 | 4,083 |
| (Profitability ) | ||||||||
| ROA (%) | 5.75 | 5.82 | 6.36 | 5.71 | 7.27 | 8.06 | 8.66 | 10.69 |
| ROE (%) | 8.00 | 8.46 | 10.01 | 8.63 | 10.00 | 10.85 | 11.50 | 14.06 |
| Net Margin (%) | 7.03 | 6.77 | 8.14 | 6.62 | 8.89 | 9.42 | 10.30 | 13.73 |
| Asset Turn | 0.82 | 0.86 | 0.78 | 0.86 | 0.82 | 0.86 | 0.84 | 0.78 |
| Assets/Equity | 1.39 | 1.45 | 1.57 | 1.51 | 1.38 | 1.35 | 1.33 | 1.32 |
| (Per-share) Unit: JPY | ||||||||
| EPS | 99.4 | 110.6 | 139.0 | 130.0 | 171.3 | 197.7 | 231.8 | 314.0 |
| BPS | 1,274.7 | 1,342.0 | 1,409.7 | 1,672.2 | 1,754.8 | 1,895.9 | 2,130.2 | 2,337.1 |
| Dividend per Share | 50.00 | 50.00 | 54.00 | 54.00 | 58.00 | 70.00 | 80.00 | 120.00 |
| Shares Outstanding (million shares) | 12.94 | 12.94 | 12.94 | 13.15 | 13.15 | 13.15 | 13.15 | 13.15 |
Source: Omega Investment