2026-04-02
Home
Japanese

Omega Investment Co., Ltd.
Ricksoft (Investment Report – 2Q update)
| Share price (10/30) | ¥951 | Dividend Yield (26/2 CE) | 0.0 % |
| 52weeks high/low | ¥738/1,230 | ROE(25/2 act) | 12.3% |
| Avg Vol (3 month) | 11.6 thou shrs | Operating margin (TTM) | 5.1 % |
| Market Cap | ¥4.33 bn | Beta (5Y Monthly) | 0.01 |
| Enterprise Value | ¥1.93 bn | Shares Outstanding | 4.550 mn shrs |
| PER (26/2 CE) | 13.6 X | Listed market | TSE Growth |
| PBR (25/2 act) | 1.4 X |
| Click here for the PDF version of this page |
| PDF version |
Quintessential deep value: sizable net cash and stable cash flow; awaiting visible results from the revenue model shift
◇Investment conclusion: we value the coexistence of extreme undervaluation with a profit- and FCF-generating profile; the long-term appeal is significant, while near-term rerating hinges on capital allocation and making the results of the revenue-model shift visible
Despite the uncommon level at which net cash accounts for about 85% of market capitalization, the market’s assessment of Ricksoft, Co., Ltd. (hereinafter, Ricksoft) remains in a cautious range. Given that the company continues to post profits and generate free cash flow, there is ample room for long-term upside. On the other hand, a near-term rerating is likely to depend on a shift in capital allocation and the visibility of results from the revenue-model transformation.
At the end of the second quarter of FY2/2026 (end-August), net cash stood at 3.93 billion yen. Quarterly cash generation remained positive, and the company continues to have a profile capable of generating FCF on the order of several hundred million yen on an annualized basis. Even so, the current assessment is markedly inexpensive: EV/EBITDA is 1.59x; the earnings yield is about 10%; and the net-cash-adjusted PER [(market capitalization − net cash) / LTM net income] is 0.73x— all bargain levels. Current valuation metrics are a forecast PER of 14.6x, an actual PBR of 1.48x, and a forecast ROE of 10.4%. In addition, the fact that Hikari Tsushin increased its holdings year-to-date to become the second-largest shareholder with a 9.27% stake in a short period suggests external conviction in Ricksoft’s stable cash generation.
The company’s sources of strength lie in the recurring base that supports stable operating cash flow generation, deep implementation capabilities that penetrate customers, including large enterprises, and a sound financial position with ample cash on hand and virtually no interest-bearing debt. That said, dividends remain at zero, and share buybacks are small relative to cash on hand, leaving only a limited impact on the capital structure. Therefore, the conditions for a rerating are either (1) disclosure of the improvement track for KPIs (e.g., the sales ratio of Professional Services/Technology Solutions, service gross margin, EBITDA range), or (2) hints of an upside to the current fiscal year through guidance updates.
The primary appeal of investing in Ricksoft is that “despite being a bargain deep-value name, the company remains profitable and generates FCF.” Until capital allocation and quantitative results from the model shift are confirmed, a rerating is likely to rely on catalysts such as capital policies or M&A; however, the current share price and financial profile hold strong appeal for long-term investors.
◇ FY2/2026 Q2 results highlights: net sales grew +19.0%, but profit declined on lower gross margin and an FX loss; steady buildup of contract liabilities
For the six months ended Q2 FY2/2026, Ricksoft reported net sales of 5,126 million yen (+19.0% YoY), while operating profit came in at 167 million yen (−25.0% YoY), ordinary profit at 138 million yen (−40.0% YoY), and net income attributable to owners of the parent at 109 million yen (−37.9% YoY). The main factors were a decline in gross margin and a 30 million yen foreign exchange loss.
The drivers of net sales were Technology Solutions and Professional Services. Technology Solutions grew to 4.124 billion yen (+15.7% YoY) and Professional Services to 669 million yen (+69.5% YoY). By contrast, In-house Products were 332 million yen (−5.2% YoY), with a lower composition. As a timing factor within the quarter, on-premises projects were recognized ahead of schedule in Q1, temporarily pushing down Technology Solutions’ net sales in Q2, a point to note.
Earnings were under headwinds. Gross profit was 1.157 billion yen, and the gross profit margin declined to 22.6% (27.3% in the same period a year earlier; −4.7pt). Selling, general, and administrative expenses increased to 990 million yen, but the SG&A ratio improved to 19.3% (22.1% a year earlier), indicating cost control is working. However, the operating margin fell to 3.3% (5.2% a year earlier), underscoring the need for a recovery in profitability. The company takes the decline in operating margin seriously and is proceeding with a review of organizational structure under the direct leadership of the President.
Leading indicators are favorable. Contract liabilities increased to 3.400 billion yen at quarter-end, providing a source of future revenue recognition. Operating cash flow improved to an inflow of 698 million yen; cash and deposits at quarter-end increased to 3.93 billion yen; and the equity ratio was 41.6%. Financial headroom is ample, allowing continued investment in necessary personnel and organizational capabilities.
In the external environment, a temporary 30 million yen foreign exchange loss weighed on ordinary profit. Even so, to restore gross margin, measures such as mix correction (recovering the share of high-value-added services and in-house products), price/cost optimization, and resource reallocation are effective. Under the “Reignite 2030” framework, Ricksoft is proceeding to strengthen its organization.
Contract liabilities and financial latitude are reassuring as a foundation for the next fiscal year and beyond. The focus is on a rebound in gross margin, for which a mix correction is key. If KPI disclosure, such as service-level gross margin progress, opens the door to a reassessment alongside confirmation of a bottoming in margins.
◇ Segment analysis: external disclosure is a single “Tool Solutions business”; the three pillars (Technology / Professional / In-house Products) deepen ongoing value
Ricksoft externally discloses a single reportable segment, the “Tool Solutions business,” and does not disclose sales/profit breakdowns by segment. In substance, however, the business is built on three pillars—Technology Solutions, Professional Services, and In-house Products—providing an end-to-end structure that supports customers both before and after implementation.
The three-pillar service system is as follows.
・Consulting/SI: Provides end-to-end services from requirements definition through design, implementation, and operations.
・Support/Customer Success: Ongoing provision of administrator assistance and inquiry handling.
・Operations outsourcing (BPO) / training and e-learning / generative-AI utilization training: Supports maximizing value after go-live.
・In-house app (add-on) development: Expands functions and enhances synergies with Atlassian and other products.
Revenue recognition differs clearly between products and services. SI is, in principle, recognized at acceptance on a per-project lump-sum basis; support and BPO, etc., are recognized monthly (annual contracts are prorated over the period). For in-house products, recognition depends on the sales format: subscriptions are recognized monthly (annual amounts are prorated), and one-off license provision is recognized at the time of provision. As a result, the revenue model combines the lumpiness of implementation projects with recurring revenues such as maintenance, operations, and cloud.
The customer base is centered on large enterprises, with numerous implementations at TSE Prime-listed companies. Centered on Atlassian, the company pursues a “best-of-breed” approach by combining highly synergistic surrounding products with its in-house apps.
Recently, performance for the first half of FY2/2026 was net sales of 5,126 million yen (+19.0% YoY) and operating profit of 167 million yen (−25.0% YoY). Because there is a single segment, composition is not disclosed; however, based on the recognition rules above, we understand that, during the period, the base is formed by recurring revenues from support and cloud, in addition to timing effects from licenses and SI.
◇ Earnings outlook: full-year forecasts left unchanged; progress of 50.4% in net sales and 40.7% in operating profit; in the second half, focus on a rebound in the gross margin and “visualization” of KPIs
Ricksoft has left its FY2/2026 full-year forecast unchanged, projecting net sales of 10.168 billion yen, operating profit of 411 million yen, ordinary profit of 411 million yen, net income of 315 million yen, and EPS of 70.53 yen. The year-end dividend forecast remains 0 yen. First-half (cumulative Q2) results were net sales of 5,126 million yen and operating profit of 167 million yen; progress against the full-year plan is 50.4% for net sales, 40.7% for operating profit, and 33.8% for ordinary profit. The company continues to forecast no dividend, and there is no change in company disclosures.
A near-term tailwind is that contract liabilities increased to 3.4 billion yen at quarter-end. The buildup of the source for future revenue recognition improves visibility for second-half net sales. The key to profit attainment, however, is margin. In the first half, lower gross margin and the FX loss led to declines in both operating and ordinary profit; in the second half, the focus will be on correcting the profitability that declined due to the service mix. The company advocates structural reforms and efficiency gains, with an emphasis on high-profitability domains, and we see improvements in the service/product mix and cost efficiency as the main drivers of profitability recovery. In future disclosures, modifications will be made to the ratio of in-house products and pricing terms.
The financial aspect is favorable. Operating cash flow was an inflow of 698 million yen, cash and deposits at quarter-end increased to 3.93 billion yen, and the company can underpin necessary investment in personnel and organizational structure. The company states it is maintaining its current-year forecast and will promptly disclose if a revision is required. Thus, this fiscal year is a pronounced transition period of “maintaining sales growth while restoring margins.”
In the medium term, under “Reignite 2030,” the company targets EBITDA of 3.0 billion yen by 2030. The baseline is a shift to a high-profitability structure through structural reforms and strengthening of specialist teams, and the current fiscal year is the first year of that effort.
Progress is in the 50% range for net sales and the 40% range for profit—“on plan, but premised on a second-half rebound in the gross margin.” Contract liabilities and ample cash provide a floor. Still, for a change in assessment, effective measures include presenting transformation KPIs, such as NRR and service-level gross margin, and clarifying shareholder return policies.
◇ Share price trend and points of focus: after retracing higher over the past three months, momentum stalled near the highs; to break above the 1,050–1,100 yen congestion zone, “endogenous catalysts” are needed
Since July, the share price has been on a gentle uptrend, reaching 1,230 yen on October 8 before being pushed back to around 1,100 yen around the time of the results. Recently, it has been stuck in a narrow 1,050–1,100 yen range, with clear resistance at 1,200 yen. The recent pattern shows higher lows from late September to early October, followed by an adjustment from the high zone in mid-October.
The shares remain undervalued: in addition to a forecast PER of 14.6x, an actual PBR of 1.48x, a forecast EPS of 70.6 yen, a forecast ROE of 10.4%, and net cash of 3.93 billion yen, the EV/EBITDA is 1.59x and the net-cash-adjusted PER is 0.73x—both indicating pronounced cheapness. Because dividends remain zero and the magnitude of buybacks is limited, a rerating will require clear messages and execution from management.
The linkage between news flow and price action is readable. After Hikari Tsushin filed an amended large-shareholding report (9.27% holding) on September 26, the share price rose about +12% from the September 26 close of 1,077 yen to the October 8 close of 1,206 yen, lifting the floor. Thereafter, following the interim results, profit-taking selling dominated, and after a retreat from the high zone, the stock moved into a consolidation around 1,100 yen.
From here, the focus is on how far management’s “on-the-ground involvement” will translate into quantitative results. The company explains that the President has stepped onto the front lines to converse with employees, shares management policy and business strategy at a monthly all-hands meeting, aligns project progress and issues at a weekly GM meeting, and considers the best measures in weekly meetings with GMs and managers to drive a company-wide shift in mindset. If this operating cadence is reflected in metrics such as the gross margin, service-level profitability, and order visibility, it could become an “endogenous signal” to break through the upper resistance area in the share price.
Technically, 1,200–1,230 yen is a clear upper resistance band, and to stably break above it on a closing basis will require a rebound in profitability and progress in KPI disclosure. On the downside, around 1,050 yen is the first line of defense; if breached, the 1,000-yen round number is the next battleground. Increased volume in the upper zone suggests lingering selling on rallies, and quantitative evidence will be needed to overcome it. Note that the company recognizes the decline in operating margin as a critical issue and is pursuing organizational structural reforms under the President’s direct leadership. Whether this becomes visible in the figures is the near-term hurdle.
The investment checklist is clear. First, quantitative disclosures that underpin a rebound in the gross margin (recovery in service-level gross margins and in the ratio of in-house products, and results from price/cost optimization). Second, continued presentation and progress of transformation KPIs (the sales ratio of Professional Services/Technology Solutions, service gross margin, and the EBITDA range). Third, clarification of capital allocation policy (allocation guidelines for shareholder returns versus growth investment relative to net cash). Suppose these are shown step by step, and improvement becomes visible in line with the “on-the-ground involvement” described above. In that case, the correction of undervaluation should progress, putting a regime shift with a firm foothold in the 1,200-yen range into view.
A two-stage approach to trading timing is realistic. During the process of establishing a floor in the 1,050–1,100 yen congestion zone, pullbacks suited to an investor’s risk tolerance are likely to appear. Conversely, for chasing upside, a strategy would be to wait for “endogenous signals” such as a rebound in the gross margin, progress in KPI disclosure, and an update to capital allocation, and to use a clear breakout into the 1,200-yen range on rising volume as the cue.
The trading range is the flip side of “continued undervaluation.” If the President-led on-the-ground involvement and meeting cadence are reflected in KPIs for the gross margin and orders, the reappraisal of the shares could come quickly. If disclosure on NRR and service-level gross margins is strengthened and the capital allocation policy is clarified, resistance in the 1,200-yen range should ease.
Company profile
◇A company supporting DX promotion centered on Atlassian products; accelerating diversification of earnings through professional services and proprietary products
Ricksoft, Co., Ltd. was established in 2005 in Chiyoda-ku, Tokyo, and is currently listed on the TSE Growth Market. The company has 148 employees on a consolidated basis. It provides solutions that support corporate operational efficiency and team productivity, and is developing its business with three pillars: “Technology Solutions,” “Professional Services,” “Professional Services,” and “In-house Products.”
The business model consists of (1) license sales of overseas software (mainly the Atlassian suite), (2) SI and customer success offering end-to-end support from requirements definition through design, build, and operations, (3) managed services such as operations outsourcing (BPO) and administrator assistance, and (4) in-house app (add-on) development; it has a strong recurring flavor in step with customers’ ongoing challenges. Recently, Ricksoft has also been expanding into adjacent services, such as generative AI training and e-learning.
In the medium term, the company aims to become a “strategic partner” to customers, forming specialized teams by industry and moving toward a structure that solves customers’ unique on-site challenges through co-creation. In line with this, the company plans business-model transformation and human-capital investment toward 2030 (totaling around 6.0 billion yen), sets a target of EBITDA of 3.0 billion yen, and is shifting course from a traditional license-heavy approach toward an emphasis on high-value-added services.
Key financial data
| Unit: million yen | 2021/2 | 2022/2 | 2023/2 | 2024/2 | 2025/2 | 2026/2 CE |
| Sales | 4,431 | 4,308 | 5,623 | 7,491 | 9,044 | 10,168 |
| EBIT (Operating Income) | 602 | 437 | 547 | 666 | 459 | 411 |
| Pretax Income | 601 | 450 | 567 | 350 | 462 | 411 |
| Net Profit Attributable to Owner of Parent | 446 | 327 | 424 | 269 | 356 | 315 |
| Cash & Short-Term Investments | 1,944 | 2,089 | 3,071 | 3,158 | 3,297 | |
| Total assets | 3,180 | 2,939 | 4,577 | 5,971 | 6,687 | |
| Total Debt | 0 | 0 | 0 | 0 | 0 | |
| Net Debt | -1,944 | -2,089 | -3,071 | -3,158 | -3,297 | |
| Total liabilities | 1,279 | 684 | 2,103 | 3,203 | 3,658 | |
| Total Shareholders’ Equity | 1,901 | 2,255 | 2,474 | 2,768 | 3,029 | |
| Net Operating Cash Flow | 478 | 161 | 978 | 100 | 377 | |
| Capital Expenditure | 9 | 61 | 25 | 30 | 95 | |
| Net Investing Cash Flow | -8 | -47 | -27 | -37 | -140 | |
| Net Financing Cash Flow | 19 | 23 | 18 | 7 | -91 | |
| Free Cash Flow | 469 | 110 | 968 | 86 | 298 | |
| ROA (%) | 17.47 | 10.69 | 11.28 | 5.10 | 5.62 | |
| ROE (%) | 26.70 | 15.73 | 17.92 | 10.26 | 12.27 | |
| EPS (Yen) | 103.6 | 74.5 | 94.4 | 59.2 | 78.6 | 70.5 |
| BPS (Yen) | 436.6 | 507.2 | 547.4 | 608.3 | 676.1 | |
| Dividend per Share (Yen) | 0.00 | 0.00 | 0.00 | 0.00 | 0.00 | 0.00 |
| Shares Outstanding (Million shares) | 4.29 | 4.37 | 4.51 | 4.55 | 4.55 |
Source: Omega Investment from company data, rounded to the nearest whole number.
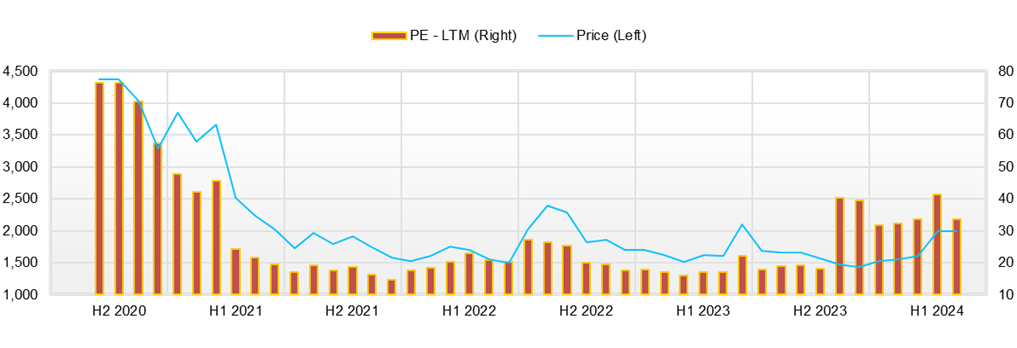
Share price
Financial data (quarterly basis)
| Unit: million yen | 2024/2 | 2025/2 | 2026/2 | ||||||
| 2Q | 3Q | 4Q | 1Q | 2Q | 3Q | 4Q | 1Q | 2Q | |
| (Income Statement) | |||||||||
| Sales | 1,907 | 1,819 | 2,193 | 2,047 | 2,263 | 2,289 | 2,445 | 2,872 | 2,254 |
| Year-on-year | 62.5% | 50.3% | 30.8% | 30.2% | 18.7% | 25.8% | 11.5% | 40.3% | -0.4% |
| Cost of Goods Sold (COGS) | 1,383 | 1,258 | 1,553 | 1,429 | 1,703 | 1,711 | 1,826 | 2,247 | 1,722 |
| Gross Income | 525 | 561 | 641 | 617 | 560 | 577 | 619 | 625 | 532 |
| Gross Income Margin | 27.5% | 30.9% | 29.2% | 30.2% | 24.7% | 25.2% | 25.3% | 21.8% | 23.6% |
| SG&A Expense | 379 | 415 | 413 | 470 | 485 | 493 | 468 | 495 | 495 |
| EBIT (Operating Income) | 145 | 146 | 228 | 148 | 76 | 84 | 151 | 130 | 37 |
| Year-on-year | 30.7% | 37.0% | 42.0% | 0.7% | -48.0% | -42.3% | -33.5% | -11.9% | -50.7% |
| Operating Income Margin | 7.6% | 8.0% | 10.4% | 7.2% | 3.3% | 3.7% | 6.2% | 4.5% | 1.7% |
| EBITDA | 151 | 153 | 235 | 155 | 83 | 97 | 167 | 145 | 51 |
| Pretax Income | -209 | 179 | 236 | 155 | 77 | 85 | 145 | 97 | 41 |
| Consolidated Net Income | -142 | 131 | 177 | 115 | 62 | 68 | 111 | 74 | 36 |
| Minority Interest | 0 | 0 | 0 | 0 | 0 | 0 | 0 | 0 | 0 |
| Net Income ATOP | -142 | 131 | 177 | 115 | 62 | 68 | 111 | 74 | 36 |
| Year-on-year | -262.0% | 69.3% | 40.8% | 11.9% | -143.6% | -48.5% | -37.3% | -35.5% | -42.5% |
| Net Income Margin | -7.4% | 7.2% | 8.1% | 5.6% | 2.7% | 3.0% | 4.5% | 2.6% | 1.6% |
| (Balance Sheet) | |||||||||
| Cash & Short-Term Investments | 2,838 | 3,047 | 3,158 | 3,375 | 3,442 | 3,192 | 3,297 | 3,142 | 3,930 |
| Total assets | 4,788 | 5,830 | 5,971 | 6,291 | 6,588 | 6,004 | 6,687 | 7,365 | 7,533 |
| Total Debt | 0 | 0 | 0 | 0 | 0 | 0 | 0 | 0 | 0 |
| Net Debt | -2,838 | -3,047 | -3,158 | -3,375 | -3,442 | -3,192 | -3,297 | -3,142 | -3,930 |
| Total liabilities | 2,336 | 3,246 | 3,203 | 3,398 | 3,661 | 3,083 | 3,658 | 4,275 | 4,397 |
| Total Sharehjolders’ Equity | 2,452 | 2,585 | 2,768 | 2,893 | 2,927 | 2,921 | 3,029 | 3,090 | 3,137 |
| (Profitability %) | |||||||||
| ROA | 3.88 | 4.47 | 5.10 | 4.99 | 8.53 | 7.12 | 5.62 | 4.61 | 4.08 |
| ROE | 6.96 | 8.83 | 10.26 | 10.26 | 18.03 | 15.31 | 12.27 | 10.52 | 9.51 |
| (Per-share) Unit: JPY | |||||||||
| EPS | -31.2 | 28.8 | 38.9 | 25.3 | 13.6 | 15.1 | 24.8 | 16.6 | 7.9 |
| BPS | 538.9 | 568.0 | 608.3 | 635.7 | 643.9 | 652.0 | 676.1 | 689.7 | 697.1 |
| Dividend per Share | 0.00 | 0.00 | 0.00 | 0.00 | 0.00 | 0.00 | 0.00 | 0.00 | 0.00 |
| Shares Outstanding (milion shares) | 4.55 | 4.55 | 4.55 | 4.55 | 4.55 | 4.55 | 4.55 | 4.55 | 4.55 |
Source: Omega Investment from company materials
Financial data (full-year basis)
| Unit: million yen | 2020/2 | 2021/2 | 2022/2 | 2023/2 | 2024/2 | 2025/2 |
| (Income Statement) | ||||||
| Sales | 3,089 | 4,431 | 4,308 | 5,623 | 7,491 | 9,044 |
| Year-on-year | 24.4% | 43.5% | -2.8% | 30.5% | 33.2% | 20.7% |
| Cost of Goods Sold | 1,904 | 2,868 | 2,779 | 3,759 | 5,249 | 6,670 |
| Gross Income | 1,184 | 1,563 | 1,529 | 1,864 | 2,242 | 2,374 |
| Gross Income Margin | 38.3% | 35.3% | 35.5% | 33.1% | 29.9% | 26.2% |
| SG&A Expense | 782 | 961 | 1,091 | 1,317 | 1,576 | 1,915 |
| EBIT (Operating Income) | 402 | 602 | 437 | 547 | 666 | 459 |
| Year-on-year | 8.3% | 49.6% | -27.3% | 25.0% | 21.7% | -31.1% |
| Operating Income Margin | 13.0% | 13.6% | 10.2% | 9.7% | 8.9% | 5.1% |
| EBITDA | 416 | 617 | 467 | 566 | 691 | 502 |
| Pretax Income | 403 | 601 | 450 | 567 | 350 | 462 |
| Consolidated Net Income | 289 | 446 | 327 | 424 | 269 | 356 |
| Minority Interest | 0 | 0 | 0 | 0 | 0 | 0 |
| Net Income ATOP | 289 | 446 | 327 | 424 | 269 | 356 |
| Year-on-year | 13.0% | 54.3% | -26.7% | 29.7% | -36.5% | 32.2% |
| Net Income Margin | 9.4% | 10.1% | 7.6% | 7.5% | 3.6% | 3.9% |
| (Balance Sheet) | ||||||
| Cash & Short-Term Investments | 1,458 | 1,944 | 2,089 | 3,071 | 3,158 | 3,297 |
| Total assets | 1,922 | 3,180 | 2,939 | 4,577 | 5,971 | 6,687 |
| Total Debt | 0 | 0 | 0 | 0 | 0 | 0 |
| Net Debt | -1,458 | -1,944 | -2,089 | -3,071 | -3,158 | -3,297 |
| Total liabilities | 484 | 1,279 | 684 | 2,103 | 3,203 | 3,658 |
| Total Shareholders’ Equity | 1,437 | 1,901 | 2,255 | 2,474 | 2,768 | 3,029 |
| (Cash Flow) | ||||||
| Net Operating Cash Flow | 316 | 478 | 161 | 978 | 100 | 377 |
| Capital Expenditure | 13 | 9 | 61 | 25 | 30 | 95 |
| Net Investing Cash Flow | -43 | -8 | -47 | -27 | -37 | -140 |
| Net Financing Cash Flow | 152 | 19 | 23 | 18 | 7 | -91 |
| Free Cash Flow | 303 | 469 | 110 | 968 | 86 | 298 |
| (Profitability %) | ||||||
| ROA | 16.97 | 17.47 | 10.69 | 11.28 | 5.10 | 5.62 |
| ROE | 23.80 | 26.70 | 15.73 | 17.92 | 10.26 | 12.27 |
| Net profit margin | 9.35 | 10.06 | 7.59 | 7.54 | 3.59 | 3.93 |
| Asset turnover ratio | 1.81 | 1.74 | 1.41 | 1.50 | 1.42 | 1.43 |
| Financial leverage | 1.40 | 1.53 | 1.47 | 1.59 | 2.01 | 2.18 |
| (Per-share) Unit: JPY | ||||||
| EPS | 68.5 | 103.6 | 74.5 | 94.4 | 59.2 | 78.6 |
| BPS | 336.0 | 436.6 | 507.2 | 547.4 | 608.3 | 676.1 |
| Dividend per Share | 0.00 | 0.00 | 0.00 | 0.00 | 0.00 | 0.00 |
| Shares Outstanding (million shrs) | 4.20 | 4.29 | 4.37 | 4.51 | 4.55 | 4.55 |
Source: Omega Investment from company materials