2026-04-02
Home
Japanese

Omega Investment Co., Ltd.
Itoki (Company note – 3Q update)

| Share price (11/18) | ¥2,268 | Dividend Yield (25/12 CE) | 3.00 % |
| 52weeks high/low | ¥2,580/1,356 | ROE(24/12 act) | 13.79 % |
| Avg Vol (3 month) | 137 thou shrs | Operating margin (24/12 act) | 7.3 % |
| Market Cap | ¥121.0 bn | Beta (5Y Monthly) | 0.31 |
| Enterprise Value | ¥132.0 bn | Shares Outstanding | 53.38 mn shrs |
| PER (25/12 CE) | 13.48 X | Listed market | TSE Prime |
| PBR (24/12 act) | 2.04 X |
| Click here for the PDF version of this page |
| PDF version |
3Q results were strong as expected.
The company announced a higher full-year dividend.
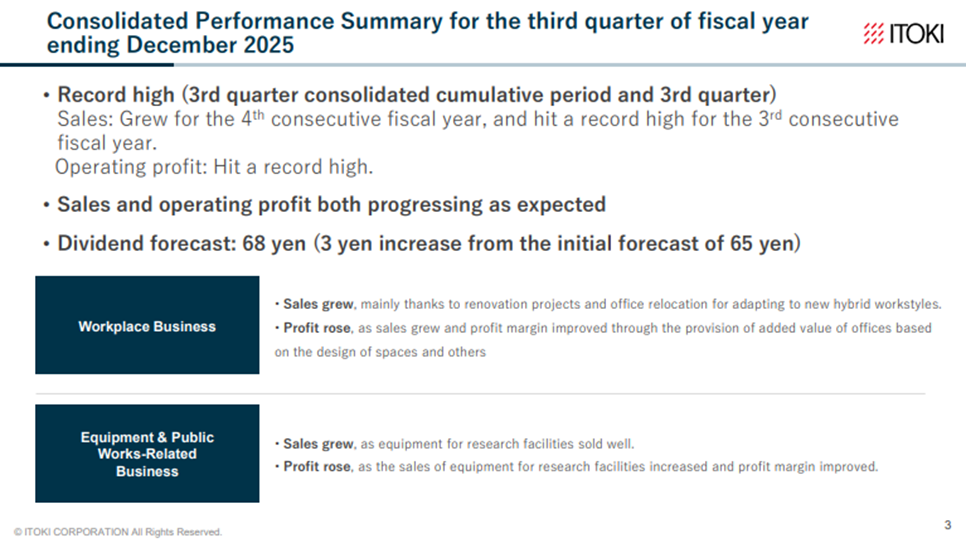
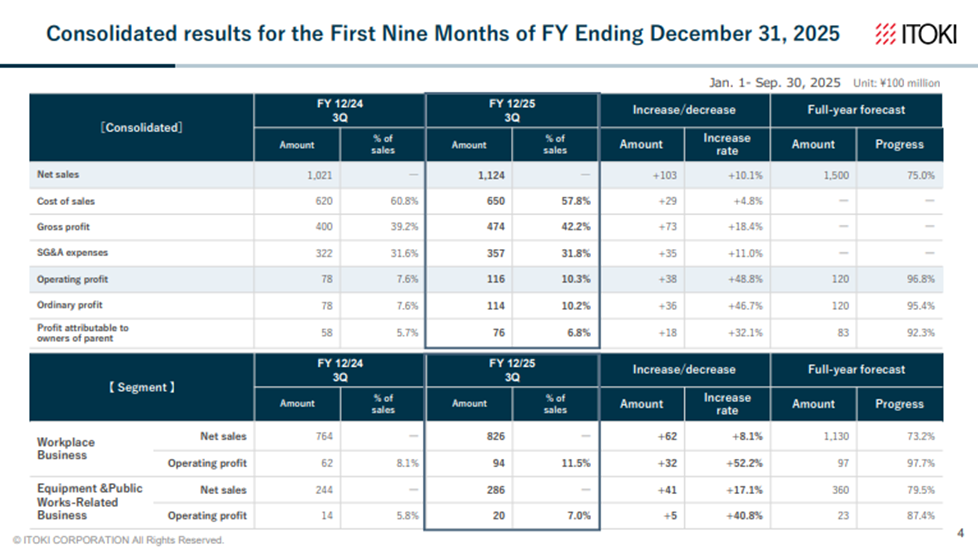
◇ FY12/2025 3Q Results highlights: favorable performance continues
The 3Q FY12/2025 results announced by Itoki on October 31, 2025, were strong, with both the Workplace Business and Equipment & Public Works-Related Business growing and delivering double-digit revenue and profit growth. On a cumulative basis, net sales were 112.45 billion yen (+ 10% YoY), operating profit was 11.61 billion yen (+ 48% YoY), ordinary profit was 11.45 billion yen (+ 46% YoY), and net income attributable to owners of the parent was 7.65 billion yen (+ 32% YoY). On a cumulative basis, net sales have now increased for four consecutive fiscal years and have reached a record high for three consecutive fiscal years. Operating profit has also reached a record high. Progress toward the full-year forecast is also in line with the company’s expectations.
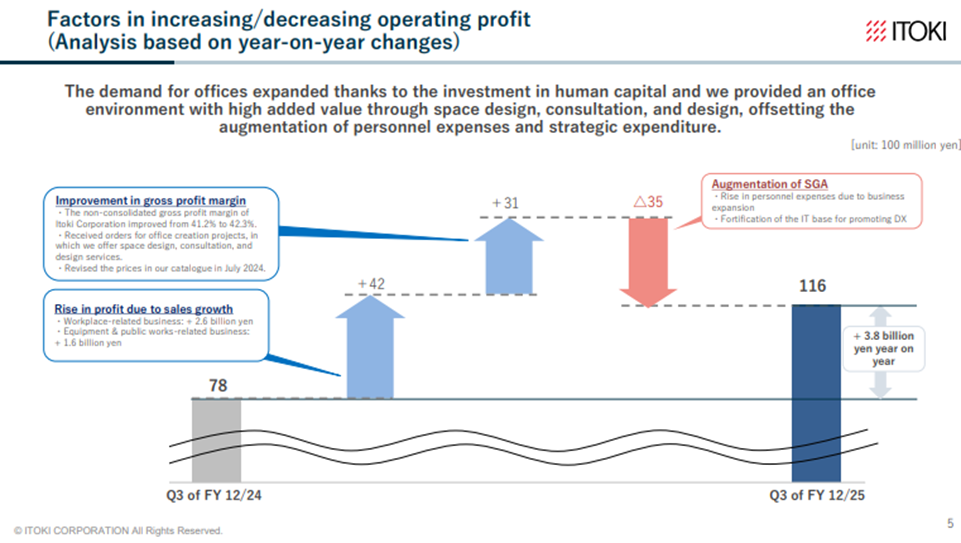
Business expansion is in a virtuous cycle. The company has steadily converted demand for office renewal and relocation, backed by heightened enthusiasm for investment in human capital, into net sales, thereby increasing volume. In addition, price revisions and the provision of value-added services beyond product sales, such as spatial design, consulting, and design proposals, have increased gross profit. This has allowed the company to cover strategic expenditures, such as higher personnel costs associated with business expansion and increased costs to strengthen IT infrastructure to promote DX, while still delivering a significant increase in operating profit.
Next, it is noteworthy that both the Workplace Business and the Equipment & Public Works-Related Business are performing well. In the Workplace Business, net sales were 82.6 billion yen (+ 6.2 billion yen YoY), operating profit was 9.4 billion yen (+ 3.2 billion yen YoY), and the operating profit margin was 11.5% (+ 3.4 percentage points). The background to this is mainly as described above. In the Equipment & Public Works-Related Business, net sales were 28.6 billion yen (+ 4.1 billion yen YoY), operating profit was 2.0 billion yen (+ 0.5 billion yen YoY), and the operating profit margin was 7.0% (+ 1.2 percentage points). Although the impact of delays in construction starts and completions on the customer side, against the backdrop of soaring materials prices, remains in equipment for logistics facilities and the like, net sales of equipment for research facilities are increasing, and profit margins are improving.
At present, there are no noteworthy concerns regarding the balance sheet.
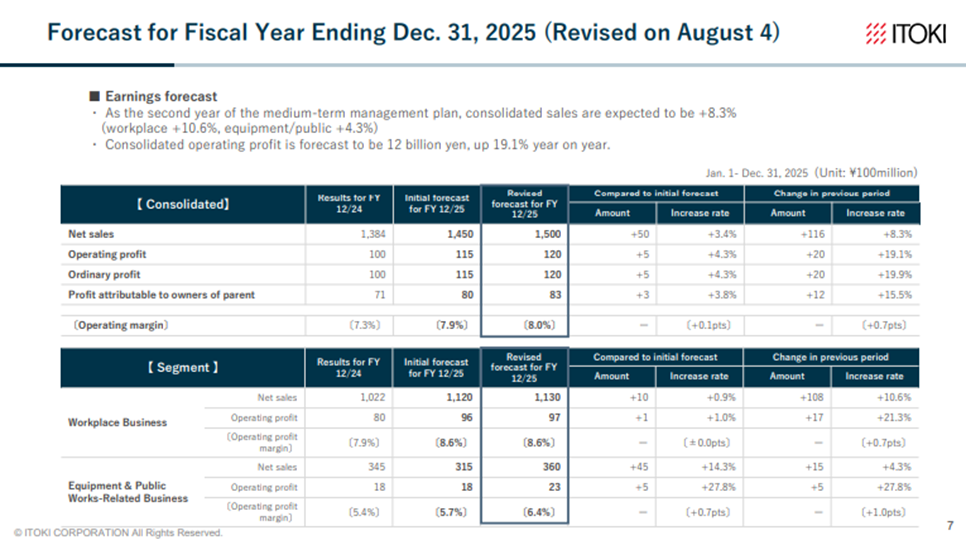
◇ Full-year FY12/2025 earnings forecast: previous forecast (projecting full-year increases in both revenue and profit) maintained; higher dividend announced.
The full-year earnings forecast was revised upward at the time of the announcement of the 2Q results. This time, those figures have been left unchanged. Specifically, the company is forecasting net sales of 150.0 billion yen (+ 8% YoY), operating profit of 12.0 billion yen (+ 19% YoY), ordinary profit of 12.0 billion yen (+ 19% YoY), and net income attributable to owners of the parent of 8.3 billion yen (+ 15% YoY). The company is aiming for another consecutive record high in earnings, driven by higher revenue and profits. Given the business environment and progress to date, the probability of achieving the full-year plan is high.
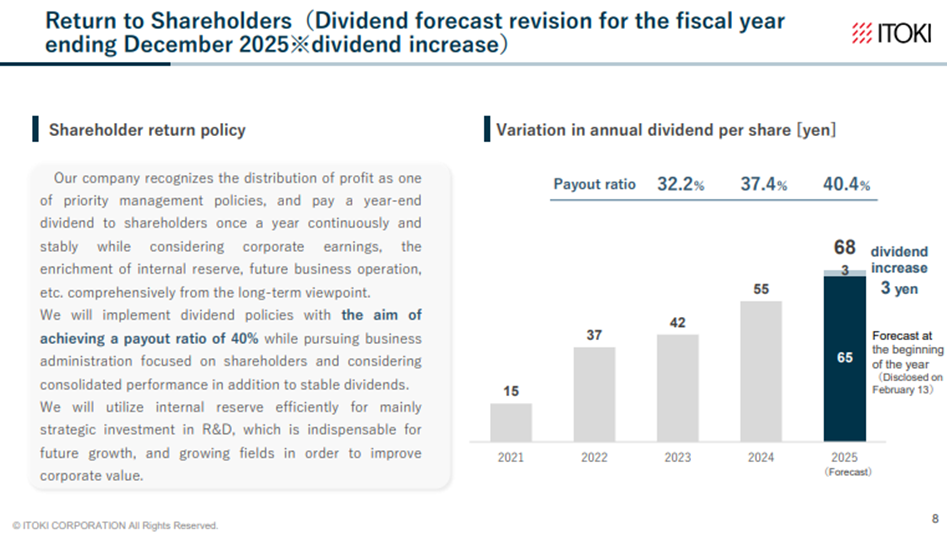
Also, the full-year dividend per share forecast has been raised from 65 yen to 68 yen. This represents a 13 yen increase from the previous fiscal year and implies a projected payout ratio of 40%. We view this positively as an indication of management’s confidence in the company’s earnings.
◇ Share price trends and future points of interest
Since April, the company’s share price has climbed steadily from the 1,600 yen range to the 2,500 yen range by August, and since August it has traded in the 2,300–2,500 yen range. After the announcement of the current 3Q results, it temporarily fell to 2,201 yen but quickly rebounded and is currently back up to 2,359 yen.
Reasons why the initial share price reaction to the current 3Q results was adverse likely include the following: first, when performance is compared with the same period of the previous year on a three-month basis, the planned execution of strategic spending makes it look superficially as if the pace of profit growth in 3Q has slowed; and second, the full-year earnings forecast was left unchanged.
However, the share price recovered quickly thereafter. Factors behind this likely include the following: demand for upgrading offices and other workplaces, which contributes to employee recruitment, retention, and productivity improvement, is a medium-term tailwind for the company; the company’s profit-oriented growth strategy is steadily producing results; and valuation indicators such as PER still have room for further upside.
Based on this view, the key points to watch in the near term and at the announcement of the full-year results are as follows.
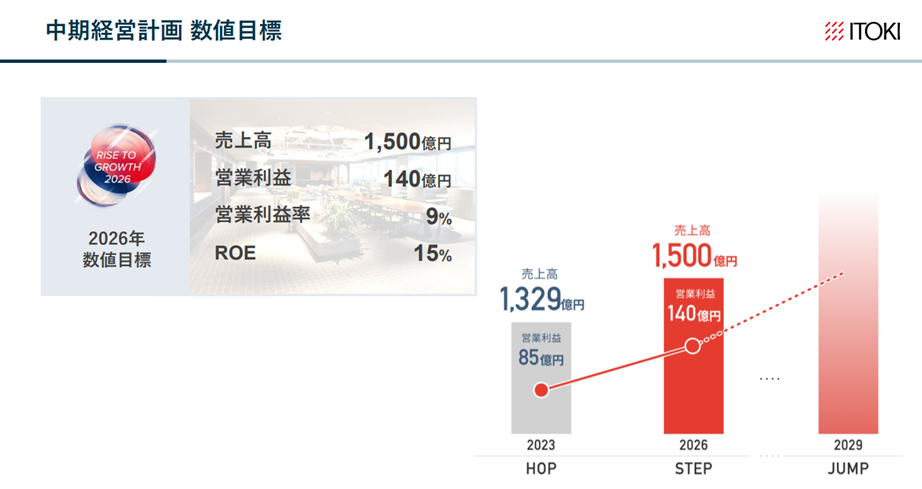
- That the probability of achieving the plan for FY12/2026, the final year of the medium-term management plan (net sales of 150.0 billion yen and operating profit of 14.0 billion yen), increases, and, if possible, that the targets are revised upward.
- To form an image of growth beyond the current medium-term management plan, there is an update on the emergence of new growth drivers, including the Office 3.0 domain, specialized facilities domain, higher-level DX and SCM, and overseas business.
- As a result, recurring revenue is generated and revenue sources become more diversified, making it possible to see a path of stable growth that does not depend solely on domestic office demand.
- The company presents its views on the long-term outlook for financial targets, such as ROE, and its approach to M&A.
- And that, under the disaster-prevention and national resilience policies promoted by the Takaichi administration, the company’s business in various types of special doors grows.
Through meetings with the company, we have confirmed that quotations for Data Trekking in the Office 3.0 domain are growing steadily and that Dalton Co., Ltd., a subsidiary that provides products and services to research and development institutions and manufacturing plants in fields such as pharmaceuticals, chemicals, biosciences, foods, and precision machinery, is steadily strengthening its management structure. The next full-year results briefing is therefore expected to attract even more attention.
Company profile
Itoki Corporation (Itoki) is an office furniture manufacturer that designs tomorrow’s “workstyles”. It was founded in 1890. In addition to office furniture manufacturing, the company is also involved in construction and interior decoration. In 2022, Koji Minato was appointed president, and the company’s corporate structure has been transformed under his leadership. The company has advocated Office DX and Office 3.0 and is working to add high value. Under its three-year medium-term management plan, RISE TO GROWTH 2026, which ends in FY2026, the company is promoting the priority strategy ‘7 Flags’ and ESG strategies under the theme of ‘enhancing sustainable growth’. The plan aims to achieve sales of 150 billion yen, operating profit of 14 billion yen and ROE of 15% in FY2026.
Key financial data
| Unit: million yen | 2020/12 | 2021/12 | 2022/12 | 2023/12 | 2024/12 | 2025/12 CE |
| Sales | 116,210 | 115,905 | 123,324 | 132,985 | 138,460 | 150,000 |
| EBIT (Operating Income) | 1,585 | 2,561 | 4,582 | 8,524 | 10,078 | 12,000 |
| Pretax Income | 1,277 | 1,523 | 8,372 | 8,378 | 10,071 | |
| Net Profit Attributable to Owner of Parent | -235 | 1,166 | 5,294 | 5,905 | 7,183 | 8,300 |
| Cash & Short-Term Investments | 18,246 | 17,451 | 26,976 | 24,795 | 22,482 | |
| Total assets | 105,096 | 103,898 | 115,288 | 117,437 | 120,521 | |
| Total Debt | 21,742 | 20,091 | 19,487 | 17,308 | 37,533 | |
| Net Debt | 3,496 | 2,640 | -7,489 | -7,487 | 15,051 | |
| Total liabilities | 60,901 | 58,818 | 65,374 | 62,434 | 71,174 | |
| Total Shareholders’ Equity | 43,812 | 44,931 | 49,871 | 54,960 | 49,260 | |
| Net Operating Cash Flow | 4,561 | 2,774 | 5,804 | 6,321 | -1,000 | |
| Capital Expenditure | 1,729 | 2,110 | 4,145 | 3,316 | 6,036 | |
| Net Investing Cash Flow | -1,152 | -1,170 | 4,923 | -4,012 | -7,107 | |
| Net Financing Cash Flow | -2,267 | -2,658 | -1,426 | -4,148 | 5,905 | |
| Free Cash Flow | 2,832 | 664 | 1,659 | 3,005 | -4,146 | |
| ROA (%) | -0.22 | 1.12 | 4.83 | 5.08 | 6.04 | |
| ROE (%) | -0.53 | 2.63 | 11.17 | 11.27 | 13.79 | |
| EPS (Yen) | -5.2 | 25.8 | 117.0 | 130.3 | 147.0 | 168.2 |
| BPS (Yen) | 970.4 | 993.9 | 1,101.3 | 1,212.0 | 1,001.1 | |
| Dividend per Share (Yen) | 13.00 | 15.00 | 37.00 | 42.00 | 55.00 | 68.00 |
| Shares Outstanding (Million shares) | 45.66 | 45.66 | 45.66 | 45.66 | 53.38 |
Source: Omega Investment from company materials
Share price

Quarterly topics
【Financial highlights】
【 Analysis of changes in operating profits】
Source: Company material
【 Performance in each segment 】
【Earnings forecast for FY ending December 2025】
Source: Company material
【Shareholder returns】
Source: Company material
【Earnings forecast for FY2025 in the Medium-term Management Plan】
Source: Company material
Financial data (quarterly basis)
| Unit: million yen | 2023/12 | 2024/12 | 2025/12 | ||||||
| 3Q | 4Q | 1Q | 2Q | 3Q | 4Q | 1Q | 2Q | 3Q | |
| (Income Statement) | |||||||||
| Sales | 28,667 | 36,128 | 40,918 | 31,592 | 29,613 | 36,337 | 42,744 | 36,500 | 33,214 |
| Year-on-year | 9.4% | 8.3% | 10.7% | 1.2% | 3.3% | 0.6% | 4.5% | 15.5% | 12.2% |
| Cost of Goods Sold (COGS) | 17,483 | 22,090 | 24,545 | 19,888 | 17,644 | 21,182 | 23,993 | 21,381 | 19,671 |
| Gross Income | 11,184 | 14,038 | 16,373 | 11,704 | 11,969 | 15,155 | 18,751 | 15,119 | 13,543 |
| Gross Income Margin | 39.0% | 38.9% | 40.0% | 37.0% | 40.4% | 41.7% | 43.9% | 41.4% | 40.8% |
| SG&A Expense | 11,006 | 12,694 | 10,333 | 10,878 | 11,029 | 12,883 | 11,328 | 11,915 | 12,556 |
| EBIT (Operating Income) | 178 | 1,344 | 6,040 | 826 | 940 | 2,272 | 7,423 | 3,204 | 987 |
| Year-on-year | -162.2% | 171.5% | 26.4% | -62.8% | 428.1% | 69.0% | 22.9% | 287.9% | 5.0% |
| Operating Income Margin | 0.6% | 3.7% | 14.8% | 2.6% | 3.2% | 6.3% | 17.4% | 8.8% | 3.0% |
| EBITDA | 910 | 2,079 | 6,753 | 1,582 | 1,684 | 3,166 | 8,189 | 4,055 | 2,373 |
| Pretax Income | 363 | 936 | 6,006 | 1,328 | 1,035 | 1,702 | 7,257 | 3,208 | 1,132 |
| Consolidated Net Income | 202 | 997 | 4,104 | 985 | 725 | 1,409 | 4,910 | 2,045 | 711 |
| Minority Interest | 0 | 0 | 2 | 1 | 11 | 25 | -6 | 2 | 10 |
| Net Income ATOP | 202 | 996 | 4,101 | 985 | 714 | 1,383 | 4,916 | 2,044 | 699 |
| Year-on-year | -227.0% | -44.0% | 24.4% | -30.2% | 253.5% | 38.9% | 19.9% | 107.5% | -2.1% |
| Net Income Margin | 0.7% | 2.8% | 10.0% | 3.1% | 2.4% | 3.8% | 11.5% | 5.6% | 2.1% |
| (Balance Sheet) | |||||||||
| Cash & Short-Term Investments | 23,292 | 24,795 | 24,751 | 28,513 | 30,536 | 22,482 | 24,296 | 25,288 | 21,847 |
| Total assets | 111,573 | 117,437 | 127,459 | 120,701 | 120,935 | 120,521 | 132,329 | 126,248 | 123,538 |
| Total Debt | 17,342 | 17,308 | 38,662 | 41,566 | 42,881 | 37,924 | 44,114 | 41,268 | 37,467 |
| Net Debt | -5,950 | -7,487 | 13,911 | 13,053 | 12,345 | 15,442 | 19,818 | 15,980 | 15,620 |
| Total liabilities | 57,730 | 62,434 | 81,595 | 73,584 | 73,305 | 71,174 | 80,689 | 72,262 | 68,583 |
| Total Shareholders’ Equity | 53,800 | 54,960 | 45,818 | 47,068 | 47,571 | 49,260 | 51,562 | 53,908 | 54,864 |
| (Profitability %) | |||||||||
| ROA | 6.09 | 5.08 | 5.52 | 5.41 | 5.85 | 6.04 | 6.16 | 7.34 | 7.40 |
| ROE | 13.12 | 11.27 | 13.76 | 12.51 | 13.41 | 13.79 | 16.43 | 17.94 | 17.66 |
| (Per-share) Unit: JPY | |||||||||
| EPS | 4.5 | 22.0 | 85.7 | 20.0 | 14.5 | 28.1 | 99.9 | 41.4 | 14.1 |
| BPS | 1,186.4 | 1,212.0 | 933.1 | 956.6 | 966.8 | 1,001.1 | 1,047.9 | 1,091.1 | 1,110.4 |
| Dividend per Share | 0.00 | 42.00 | 0.00 | 0.00 | 0.00 | 55.00 | 0.00 | 0.00 | 0.00 |
| Shares Outstanding (million shares) | 45.66 | 45.66 | 53.38 | 53.38 | 53.38 | 53.38 | 53.38 | 53.38 | 53.38 |
Source: Omega Investment from company materials
Financial data (full-year basis)
| Unit: million yen | 2014/12 | 2015/12 | 2016/12 | 2017/12 | 2018/12 | 2019/12 | 2020/12 | 2021/12 | 2022/12 | 2023/12 | 2024/12 |
| (Income Statement) | |||||||||||
| Sales | 102,993 | 106,516 | 101,684 | 108,684 | 118,700 | 122,174 | 116,210 | 115,905 | 123,324 | 132,985 | 138,460 |
| Year-on-year | -0.5% | 3.4% | -4.5% | 6.9% | 9.2% | 2.9% | -4.9% | -0.3% | 6.4% | 7.8% | 4.1% |
| Cost of Goods Sold | 66,858 | 68,424 | 65,071 | 70,012 | 77,479 | 80,712 | 74,536 | 74,186 | 77,575 | 80,744 | 83,259 |
| Gross Income | 36,135 | 38,092 | 36,613 | 38,672 | 41,221 | 41,462 | 41,674 | 41,719 | 45,749 | 52,241 | 55,201 |
| Gross Income Margin | 35.1% | 35.8% | 36.0% | 35.6% | 34.7% | 33.9% | 35.9% | 36.0% | 37.1% | 39.3% | 39.9% |
| SG&A Expense | 33,711 | 33,949 | 33,862 | 35,761 | 39,336 | 40,776 | 40,089 | 39,158 | 41,167 | 43,717 | 45,123 |
| EBIT (Operating Income) | 2,424 | 4,143 | 2,751 | 2,911 | 1,885 | 686 | 1,585 | 2,561 | 4,582 | 8,524 | 10,078 |
| Year-on-year | -40.5% | 70.9% | -33.6% | 5.8% | -35.2% | -63.6% | 131.0% | 61.6% | 78.9% | 86.0% | 18.2% |
| Operating Income Margin | 2.4% | 3.9% | 2.7% | 2.7% | 1.6% | 0.6% | 1.4% | 2.2% | 3.7% | 6.4% | 7.3% |
| EBITDA | 5,055 | 6,551 | 5,316 | 5,551 | 4,615 | 4,436 | 5,603 | 6,148 | 7,821 | 11,417 | 13,185 |
| Pretax Income | 3,171 | 4,246 | 2,918 | 3,401 | 3,083 | 938 | 1,277 | 1,523 | 8,372 | 8,378 | 10,071 |
| Consolidated Net Income | 2,355 | 4,631 | 1,850 | 2,442 | 1,744 | -579 | -355 | 933 | 5,181 | 5,907 | 7,223 |
| Minority Interest | 195 | 101 | -56 | 40 | 19 | -28 | -119 | -233 | -113 | 1 | 39 |
| Net Income ATOP | 2,160 | 4,530 | 1,907 | 2,402 | 1,725 | -550 | -235 | 1,166 | 5,294 | 5,905 | 7,183 |
| Year-on-year | -44.8% | 109.7% | -57.9% | 26.0% | -28.2% | -131.9% | -57.3% | -596.2% | 354.0% | 11.5% | 21.6% |
| Net Income Margin | 2.1% | 4.3% | 1.9% | 2.2% | 1.5% | -0.5% | -0.2% | 1.0% | 4.3% | 4.4% | 5.2% |
| (Balance Sheet) | |||||||||||
| Cash & Short-Term Investments | 22,132 | 21,533 | 19,839 | 19,977 | 16,529 | 17,030 | 18,246 | 17,451 | 26,976 | 24,795 | 22,482 |
| Total assets | 96,721 | 98,175 | 95,681 | 102,451 | 108,710 | 108,778 | 105,096 | 103,898 | 115,288 | 117,437 | 120,521 |
| Total Debt | 18,916 | 18,927 | 19,931 | 17,892 | 16,834 | 22,166 | 21,742 | 20,091 | 19,487 | 17,308 | 37,533 |
| Net Debt | -3,216 | -2,606 | 92 | -2,085 | 305 | 5,136 | 3,496 | 2,640 | -7,489 | -7,487 | 15,051 |
| Total liabilities | 53,532 | 50,864 | 50,275 | 54,997 | 61,200 | 62,940 | 60,901 | 58,818 | 65,374 | 62,434 | 71,174 |
| Total Shareholders’ Equity | 41,632 | 45,677 | 44,949 | 46,863 | 46,857 | 45,370 | 43,812 | 44,931 | 49,871 | 54,960 | 49,260 |
| (Cash Flow) | |||||||||||
| Net Operating Cash Flow | 5,715 | 4,522 | 5,073 | 3,565 | 1,384 | 3,586 | 4,561 | 2,774 | 5,804 | 6,321 | -1,000 |
| Capital Expenditure | 1,400 | 1,114 | 1,641 | 1,333 | 3,477 | 3,226 | 1,729 | 2,110 | 4,145 | 3,316 | 6,036 |
| Net Investing Cash Flow | -1,742 | -803 | -4,044 | -2,971 | -3,094 | -3,221 | -1,152 | -1,170 | 4,923 | -4,012 | -7,107 |
| Net Financing Cash Flow | -2,179 | -3,807 | -2,571 | -706 | -2,463 | 0 | -2,267 | -2,658 | -1,426 | -4,148 | 5,905 |
| Free Cash Flow | 4,315 | 3,408 | 3,664 | 2,342 | -1,924 | 635 | 2,832 | 664 | 1,659 | 3,005 | -4,146 |
| (Profitability %) | |||||||||||
| ROA | 2.25 | 4.65 | 1.97 | 2.42 | 1.63 | -0.51 | -0.22 | 1.12 | 4.83 | 5.08 | 6.04 |
| ROE | 5.22 | 10.38 | 4.21 | 5.23 | 3.68 | -1.19 | -0.53 | 2.63 | 11.17 | 11.27 | 13.79 |
| (Per-share) Unit: JPY | |||||||||||
| EPS | 42.8 | 91.6 | 40.1 | 52.7 | 37.8 | -12.1 | -5.2 | 25.8 | 117.0 | 130.3 | 147.0 |
| BPS | 825.8 | 953.5 | 986.8 | 1,028.9 | 1,027.4 | 995.8 | 970.4 | 993.9 | 1,101.3 | 1,212.0 | 1,001.1 |
| Dividend per Share | 13.00 | 13.00 | 13.00 | 13.00 | 13.00 | 13.00 | 13.00 | 15.00 | 37.00 | 42.00 | 55.00 |
| Shares Outstanding (million shares) | 52.14 | 52.14 | 52.14 | 52.14 | 45.61 | 45.66 | 45.66 | 45.66 | 45.66 | 45.66 | 53.38 |
Source: Omega Investment from company materials