2026-04-02
Home
Japanese

Omega Investment Co., Ltd.
SUMIDA CORPORATION (Company note – 3Q update)

| Share price (11/21) | ¥1,183 | Dividend Yield (12/25 CE) | 4.5 % |
| 52weeks high/low | ¥1,198/757 | ROE(12/24) | 1.0 % |
| Avg Vol (3 month) | 247.3 thou shrs | Operating margin (12/24) | 3.1 % |
| Market Cap | ¥39.17 bn | Beta (5Y Monthly) | 0.85 |
| Enterprise Value | ¥89.01 bn | Shares Outstanding | 33.109 mn shrs |
| PER (12/25 CE) | 12.2 X | Listed market | TSE Prime section |
| PBR (9/25 act) | 0.66 X |
| Click here for the PDF version of this page |
| PDF version |
We reconfirmed the strengthening of the earnings structure. There are signs of a recovery in the industrial field. Growth visibility is increasing through AI data center equipment and M&A.
◇ Highlights of 3Q FY12/2025 results: profitability improvements have taken hold
Sumida Corporation (the “Company”) announced its third-quarter results for the fiscal year ending December 2025 on October 31, 2025. Although revenue posted a slight YoY decline, operating profit, profit before income taxes, and profit attributable to owners of the parent all recorded substantial YoY increases. The effects of profitability improvements, including cost structure reforms, continue to manifest.
Cumulative revenue came to 108.07billion yen (down 1.3% YoY), operating profit was 5.48 billion yen (up 33.7% YoY), profit before income taxes for the quarter was 3.62 billion yen (up 115.4% YoY), and profit attributable to owners of the parent for the quarter was 2.67 billion yen (up 115.6% YoY). In the third quarter alone, revenue was 36.9 billion yen (up 1.2% YoY) and operating profit was 2.1 billion yen (up 19.8% YoY), resulting in higher revenue and profit.
The key points of these results are as follows.
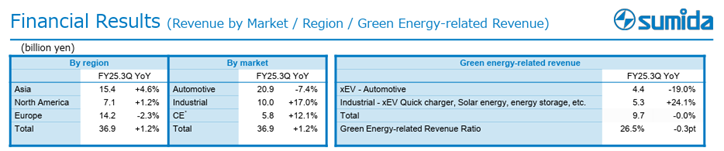
First, overall earnings trends were broadly in line with expectations, and there were some signs of improvement on the demand side. As in the second quarter, Automotive-related demand remained relatively weak, but Industrial and CE-related demand increased. In the Industry segment, in addition to xEV rapid chargers, batteries for data center applications in North America also acted as drivers. A recovery in the overall industrial equipment market has also begun to come into view. Revenue from green energy-related fields was 9.7 billion yen in the June–September period, marking a halt in the YoY decline.
Source: Company material
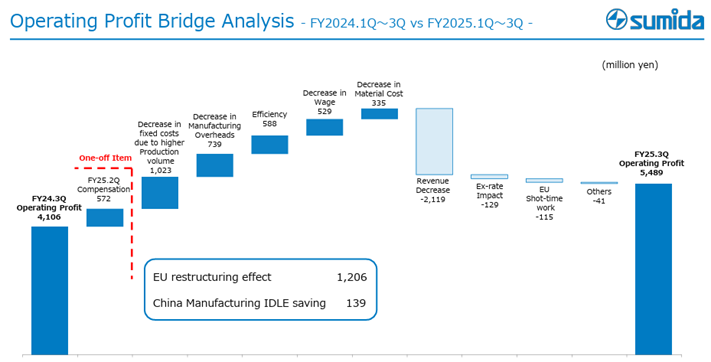
Second, cost structure reforms are progressing smoothly. As described below, the negative profit impact from lower revenue is offset by cost improvements. The business restructuring in Europe has been completed as planned, and efforts to optimize manufacturing overhead in China are also proceeding as planned. In addition, the Company has begun implementing additional measures, such as improving the efficiency of inspection operations through the use of AI.
Source: Company material
Third, there are no issues with inventory trends. Inventory turnover days were 79 days, flat YoY.
◇ FY12/2025 earnings forecast: unchanged
The full-year earnings forecast and dividend forecast have been left unchanged. Revenue is projected at 144.0 billion yen (flat YoY), operating profit at 7.0 billion yen (up 55.1% YoY), profit before income taxes at 4.08 billion yen (up 214.9% YoY), and profit attributable to owners of the parent at 3.2 billion yen (up 441.5% YoY). There is also no change in basic earnings per share of 96.83 yen and an annual dividend per share of 53 yen.
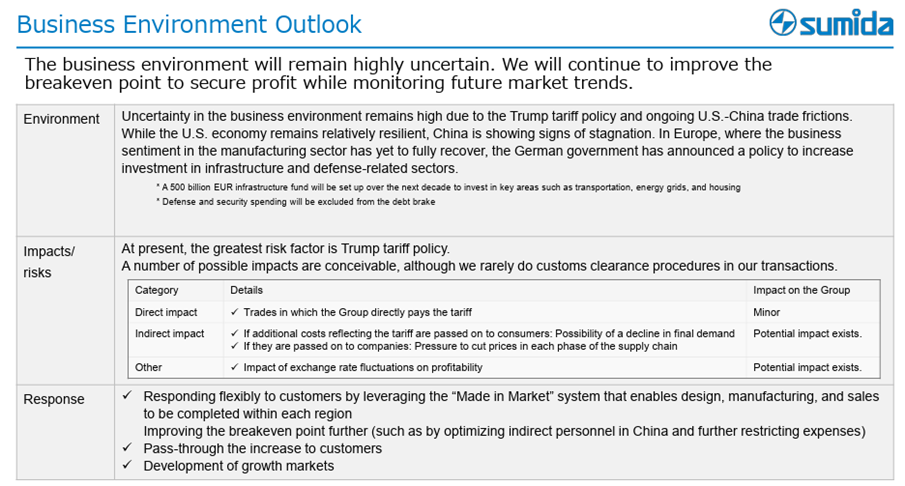
The fourth quarter is not typically a period in which the Company generates a large share of its annual profit. In addition, uncertainty remains regarding U.S. tariff policy, and there is potential for a negative impact. However, given that revenue is bottoming out, the yen is weaker than initially assumed, and cost control is being rigorously enforced, it is reasonable to consider that the full-year plan is within reach.
Source: Company material
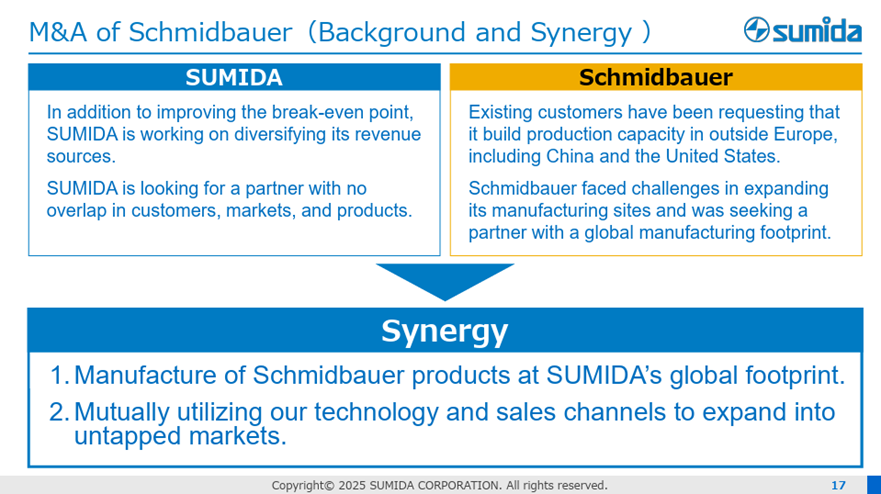
◇ Acquisition of Schmidbauer: accelerating the growth strategy
On August 25, 2025, the Company decided to acquire 80% of the outstanding shares of Germany’s Schmidbauer and completed payment of the consideration on October 1, 2025.
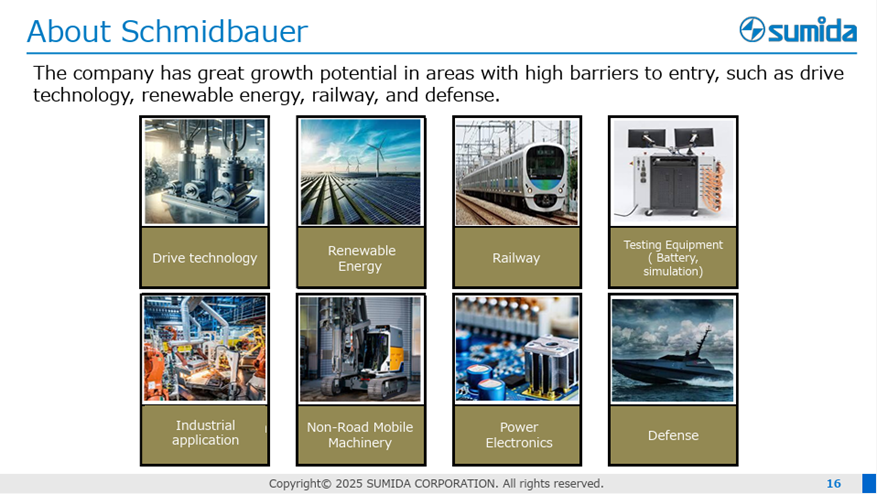
Schmidbauer has a stable track record of transactions with major heavy electrical equipment companies in Europe, and specializes in the development, manufacture, and sale of large coils for industrial fields such as wind power generation, solar power, energy storage, railways, testing equipment, marine vessels, and defense.
This transaction is expected to reinforce the Company’s growth strategy. In addition to Europe, Schmidbauer’s customers sought to establish manufacturing and supply structures in regions such as the U.S. and China, but Schmidbauer was unable to meet these needs. Following this transaction, however, the Company will be able to make effective use of Sumida’s manufacturing bases, which should facilitate the acquisition of new projects. Furthermore, cross-selling of the two companies’ products and cost synergies are also expected. It should be noted that there is no overlap between the two companies’ business domains.
Although the impact on this fiscal year’s earnings is said to be minor, we would like to see detailed disclosure of the effects on the balance sheet, as well as on profit and cash flow, at the next earnings briefing.
Source: Company material
◇ Potential of the Company’s products in the data center field
As suggested by these results, the potential for the Company’s products in the active data center field is increasing.
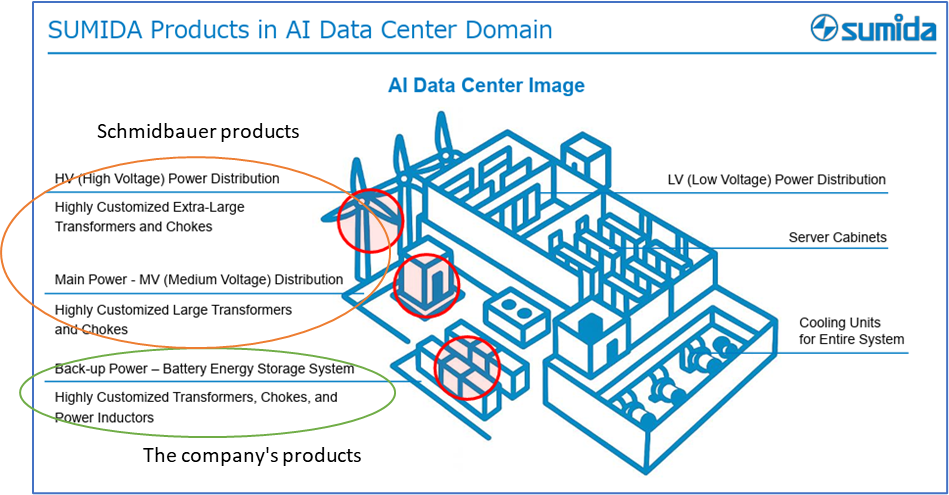
Source: Company documents with our notes
The Company has strengths in the lower-left area of the chart, namely sub-power supplies—battery storage and backup power supplies. In contrast, Schmidbauer’s strong fields are in the upper-left area, namely high-voltage power distribution and main power supplies. After the acquisition, the Company has positioned itself to reap substantial benefits from future increases in investment in AI data centers.
◇ Stock price trends and points to watch going forward
The Company’s stock price has been on a steady upward trend since the announcement of its first-quarter FY12/2025 results, and is currently approaching the 1,200-yen level. From a longer-term perspective, it is also supported by a gentle upward trendline that has been in place since 2012. Behind this are factors such as PBR around 0.67x, steady progress in cost-structure reforms, and sustained efforts in green energy-related fields, which have high medium-term growth potential. On the other hand, a resistance line emanating from the 2017 high of 2,400 yen has also formed, and the stock price is trading within a large symmetrical triangle.
Accordingly, the key point to watch going forward will be whether PBR exceeds 1x and the stock price breaks out of the triangle pattern to the upside. The main points to focus on in the full-year results are as follows.
- Achievement of the full-year earnings forecast: whether the Company will achieve the forecasted earnings.
- FY12/2026 earnings forecast: the industrial market is growing in FA, industrial equipment, xEV rapid chargers, and AI data center-related areas, and the consumer market is also showing growth in mobile phones and AI-equipped PCs, while the effects of the Schmidbauer acquisition are expected. Cost structure reforms will also continue. As a result, despite uncertainties such as U.S. tariff policy, regional differences in stance toward green energy markets, and exchange rate trends, the key question will be whether the Company can achieve higher revenue and profit.
- Trends in acquired projects: the amount of acquired projects is scheduled to be updated in the full-year results. This indicates medium-term upside potential in earnings, the recovery of ROE, and its subsequent stabilization at a high level, and is seen as a potential trigger for the stock price to break out of the triangle pattern to the upside, attracting considerable attention. We hope that the likelihood of achieving the specific numerical targets set out in the new Mid-Term Business Plan—such as revenue of 190.0 billion yen, operating profit of 13.5 billion yen, and EPS of 272 yen—will increase.
In addition, attention must be paid to fluctuations in exchange rates and in the prices of key raw materials, such as copper.
Company profile
Since its founding in 1950, the Company has been a global leader in the design and manufacture of coil-related components and modules. Leveraging strengths such as advanced technical design capabilities cultivated through many years of experience, proprietary manufacturing know-how, the ability to expand into a wide range of applications, and a solid global production structure, the Company is developing a custom-made contract manufacturing business for major customers around the world under a “Made in Market” model. A well-balanced, decentralized portfolio characterizes the Company’s business across both geography and market segments.
In recent years, the Company has grown its earnings in “green energy-related” fields. However, the business environment is currently in a lull, and there are many uncertainties, including tariff issues. Nevertheless, the Company has moved quickly to strengthen its cost structure and is steadily delivering results. Moreover, new pillars of growth, such as expanding demand in the AI data center field and the acquisition of Schmidbauer, are beginning to fall into place.
Going forward, the key point to watch will be whether “green energy-related” fields, while broadening their base, will drive the Company’s earnings, whether as a result, its operating profit margin and ROE will increase toward the levels assumed in the Mid-Term Business Plan, and, in turn, whether PBR will exceed 1x.
Key financial data
| Unit: million yen | 2020 | 2021 | 2022 | 2023 | 2024 | 2025 CE |
| Sales | 84,417 | 104,920 | 138,600 | 147,672 | 143,978 | 144,000 |
| EBIT (Operating Income) | 2,300 | 5,669 | 7,983 | 8,829 | 5,633 | |
| Pretax Income | 1,470 | 3,898 | 6,534 | 5,856 | 1,295 | |
| Net Profit Attributable to Owner of Parent | 828 | 2,629 | 5,099 | 5,064 | 590 | 3,200 |
| Cash & Short-Term Investments | 5,237 | 4,237 | 2,944 | 3,107 | 4,286 | |
| Total assets | 98,063 | 117,725 | 134,846 | 142,786 | 147,766 | |
| Total Debt | 44,586 | 54,763 | 58,546 | 57,198 | 57,975 | |
| Net Debt | 39,349 | 50,526 | 55,602 | 54,091 | 53,689 | |
| Total liabilities | 63,503 | 77,622 | 85,966 | 85,471 | 86,849 | |
| Total Shareholders’ Equity | 32,990 | 38,338 | 46,829 | 55,056 | 58,648 | |
| Net Operating Cash Flow | 9,107 | 600 | 10,566 | 18,343 | 14,928 | |
| Capital Expenditure | 6,765 | 6,737 | 9,174 | 10,914 | 9,005 | |
| Net Investing Cash Flow | -6,669 | -6,712 | -8,174 | -10,702 | -8,834 | |
| Net Financing Cash Flow | -447 | 4,751 | -4,130 | -7,782 | -5,268 | |
| Free Cash Flow | 3,118 | -5,212 | 2,362 | 8,539 | 7,068 | |
| ROA (%) | 0.85 | 2.44 | 4.04 | 3.65 | 0.41 | |
| ROE (%) | 2.51 | 7.37 | 11.98 | 9.94 | 1.04 | |
| EPS (Yen) | 30.5 | 96.7 | 187.5 | 167.4 | 17.9 | 96.8 |
| BPS (Yen) | 1,213.7 | 1,409.8 | 1,722.1 | 1,687.4 | 1,774.6 | |
| Dividend per Share (Yen) | 9.00 | 28.00 | 47.00 | 51.00 | 53.00 | 53.00 |
| Shares Outstanding (Million shares) | 27.44 | 27.44 | 27.44 | 32.88 | 33.10 |
Source: Omega Investment from company materials
Share price

Financial data (quarterly basis)
| Unit: million yen | 2023/12 | 2024/12 | 2025/12 | ||||||
| 3Q | 4Q | 1Q | 2Q | 3Q | 4Q | 1Q | 2Q | 3Q | |
| (Income Statement) | |||||||||
| Sales | 37,718 | 36,739 | 36,313 | 36,752 | 36,470 | 34,442 | 35,390 | 35,780 | 36,906 |
| Year-on-year | -2.7% | -2.4% | 2.1% | -2.4% | -3.3% | -6.3% | -2.5% | -2.6% | 1.2% |
| Cost of Goods Sold (COGS) | 31,752 | 32,584 | 32,014 | 32,263 | 31,656 | 30,037 | 31,007 | 30,524 | 31,618 |
| Gross Income | 5,966 | 4,155 | 4,299 | 4,489 | 4,814 | 4,405 | 4,383 | 5,256 | 5,288 |
| Gross Income Margin | 15.8% | 11.3% | 11.8% | 12.2% | 13.2% | 12.8% | 12.4% | 14.7% | 14.3% |
| SG&A Expense | 3,090 | 3,006 | 3,218 | 3,353 | 3,091 | 2,713 | 3,151 | 3,059 | 3,154 |
| EBIT (Operating Income) | 2,876 | 1,149 | 1,081 | 1,136 | 1,723 | 1,692 | 1,232 | 2,197 | 2,134 |
| Year-on-year | -8.5% | -56.3% | -51.1% | -56.2% | -40.1% | 47.3% | 14.0% | 93.4% | 23.9% |
| Operating Income Margin | 7.6% | 3.1% | 3.0% | 3.1% | 4.7% | 4.9% | 3.5% | 6.1% | 5.8% |
| EBITDA | 5,283 | 3,718 | 3,707 | 3,956 | 4,552 | 4,439 | 3,809 | 5,618 | 4,662 |
| Pretax Income | 1,426 | 387 | 464 | 268 | 951 | -389 | 802 | 1,372 | 1,455 |
| Consolidated Net Income | 1,060 | 757 | 313 | 114 | 710 | -703 | 580 | 1,053 | 965 |
| Minority Interest | -23 | 53 | -35 | -23 | -46 | -52 | -5 | -29 | -45 |
| Net Income ATOP | 1,083 | 702 | 348 | 137 | 756 | -652 | 585 | 1,082 | 1,010 |
| Year-on-year | -47.8% | -66.0% | -71.8% | -93.3% | -30.2% | -192.9% | 68.1% | 689.8% | 33.6% |
| Net Income Margin | 2.9% | 1.9% | 1.0% | 0.4% | 2.1% | -1.9% | 1.7% | 3.0% | 2.7% |
| (Balance Sheet) | |||||||||
| Cash & Short-Term Investments | 6,439 | 3,107 | 6,002 | 5,156 | 4,750 | 4,286 | 6,087 | 5,429 | 12,256 |
| Total assets | 149,591 | 142,786 | 152,361 | 159,600 | 143,335 | 147,766 | 144,110 | 142,062 | 151,308 |
| Total Debt | 57,166 | 57,198 | 63,785 | 65,509 | 58,303 | 57,975 | 58,367 | 57,039 | 62,193 |
| Net Debt | 50,727 | 54,091 | 57,783 | 60,353 | 53,553 | 53,689 | 52,280 | 51,610 | 49,937 |
| Total liabilities | 85,870 | 85,471 | 92,128 | 95,474 | 85,403 | 86,849 | 85,709 | 83,098 | 90,181 |
| Total Shareholders’ Equity | 61,426 | 55,056 | 57,875 | 61,653 | 55,751 | 58,648 | 56,205 | 56,801 | 58,947 |
| (Profitability %) | |||||||||
| ROA | 4.41 | 3.65 | 2.89 | 1.46 | 1.33 | 0.41 | 0.56 | 1.17 | 1.38 |
| ROE | 11.79 | 9.94 | 7.90 | 3.74 | 3.32 | 1.04 | 1.45 | 2.99 | 3.53 |
| (Per-share) Unit: JPY | |||||||||
| EPS | 33.2 | 21.5 | 10.7 | 4.2 | 22.9 | -19.7 | 17.7 | 32.7 | 30.6 |
| BPS | 1,882.6 | 1,687.4 | 1,773.8 | 1,867.5 | 1,687.0 | 1,774.6 | 1,700.6 | 1,718.1 | 1,783.0 |
| Dividend per Share | 0.00 | 28.00 | 0.00 | 26.00 | 0.00 | 27.00 | 0.00 | 26.00 | 0.00 |
| Shares Outstanding (million shares) | 32.88 | 32.88 | 32.88 | 33.04 | 33.10 | 33.10 | 33.10 | 33.11 | 33.11 |
Source: Omega Investment from company materials
Financial data (full-year basis)
| Unit: million yen | 2015 | 2016 | 2017 | 2018 | 2019 | 2020 | 2021 | 2022 | 2023 | 2024 |
| (Income Statement) | ||||||||||
| Sales | 86,236 | 81,052 | 90,153 | 97,538 | 94,283 | 84,417 | 104,920 | 138,600 | 147,672 | 143,978 |
| Year-on-year | 11.2% | -6.0% | 11.2% | 8.2% | -3.3% | -10.5% | 24.3% | 32.1% | 6.5% | -2.5% |
| Cost of Goods Sold | 71,628 | 66,191 | 75,019 | 82,192 | 81,414 | 73,319 | 89,563 | 119,298 | 126,561 | 125,970 |
| Gross Income | 14,608 | 14,861 | 15,134 | 15,346 | 12,869 | 11,098 | 15,357 | 19,302 | 21,111 | 18,008 |
| Gross Income Margin | 16.9% | 18.3% | 16.8% | 15.7% | 13.6% | 13.1% | 14.6% | 13.9% | 14.3% | 12.5% |
| SG&A Expense | 10,371 | 8,507 | 8,837 | 9,694 | 9,330 | 8,798 | 9,688 | 11,319 | 12,282 | 12,375 |
| EBIT (Operating Income) | 4,237 | 6,354 | 6,297 | 5,652 | 3,539 | 2,300 | 5,669 | 7,983 | 8,829 | 5,633 |
| Year-on-year | 26.7% | 50.0% | -0.9% | -10.2% | -37.4% | -35.0% | 146.5% | 40.8% | 10.6% | -36.2% |
| Operating Income Margin | 4.9% | 7.8% | 7.0% | 5.8% | 3.8% | 2.7% | 5.4% | 5.8% | 6.0% | 3.9% |
| EBITDA | 8,443 | 9,251 | 9,574 | 9,660 | 8,848 | 8,247 | 12,337 | 16,103 | 18,190 | 16,655 |
| Pretax Income | 2,932 | 5,469 | 5,697 | 4,061 | 2,184 | 1,470 | 3,898 | 6,534 | 5,856 | 1,295 |
| Consolidated Net Income | 2,188 | 3,844 | 4,628 | 2,531 | 1,596 | 839 | 2,695 | 5,168 | 5,102 | 434 |
| Minority Interest | 156 | 178 | 123 | 110 | 13 | 11 | 66 | 68 | 37 | -156 |
| Net Income ATOP | 2,032 | 3,666 | 4,504 | 2,420 | 1,582 | 828 | 2,629 | 5,099 | 5,064 | 590 |
| Year-on-year | 51.0% | 80.4% | 22.9% | -46.3% | -34.6% | -47.7% | 217.5% | 94.0% | -0.7% | -88.3% |
| Net Income Margin | 2.4% | 4.5% | 5.0% | 2.5% | 1.7% | 1.0% | 2.5% | 3.7% | 3.4% | 0.4% |
| (Balance Sheet) | ||||||||||
| Cash & Short-Term Investments | 3,569 | 3,546 | 5,375 | 4,098 | 3,286 | 5,237 | 4,237 | 2,944 | 3,107 | 4,286 |
| Total assets | 67,876 | 69,007 | 84,366 | 94,277 | 96,561 | 98,063 | 117,725 | 134,846 | 142,786 | 147,766 |
| Total Debt | 33,879 | 30,611 | 35,836 | 40,206 | 43,646 | 44,586 | 54,763 | 58,546 | 57,198 | 57,975 |
| Net Debt | 30,310 | 27,065 | 30,461 | 36,108 | 40,360 | 39,349 | 50,526 | 55,602 | 54,091 | 53,689 |
| Total liabilities | 49,207 | 46,982 | 54,242 | 58,835 | 61,963 | 63,503 | 77,622 | 85,966 | 85,471 | 86,849 |
| Total Shareholders’ Equity | 17,411 | 20,629 | 28,570 | 33,829 | 33,013 | 32,990 | 38,338 | 46,829 | 55,056 | 58,648 |
| (Cash Flow) | ||||||||||
| Net Operating Cash Flow | 5,515 | 8,291 | 3,658 | 4,672 | 8,732 | 9,107 | 600 | 10,566 | 18,343 | 14,928 |
| Capital Expenditure | 4,448 | 5,024 | 9,511 | 9,610 | 8,302 | 6,765 | 6,737 | 9,174 | 10,914 | 9,005 |
| Net Investing Cash Flow | -4,366 | -4,961 | -9,254 | -15,153 | -8,133 | -6,669 | -6,712 | -8,174 | -10,702 | -8,834 |
| Net Financing Cash Flow | -1,054 | -3,016 | 7,389 | 9,477 | -1,261 | -447 | 4,751 | -4,130 | -7,782 | -5,268 |
| Free Cash Flow | 1,137 | 3,941 | -5,173 | -3,769 | 1,379 | 3,118 | -5,212 | 2,362 | 8,539 | 7,068 |
| (Profitability ) | ||||||||||
| ROA (%) | 2.95 | 5.36 | 5.87 | 2.71 | 1.66 | 0.85 | 2.44 | 4.04 | 3.65 | 0.41 |
| ROE (%) | 11.98 | 19.27 | 18.31 | 7.76 | 4.74 | 2.51 | 7.37 | 11.98 | 9.94 | 1.04 |
| Net Margin (%) | 2.36 | 4.52 | 5.00 | 2.48 | 1.68 | 0.98 | 2.51 | 3.68 | 3.43 | 0.41 |
| Asset Turn | 1.25 | 1.18 | 1.18 | 1.09 | 0.99 | 0.87 | 0.97 | 1.10 | 1.06 | 0.99 |
| Assets/Equity | 4.07 | 3.60 | 3.12 | 2.86 | 2.86 | 2.95 | 3.03 | 2.97 | 2.72 | 2.56 |
| (Per-share) Unit: JPY | ||||||||||
| EPS | 87.5 | 157.9 | 176.4 | 90.2 | 58.3 | 30.5 | 96.7 | 187.5 | 167.4 | 17.9 |
| BPS | 750.1 | 888.8 | 1,069.6 | 1,250.0 | 1,216.1 | 1,213.7 | 1,409.8 | 1,722.1 | 1,687.4 | 1,774.6 |
| Dividend per Share | 26.00 | 34.00 | 45.00 | 27.00 | 24.00 | 9.00 | 28.00 | 47.00 | 51.00 | 53.00 |
| Shares Outstanding (million shares) | 23.94 | 23.94 | 27.44 | 27.44 | 27.44 | 27.44 | 27.44 | 27.44 | 32.88 | 33.10 |
Source: Omega Investment from company materials