2026-04-10
Home
Japanese

Omega Investment Co., Ltd.
Human Creation Holdings (Investment report – 4Q update)
| Share price (12/23) | ¥1,290 | Dividend Yield (26/9 CE) | 3.4 % |
| 52weeks high/low | ¥943/1,420 | ROE(25/9) | 28.0 % |
| Avg Vol (3 month) | 7.4 thou shrs | Operating margin (25/9) | 8.7 % |
| Market Cap | ¥4.61 bn | Beta (5Y Monthly) | 0.45 |
| Enterprise Value | ¥3.75 bn | Shares Outstanding | 3.573 mn shrs |
| PER (26/9 CE) | 9.2 X | Listed market | TSE Growth |
| PBR (25/9 act) | 2.7 X |
| Click here for the PDF version of this page |
| PDF version |
High growth and high ROE driven by the strategic domains. An attractive entry point.
◇ Investment conclusion
The stock price valuation of Human Creation Holdings, Inc. (hereinafter, the company) is at a level that allows medium- to long-term investors to consider new and additional investments. In the results for FY9/2025, the company continued to achieve high growth with net sales of 8.945 billion yen (+24.8% YoY), operating profit of 781 million yen (+23.9% YoY), and EPS of 125.96 yen, and given its high capital efficiency with ROE of 28.1% and ROIC of 20.3%, the current situation in which the PER remains below 10 times for a growing company with this level of profitability can be assessed as a clear discount.
The main reasons for the PER discount are thought to be that, despite the high earnings growth, the market is conscious of (1) a conservative view toward business expansion involving M&A, (2) caution regarding profit volatility in the strategic domains and the burden of goodwill amortization, (3) concerns about stock liquidity because it is a small-cap stock, and (4) a gap versus investor expectations regarding the levels of the dividend payout ratio and share buybacks. In fact, in FY9/2025, while operating profit and ordinary profit increased significantly thanks to the strong performance of the core business, the company recorded valuation losses on investment securities of 77 million yen, resulting in a slight decrease in net income attributable to owners of the parent. It is presumed that the market was left with the impression that results are easily affected by one-off factors. In addition, the increase in interest-bearing debt accompanying aggressive M&A and the rapid pace of balance sheet expansion are also creating a cautious stance regarding the sustainability of its high growth and how long it can be maintained.
On the other hand, such concerns are also the reverse side of the company’s growth orientation and high-profitability model. While securing stable cash flow from the SES business (engineer staffing), the company is building a two-layer structure that accumulates high-value-added projects in strategic domains such as IT consulting, contracted development, and M&A intermediation, and operating cash flow has increased significantly to 1.029 billion yen. Using this cash as a source of funds, the company is simultaneously carrying out growth investments and strengthening its business base, including the acquisition of the M&A intermediation business by subsidiary HC Financial Advisor, and the recognition of subsidiary Asset Consulting Force Co., Ltd. (ACF) as an “Associate Partner” of NTT DATA and as an AWS Select Tier Services Partner. While maintaining high ROE and high growth, management secures net cash of 273 million yen. The total payout ratio is already in the 60% range, so if the gap with the market narrows through further increases in the dividend payout ratio and the level of share buybacks, there is substantial room for a re-rating above 10 times PER. As a result, given the stock’s restrained volatility and beta of 0.64, the current valuation is an attractive entry point for medium- to long-term investors.
◇ FY9/2025 results highlights: higher sales and profits driven by rapid expansion in the strategic domains, with further strengthening of the core earnings power
In FY9/2025, following the expansion of the strategic domains business, the company achieved strong growth in both sales and profits, significantly enhancing the earnings power of its core business. Consolidated net sales were 8.945 billion yen (+24.8% YoY), operating profit was 781 million yen (+23.9% YoY), and ordinary profit was 773 million yen (+22.8% YoY), all exceeding both the initial and the upwardly revised company forecasts. Net income attributable to owners of the parent decreased slightly to 398 million yen (-1.4% YoY), primarily due to valuation losses on investment securities of 77 million yen. The trend on the operating side is clearly one of increasing profits.
By segment, net sales of the strategic domains business, which encompasses consulting and contracted development, increased sharply to 3.642 billion yen (+66.3% YoY), and its weight rose to about 40% of consolidated net sales. The background was the consolidation of HC Financial Advisor in April 2025 and the contribution throughout the full year from the accumulation of DX solution projects for SMBs (medium-sized and small companies).
Full-year net sales of products for SMBs totaled 2.1 billion yen, the number of active projects at fiscal year-end was 68, and the customer continuation rate into the following fiscal year was 65.4%, indicating that a growth structure supported by continuation and multifaceted rollouts is forming. Meanwhile, net sales of the SES business, which is a stable earnings source, increased steadily to 5.303 billion yen (+6.6% YoY). The number of SES personnel in operation was 705 person-months, and the contract unit price rose to 667,000 yen per month, reflecting progress in shifting engineers upstream and optimizing unit prices.
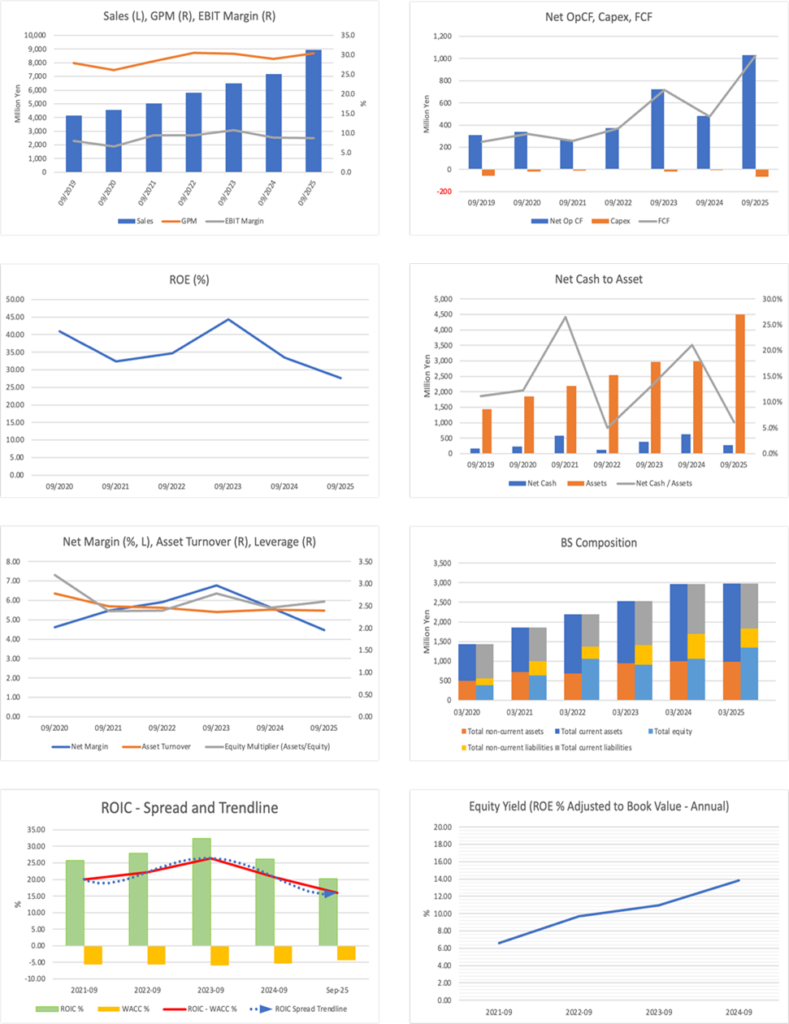
From a profitability perspective, EBITDA grew to 953 million yen (+25.6% YoY), outpacing operating profit growth, and the company steadily strengthened its cash generation capacity, including through goodwill amortization and other factors. Operating cash flow increased roughly twice the previous year’s level, and, using this as the primary source of funds, the company made M&A and growth investments. In contrast, the balance of cash and cash equivalents at fiscal year-end totaled 1.417 billion yen. While total assets expanded to 4.495 billion yen, the equity ratio remained at 33.5%, and ROE remained extremely high at 28.1%. The total payout ratio was high at 63.8%, confirming that the company continues to allocate capital while balancing growth investments and shareholder returns.
In FY9/2025, the combination of high growth in the strategic domains and stable growth in SES produced high-quality results, with sales, profits, cash flow, and ROE all at high levels. The pause in net income was a one-off factor related to valuation losses, and business momentum has rather strengthened.
More important than the headline EPS growth rate in these results is the improvement in the quality of the business portfolio through the expansion of strategic domains and higher SES unit prices. It is not appropriate to view the slight decline in net income due to the recognition of valuation losses as a slowdown in growth; instead, given the levels of EBITDA, operating cash flow, and ROE, it can be concluded that a model of aggressively driving growth while generating earnings is emerging. Going forward, it will be effective to adopt an evaluation stance that monitors how long the high growth of the strategic domains can be sustained while paying attention to capital allocation and the sustainability of shareholder returns.
◇ Segment analysis: a two-layer structure combining stable earnings from SES with high growth in the strategic domains
The company’s business segments consist of “SES business” and “strategic domains business.” Of consolidated net sales of 8.945 billion yen in FY9/2025, the SES business recorded 5.303 billion yen (+6.6% YoY) and the strategic domains business recorded 3.642 billion yen (+66.3% YoY), forming a portfolio that combines stable earnings with high growth.
The SES business is centered on engineering staffing, mainly at Brain Knowledge Systems and other group companies. It undertakes the development and maintenance of core and operational systems for a wide range of industries, including finance, manufacturing, distribution, and telecommunications. In FY9/2025, the average number of SES personnel in operation was 705 person-months for the full year, and the contract unit price was 667,000 yen per month, both of which increased. By increasing the proportion of project leaders and systems engineers, the ratio of upstream processes is rising, and together with unit price revisions, this is contributing to improved profitability. With a sales mix of around 60%, this business offers resilience against economic fluctuations and a stable cash flow base.
The strategic domains business is a segment that brings together ACF’s IT and DX consulting, system contracted development and operations, and marketing support, as well as contracted projects at Brain Knowledge Systems and M&A intermediation handled by HC Financial Advisor. In FY9/2025, solutions for SMBs (medium-sized and small companies) drove growth, with full-year net sales of SMB products totaling 2.1 billion yen and the number of active projects in Q4 reaching 68. The customer continuation rate into the following fiscal year was 65.4%, the prime contract ratio was 53.4%, and the average number of projects per customer was 3.0, indicating that a highly recurring earnings base premised on customer continuations and multifaceted rollouts is forming.
In addition, HC Financial Advisor in August 2025 acquired the M&A intermediation business from Growthix Inc., thereby strengthening deal coverage for medium-sized and small companies throughout Japan. ACF was recognized in October 2025 as an “Associate Partner” of NTT DATA and, in the same month, as an AWS “Select Tier Services Partner,” thereby establishing a position that enables it to more easily win DX and cloud projects in collaboration with major system integrators and cloud vendors. Through such initiatives, the strategic domains business is increasingly becoming the company’s growth driver, and it is evident that the company is now in a phase of nurturing it into a pillar that will rival the SES business in profitability.
◇ Earnings forecasts: plan for FY9/2026 to prioritize growth investment with double-digit sales growth and flat profits
FY9/2026 will be a “foundation-building year” in which the company maintains double-digit sales growth while keeping the profit level almost flat. The company’s plan calls for net sales of 10.005 billion yen (+11.8% YoY), operating profit of 785 million yen (+0.5% YoY), ordinary profit of 779 million yen (+0.7% YoY), net income attributable to owners of the parent of 436 million yen (+9.5% YoY), and EPS of 141.08 yen. Compared with FY9/2025, while firmly increasing the top line, the plan is designed to restrain operating profit growth and prioritize medium-term growth investments.
By segment, the company forecasts net sales of 4.520 billion yen for the strategic domains business and 5.484 billion yen for the SES business. The growth drivers will remain the strategic domains, and the plan assumes expansion in high-value-added services such as DX for SMBs and M&A intermediation. For SES, while maintaining improvements in unit prices and the personnel class mix, the company assumes a conservative increase in headcount, reflecting a stable-growth assumption. The company plans EBITDA of 1.022 billion yen, an increase of just over 7% YoY, thus assuming a slight increase in cash generation capacity, including depreciation and goodwill amortization.
The reason for not significantly increasing profits is to prioritize the “further increase in the ratio of the strategic domains” and the “scaling up of business for SMBs” set out in the medium- to long-term management policy, and to strengthen personnel recruitment and development, product development, and group collaboration. Operating cash flow in FY9/2025 increased substantially, suggesting the company intends to reinvest primarily in M&A, system investments, and human resources enhancement while maintaining ROE in the 28% range.
Regarding dividends, the company forecasts an increase from the actual 27 yen in FY9/2025 to 44 yen, implying a payout ratio of 31.2%. After raising the total payout ratio (dividends plus share buybacks) to 63.8% in 2025, the company is expected to increase the dividend while treating share buybacks as a flexible tool, thereby balancing them with growth investments. Negative factors include pressure on earnings from increased recruiting and training expenses in strategic domains, delays in PMI following M&A, and changes in SMBs’ investment appetite, but stable earnings from SES and strong operating cash flow can serve as a cushion.
The plan for FY9/2026 may appear unsatisfactory if one looks only at short-term profit growth. Still, if the fiscal year is positioned as one for nurturing strategic domains, it is reasonable. Net sales are expected to maintain double-digit growth, EPS is projected to grow to 141 yen, and there is a strong likelihood that the high level of capital efficiency and cash generation capacity, with ROE around 28.1%, will be maintained. In the medium term, the key to revaluing the valuation multiple will be how much the sales and profits of the strategic domains can be increased, and to what extent the dividend payout ratio and the level of share buybacks approach market expectations.
◇ Stock price trends and points of focus going forward: a phase in which, although high ROE and the growth story are being recognized, a cautious stance continues because it is a small-cap stock
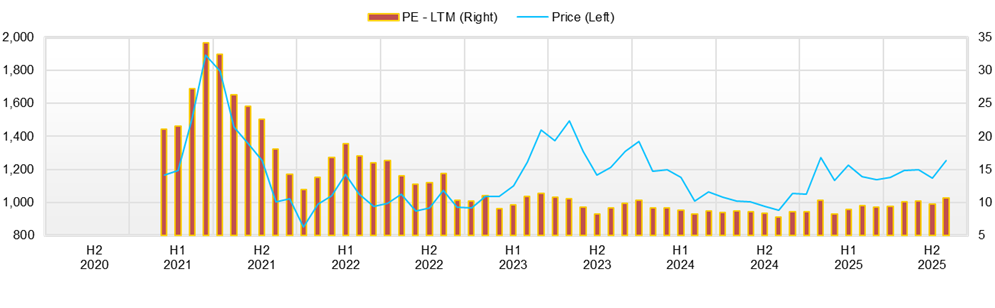
The company’s shares remain undervalued relative to the quality of its results and financial position, while investors continue to adopt a wait-and-see stance. The recent share price is in the low 1,300 yen range, with a market capitalization of about 4.6 billion yen, and can be summarized as implying a PER of 9.2 times and PBR of 2.67 times based on company forecasts, and a forecast dividend yield in the mid-3% range. With a ROE of 28.1% and a beta of 0.64, the stock is a small-cap name that, despite its high ROE, has relatively low volatility.
Looking at the share price movements, closing prices from August 1 to November 28, 2025, were generally within a range of the high 1,100 yen level to the low 1,300 yen level, with a low of 1,120 yen (August 15) and a high of 1,323 yen (November 28) over the past three months. In August–September, the stock traded in a range of 1,170–1,210 yen, and in October–November, there was little direction, though the lows have been gradually rising. From a technical perspective, around 1,140 yen is likely to be perceived as support, the recent high near 1,320 yen as resistance, and the current position as just before a test of the upper end of the range.
Looking at the relationship between news flow and the share price, over the past three months, despite a series of positive IR announcements such as the announcement on September 1 of the acquisition of the M&A intermediation business by HC Financial Advisor, the recognition on October 1 of ACF as an NTT DATA “Associate Partner,” and the recognition on October 23 as an AWS Select Tier Services Partner, the share price has been limited to small fluctuations in the 1,180–1,210 yen range and has not led to a significant trend change. After the release on November 14 of the full-year results and the medium- to long-term management policy briefing materials, the closing price rose by about 12.4%, from 1,177 yen on November 13 to 1,323 yen on November 28, indicating a clear response to events at which earnings and the growth story are presented together. In addition, with respect to the substantial shareholding reports by Hikari Tsushin, its stake has been raised stepwise from 5.09% in April 2025 to 6.15% in August and 6.39% in September, and the fact that a medium- to long-term oriented shareholder is consistently increasing its holdings can be regarded as a factor underpinning the stock in terms of supply and demand.
In terms of market evaluation, (1) profit volatility due to M&A and valuation losses on investment securities, (2) a cautious stance toward increases in goodwill and interest-bearing debt, and (3) a liquidity premium due to the stock being a small-cap are factors behind the discount. On the other hand, if increases in sales and profits for the strategic domains business continue every quarter, and KPIs (number of deals, number of deals closed, profit contribution, etc.) for M&A intermediation and DX projects are regularly disclosed, concerns about profit volatility are likely to ease gradually. Conditions that would make it easier to consider an overweight stance include (1) the ability to confirm the growth and profit margins of the strategic domains at each set of results, (2) the emergence of signals of accelerated growth such as full-year upward revisions or additional M&A and partnerships, and (3) the medium-term clarification of a target level for the total payout ratio, including share buybacks, in addition to the 44 yen dividend. As for investment timing, a realistic stance would be to confirm the direction of the growth story and capital policy at events such as results announcements, updates to the medium-term plan, and IR announcements on shareholder returns, and then look for medium- to long-term buying opportunities in phases in which there is a sense that initial reactions have run their course or there has been short-term consolidation after such events.
The current share price level can be assessed as one at which, given the high ROE, double-digit growth in operating profit, and a dividend yield in the mid-3% range, it is easy to continue holding the stock over the medium to long term while monitoring progress on the growth scenario. On the other hand, what the market truly wants to know is not so much the magnitude of growth as “how far stable profit growth can continue” and “how profits will be returned to shareholders.” If the track record in the strategic domains, cash flow, and consistency of the shareholder return policy accumulate with each set of results, there still appears to be considerable room for a revaluation of the company’s valuation multiple.
Company profile
An IT and DX-focused solution integrator that solves management issues
Human Creation Holdings, Inc. is a solution integrator that aims to solve corporate management issues centered on IT and DX, and is a group-type IT services company that, while its original business is engineering staffing, combines consulting and system-contracted development. Rather than being a simple SI or SES pure-play, under its corporate message of “creating answers,” it has built a business model that provides end-to-end services from upstream processes through to operations and maintenance for clients’ management issues.
The company was established in 2016 and had 914 consolidated employees as of September 30, 2025 (excluding temporary employees), with a workforce centered on IT engineers.
Its business consists of a holding company structure that has “supervision of group operating companies” as its stated business content. In practice, through its operating subsidiaries, it has four main pillars: (1) management consulting, (2) IT consulting, (3) system contracted development and operations, and (4) engineer staffing. Engineer staffing (SES), mainly at core subsidiary Brain Knowledge Systems and others, covers projects in a wide range of industries, including finance, manufacturing, distribution, telecommunications, public services, healthcare, and media, and serves as a stable earnings base with a high ratio of long-term clients.
Key financial data
| Unit: million yen | 2021 | 2022 | 2023 | 2024 | 2025 | 2026 CE |
| Sales | 5,035 | 5,803 | 6,487 | 7,166 | 8,946 | 10,005 |
| EBIT (Operating Income) | 478 | 545 | 698 | 631 | 782 | 785 |
| Pretax Income | 464 | 546 | 701 | 630 | 684 | |
| Net Profit Attributable to Owner of Parent | 276 | 343 | 438 | 404 | 398 | 436 |
| Cash & Short-Term Investments | 846 | 673 | 1,020 | 1,003 | 1,417 | |
| Total assets | 2,192 | 2,536 | 2,963 | 2,978 | 4,496 | |
| Total Debt | 266 | 546 | 641 | 376 | 1,143 | |
| Net Debt | -580 | -127 | -379 | -627 | -274 | |
| Total liabilities | 1,128 | 1,620 | 1,901 | 1,625 | 2,965 | |
| Total Shareholders’ Equity | 1,064 | 916 | 1,062 | 1,353 | 1,530 | |
| Net Operating Cash Flow | 268 | 373 | 723 | 481 | 1,030 | |
| Capital Expenditure | 11 | 3 | 17 | 7 | 64 | |
| Net Investing Cash Flow | -52 | -335 | -169 | -3 | -896 | |
| Net Financing Cash Flow | 44 | -212 | -206 | -496 | 282 | |
| Free Cash Flow | 257 | 370 | 717 | 475 | 1,023 | |
| ROA (%) | 13.63 | 14.51 | 15.95 | 13.60 | 10.66 | |
| ROE (%) | 32.43 | 34.65 | 44.34 | 33.47 | 27.64 | |
| EPS (Yen) | 71.6 | 94.6 | 132.4 | 123.1 | 126.0 | 141.0 |
| BPS (Yen) | 276.2 | 265.6 | 324.1 | 415.9 | 494.8 | |
| Dividend per Share (Yen) | 24.49 | 25.00 | 25.50 | 26.00 | 27.00 | 44.00 |
| Shares Outstanding (Million shares) | 3.85 | 3.85 | 3.85 | 3.57 | 3.57 |
Source: Omega Investment from company data, rounded to the nearest whole number.
Share price
Key stock price data
Financial data (quarterly basis)
| Unit: million yen | 2023/9 | 2024/9 | 2025/9 | ||||||
| 4Q | 1Q | 2Q | 3Q | 4Q | 1Q | 2Q | 3Q | 4Q | |
| (Income Statement) | |||||||||
| Sales | 1,632 | 1,649 | 1,770 | 1,845 | 1,902 | 2,013 | 2,058 | 2,227 | 2,647 |
| Year-on-year | 5.6% | 5.4% | 9.3% | 10.4% | 16.6% | 22.1% | 16.3% | 20.7% | 39.2% |
| Cost of Goods Sold (COGS) | 1,127 | 1,184 | 1,262 | 1,295 | 1,346 | 1,421 | 1,473 | 1,566 | 1,769 |
| Gross Income | 505 | 465 | 508 | 550 | 557 | 592 | 585 | 661 | 879 |
| Gross Income Margin | 30.9% | 28.2% | 28.7% | 29.8% | 29.3% | 29.4% | 28.4% | 29.7% | 33.2% |
| SG&A Expense | 329 | 325 | 373 | 369 | 381 | 380 | 419 | 492 | 644 |
| EBIT (Operating Income) | 176 | 140 | 135 | 180 | 176 | 212 | 166 | 169 | 235 |
| Year-on-year | -1.7% | -3.7% | -27.9% | -4.5% | -0.4% | 51.7% | 22.7% | -6.4% | 33.7% |
| Operating Income Margin | 10.8% | 8.5% | 7.6% | 9.8% | 9.2% | 10.6% | 8.1% | 7.6% | 8.9% |
| EBITDA | 205 | 169 | 166 | 212 | 207 | 243 | 199 | 221 | 291 |
| Pretax Income | 175 | 139 | 135 | 182 | 174 | 212 | 87 | 166 | 219 |
| Consolidated Net Income | 92 | 89 | 92 | 110 | 113 | 132 | 42 | 92 | 133 |
| Minority Interest | 0 | 0 | 0 | 0 | 0 | 0 | 0 | 0 | 0 |
| Net Income ATOP | 92 | 89 | 92 | 110 | 113 | 132 | 42 | 92 | 133 |
| Year-on-year | -29.4% | -10.9% | -23.4% | -12.9% | 22.4% | 48.3% | -54.4% | -16.6% | 17.3% |
| Net Income Margin | 5.7% | 5.4% | 5.2% | 6.0% | 6.0% | 6.6% | 2.0% | 4.1% | 5.0% |
| (Balance Sheet) | |||||||||
| Cash & Short-Term Investments | 1,020 | 952 | 995 | 1,122 | 1,003 | 938 | 1,200 | 1,159 | 1,417 |
| Total assets | 2,963 | 2,791 | 2,997 | 3,035 | 2,978 | 3,004 | 3,365 | 4,355 | 4,496 |
| Total Debt | 641 | 587 | 574 | 425 | 376 | 326 | 702 | 1,322 | 1,143 |
| Net Debt | -379 | -365 | -420 | -697 | -627 | -612 | -499 | 163 | -274 |
| Total liabilities | 1,901 | 1,695 | 1,788 | 1,764 | 1,625 | 1,602 | 2,013 | 2,948 | 2,965 |
| Total Shareholders’ Equity | 1,062 | 1,096 | 1,209 | 1,271 | 1,353 | 1,402 | 1,352 | 1,408 | 1,530 |
| (Profitability %) | |||||||||
| ROA | 15.95 | 15.54 | 13.80 | 12.70 | 13.60 | 15.43 | 12.48 | 10.25 | 10.66 |
| ROE | 44.34 | 47.24 | 38.60 | 33.76 | 33.47 | 35.80 | 31.01 | 28.29 | 27.64 |
| (Per-share) Unit: JPY | |||||||||
| EPS | 28.2 | 27.2 | 27.9 | 33.4 | 34.7 | 40.6 | 13.2 | 29.6 | 42.6 |
| BPS | 324.1 | 334.4 | 366.4 | 387.1 | 415.9 | 431.0 | 429.8 | 455.1 | 494.8 |
| Dividend per Share | 25.50 | 0.00 | 0.00 | 0.00 | 26.00 | 0.00 | 0.00 | 0.00 | 27.00 |
| Shares Outstanding(million shares) | 3.85 | 3.85 | 3.85 | 3.85 | 3.85 | 3.57 | 3.57 | 3.57 | 3.57 |
Source: Omega Investment
Financial data (full-year basis)
| Unit: million yen | 2021 | 2022 | 2023 | 2024 | 2025 |
| (Income Statement) | |||||
| Sales | 5,035 | 5,803 | 6,487 | 7,166 | 8,946 |
| Year-on-year | 10.3% | 15.3% | 11.8% | 10.5% | 24.8% |
| Cost of Goods Sold | 3,607 | 4,030 | 4,522 | 5,087 | 6,228 |
| Gross Income | 1,428 | 1,773 | 1,965 | 2,079 | 2,717 |
| Gross Income Margin | 28.4% | 30.6% | 30.3% | 29.0% | 30.4% |
| SG&A Expense | 950 | 1,228 | 1,267 | 1,448 | 1,935 |
| EBIT (Operating Income) | 478 | 545 | 698 | 631 | 782 |
| Year-on-year | 57.5% | 14.0% | 28.0% | -9.6% | 23.9% |
| Operating Income Margin | 9.5% | 9.4% | 10.8% | 8.8% | 8.7% |
| EBITDA | 558 | 659 | 813 | 754 | 954 |
| Pretax Income | 464 | 546 | 701 | 630 | 684 |
| Consolidated Net Income | 276 | 343 | 438 | 404 | 398 |
| Minority Interest | 0 | 0 | 0 | 0 | 0 |
| Net Income ATOP | 276 | 343 | 438 | 404 | 398 |
| Year-on-year | 31.2% | 24.3% | 27.8% | -7.8% | -1.4% |
| Net Income Margin | 5.5% | 5.9% | 6.8% | 5.6% | 4.5% |
| (Balance Sheet) | |||||
| Cash & Short-Term Investments | 846 | 673 | 1,020 | 1,003 | 1,417 |
| Total assets | 2,192 | 2,536 | 2,963 | 2,978 | 4,496 |
| Total Debt | 266 | 546 | 641 | 376 | 1,143 |
| Net Debt | -580 | -127 | -379 | -627 | -274 |
| Total liabilities | 1,128 | 1,620 | 1,901 | 1,625 | 2,965 |
| Total Shareholders’ Equity | 1,064 | 916 | 1,062 | 1,353 | 1,530 |
| (Cash Flow) | |||||
| Net Operating Cash Flow | 268 | 373 | 723 | 481 | 1,030 |
| Capital Expenditure | 11 | 3 | 17 | 7 | 64 |
| Net Investing Cash Flow | -52 | -335 | -169 | -3 | -896 |
| Net Financing Cash Flow | 44 | -212 | -206 | -496 | 282 |
| Free Cash Flow | 257 | 370 | 717 | 475 | 1,023 |
| (Profitability ) | |||||
| ROA (%) | 13.63 | 14.51 | 15.95 | 13.60 | 10.66 |
| ROE (%) | 32.43 | 34.65 | 44.34 | 33.47 | 27.64 |
| Net Margin (%) | 5.48 | 5.91 | 6.76 | 5.64 | 4.45 |
| Asset Turn | 2.49 | 2.45 | 2.36 | 2.41 | 2.39 |
| Assets/Equity | 2.38 | 2.39 | 2.78 | 2.46 | 2.59 |
| (Per-share) Unit: JPY | |||||
| EPS | 71.6 | 94.6 | 132.4 | 123.1 | 126.0 |
| BPS | 276.2 | 265.6 | 324.1 | 415.9 | 494.8 |
| Dividend per Share | 24.49 | 25.00 | 25.50 | 26.00 | 27.00 |
| Shares Outstanding (million shares) | 3.85 | 3.85 | 3.85 | 3.57 | 3.57 |
Source: Omega Investment