2026-04-10
Home
Japanese

Omega Investment Co., Ltd.
Sansei Landic (Investment report – 3Q update)
| Share price (12/25) | ¥1,345 | Dividend Yield (25/12 CE) | 3.2 % |
| 52weeks high/low | ¥920/1,458 | ROE(24/12 act) | 8.5 % |
| Avg Vol (3 month) | 13.6 thou shrs | Operating margin (24/12 act) | 7.3 % |
| Market Cap | ¥11.55 bn | Beta (5Y Monthly) | 0.23 |
| Enterprise Value | ¥21.56 bn | Shares Outstanding | 8.584 mn shrs |
| PER (25/12 CE) | 10.0 X | Listed market | TSE Standard |
| PBR (24/12 act) | 0.8 X |
| Click here for the PDF version of this page |
| PDF version |
PBR remains below 1.0x, and the investment view over the medium to long term remains bullish, expansion of the rights-adjustment business and a gradually progressing re-rating.
Investment conclusion
Our view on the shares of Sansei Landic Co., Ltd. (the “Company”) remains bullish over the medium to long term, and buying on dips during share-price corrections is considered the sensible approach. That said, the pace of correction towards a PBR of 1.0x is slower than previously assumed, and the time horizon for re-rating should be viewed as longer. Current indicators are a market capitalization of 11.9 billion yen, a forecast PER of 10.54x, a PBR of 0.79x, an ROE of 8.46%, an ROIC of 9.13%, net cash of −14.683 billion yen, and a beta of 0.46. Considering capital efficiency and defensiveness, this level still indicates undervaluation.
In our previous analysis, on the assumptions of PBR 0.74x, PER 9.79x, and market capitalization 10.8 billion yen, we outlined a story in which, if (i) ROE returns to the 9–12% range, (ii) the amount of purchases is raised to 22.0 billion yen while maintaining inventory turnover, and (iii) shareholder returns such as the 43 yen annual dividend and share buybacks are continued, correction towards PBR of 1.0x would progress over the medium term. What is encouraging is that earnings power and shareholder returns have improved. ROE has recovered to the mid-8% range, and profit growth is continuing. The 22.0 billion yen purchase plan has become an official target, and the growth orientation of the rights-adjustment business remains unchanged. The annual dividend of 43 yen is expected, and the level of shareholder returns has reached the line assumed previously.
On the other hand, although we hypothesized that, if the above conditions were met, correction to approximately PBR of 1.0x would come into view in roughly 18–24 months, in reality, PBR has improved only slightly, from 0.74x to 0.79x, and remains way below 1.0x. We believe this reflects, in addition to fundamentals, the market’s cautious stance towards inventory buildup and high leverage, as well as concerns about the interest-rate environment and the real estate market outlook. PER has also risen only from the 9x level to the low 10x level, and the increase in implied growth expectations is limited. Accordingly, while the prior investment story itself was reasonable, only the time axis, “re-rating can advance quickly,” was a little optimistic.
The Company’s source of strength is a business model that standardizes investigation, negotiation, and rights adjustment for real estate with complex rights, such as leasehold land and old underutilized properties, and generates profit with high reproducibility. Even as it revises the medium-term management plan upward, the Company clearly states an ROE target. It indicates a balance among dividends, inventory investment, and leverage, elements that facilitate investor assessment. Going forward, whether the Company can stabilize ROE in the 9–12% range, demonstrate, in results, the coexistence of 22.0 billion yen in purchases and inventory turnover, and continue shareholder returns at the 43 yen level, together with agile measures, will be key to narrowing the valuation gap.
The Company is in a growth-to-expansion stage centered on the rights-adjustment business. While the story remains valid in the same direction as before, the re-rating pace is slower than initially assumed. Therefore, rather than aiming for a sharp short-term rise, it is considered appropriate to build positions during corrections while looking ahead to the medium-to-long-term correction of PBR.
◇ Highlights of results for the nine months ended December 2025: significant profit increase on higher-margin deals despite lower sales; strengthening for the next fiscal year and beyond through inventory buildup
For the nine months ended December 2025, net sales were 19.714 billion yen (-7.7% YoY), while operating income was 2.650 billion yen (+46.4% YoY), ordinary income was 2.390 billion yen (+50.4% YoY), and net income attributable to owners of parent was 1.623 billion yen (+53.5% YoY), resulting in a significant increase in profit. The combination of lower sales and higher profit indicates improved deal mix and margins.
Gross profit increased to 6.126 billion yen (9M previous year: 5.153 billion yen), with gross margin rising markedly from about 24% to about 31%, while SG&A increased only to 3.475 billion yen (previous year: 3.342 billion yen), lifting operating margin from the 9% range into the 13% range. On the earnings side, sales of leasehold land rose to 10.314 billion yen (+33.6% YoY) and freehold to 2.086 billion yen (+84.1% YoY), with higher-margin areas driving profit. Meanwhile, old underutilized properties declined sharply to 6.881 billion yen (down 43.4% YoY), which was the primary driver of the overall decrease in sales; the Company reports that the impact of changes in the timing of sales was significant.
Purchases remained active, totaling 15.338 billion yen (+17.3% YoY). The breakdown was leasehold land at 5.906 billion yen (+38.6% YoY), old unutilized properties at 8.398 billion yen (+29.9% YoY), and freehold at 1.032 billion yen (-56.0% YoY), with growth mainly in leasehold land and old unutilized properties. As a result, real estate for sale built up to a record-high 27.137 billion yen (+7.1% from the end of the previous fiscal year). Interest-bearing debt also increased to 20.002 billion yen (+8.1%), but with total assets of 35.708 billion yen, net assets of 13.876 billion yen, and an equity ratio of 38.9%, a certain level of financial capacity is maintained. While the simultaneous increases in inventories and interest-bearing debt are risk factors, they are positioned as growth investments to increase future sales potential.
The Company summarizes that, relative to the full-year forecast announced in August (net sales 24.000 billion yen; operating income 2.020 billion yen; ordinary income 1.650 billion yen; net income attributable to owners of parent 1.100 billion yen), profits were roughly in line with plan at the nine-month point, while net sales were somewhat below plan. The plan was originally prepared on the premise of first-half weakness and a fourth-quarter loss; under a policy that prioritizes medium- to long-term stable growth rather than short-term straight-line increases, the Company continues to make purchases, including large properties. Accordingly, the 9-month results can be summarized as “a profit-increase outcome resulting from selective focus on higher-margin deals and inventory buildup while restraining sales growth.” Looking ahead, how far the Company can maintain stable sales and cash flow relative to the pace of growth in real estate for sale and interest-bearing debt will be the key issue directly affecting medium-term credit quality and valuation.
The results of lower sales/higher profits indicate that the profitability of the rights-adjustment business is rising. However, they also reflect the flip-side risks of inventory and borrowing buildup. The managerial decision to prioritize margins and pipeline expansion over short-term sales growth is reasonable; however, from the next fiscal year onward, the dividing line in evaluation will be whether the Company can prove through actual inventory turnover and cash flow that the offensive inventory was appropriate.
◇ Segment analysis: four categories, “leasehold land, old unutilized properties, freehold, and other,” form the pillars of earnings
Although the Company has a single reportable segment of the real estate sales business, in practice, it consists of four categories: (i) leasehold land, (ii) old unutilized properties, (iii) freehold, and (iv) other. Of the 19.714 billion yen in net sales for the nine months ended December 2025, leasehold land and old unutilized properties account for the majority, supplemented by freehold and other properties.
The categories are as follows.
• Leasehold land: land subject to leasehold rights. Properties where leasehold land is included among mixed properties of leasehold land, old unutilized properties, and freehold are also included here.
• Old unutilized properties: land with buildings occupied by tenants, etc. Properties where only old unutilized properties and freehold are mixed are also included.
• Freehold: ordinary freehold properties not subject to leasehold or tenancy rights.
• Other real estate sales business: income from ground rents, brokerage fees, outsourcing fees, etc.
Sales performance for the nine months ended December 2025 was leasehold land 10.314 billion yen (+33.6% YoY), old unutilized properties 6.881 billion yen (-43.4% YoY), freehold 2.086 billion yen (+84.1% YoY), and other 431 million yen (+27.0% YoY), totaling 19.714 billion yen (-7.7% YoY). The sales mix is roughly: leasehold land, roughly half; old, unutilized properties, about one-third; and the remainder accounted for by freehold and other. As of the third quarter, the strength in leasehold land and freehold partially offset the decline in old, unutilized properties. Leasehold land has high margins and plays a significant role in lifting portfolio profitability.
On the purchasing side, of the 15.338 billion yen in purchases for the real estate sales business as a whole (+17.3% YoY), leasehold land was 5.906 billion yen (+38.6% YoY), old unutilized properties 8.398 billion yen (+29.9% YoY), and freehold 1.032 billion yen (-56.0% YoY), indicating active inventory investment centered on leasehold land and old unutilized properties. Properties are primarily sourced through brokers and other channels and are sold following investigation and negotiation, with due regard to rights, legal matters, and engineering considerations. Customers include lessees, neighboring landowners, and investors, and the revenue model combines sales gains with ground rents and various fee income over the holding period.
In the medium-term management plan, while making the core leasehold land and old unutilized properties businesses the axis of growth, the Company plans to incorporate into the portfolio “derivative/new businesses,” such as purchases of co-ownership interests, ownership period (medium-to long-term holdings of old unutilized properties), and regional revitalization businesses exemplified by Hirado City and Hachimantai. Therefore, the business structure can be characterized as aiming for stable growth centered on continuous purchases and inventory turnover in leasehold land and old unutilized properties, rather than short-term sales volume, and by diversifying earnings through expansion into new areas.
◇ FY12/2025 forecast: planning “lower sales, higher profit, and higher dividend” current fiscal year; raising medium-term profit targets while maintaining ROE of 9–12%
For FY12/2025, the Company plans to restrain net sales while raising profits and dividends, and, in the medium term, intends to revise upward profit targets while maintaining the ROE target of 9–12%. However, it carries risks of increased inventories and short-term market volatility; the medium-term profit-growth story is relatively easy to envision, premised on a focus on margins and on reinforcing shareholder returns.
The revised full-year forecast announced in August is net sales of 24.000 billion yen (previous forecast 25.665 billion yen), operating income of 2.020 billion yen (previous 1.910 billion yen), ordinary income of 1.650 billion yen (previous 1.600 billion yen), and net income attributable to owners of parent of 1.100 billion yen (previous 1.070 billion yen). According to the previous forecast, while net sales decrease by 1.650 billion yen, operating income increases by 110 million yen, ordinary income by 50 million yen, and net income by 30 million yen, indicating “net sales conservative, profit upward.”
As reasons for the revision, in addition to steady progress in sales of leasehold land in the core real estate sales business, the Company cites the outlook for margins to exceed plan in each of leasehold land, old unutilized properties, and freehold. Accordingly, while net sales are recalibrated, operating, ordinary, and net income are expected to exceed plan. For dividends, the Company intends to increase the year-end per-share dividend from 25 yen to 26 yen, resulting in an annual dividend of 43 yen.
As of the third quarter, while net sales of 19.714 billion yen were slightly below the revised plan (20.571 billion yen), operating income of 2.650 billion yen, ordinary income of 2.390 billion yen, and net income of 1.623 billion yen were all nearly in line with the revised plan. The Company also states that it is “generally progressing in line with the plan revised in August this year,” and the probability of achieving the full-year profit plan appears high. The remaining issues concern the fourth-quarter sales volume and the extent to which the increase in real estate for sale and interest-bearing debt can be linked to profit and cash flow in the next fiscal year and beyond.
For the medium-term management plan, the Company revised the management targets for FY12/2027 upward to operating income of 2.5 billion yen (previous 2.0 billion yen) and ordinary income of 2.000 billion yen (previous 1.650 billion yen), while maintaining the ROE target range of 9–12%. It also presented a cash-allocation plan of operating cash flow of around 2.5 billion yen, growth investment of 2.0–3.0 billion yen, and shareholder returns of 1.5–2.5 billion yen over the three years from 2025 to 2027; of this, it assumes dividends of about 1.0 billion yen and share repurchases of about 0.5–1.5 billion yen, and sets a policy floor of a dividend payout ratio of 30% or higher and 40 yen per-share dividends.
Based on the above, the Company’s performance scenario can beed as: (i) short term; FY12/2025 is a period that prioritizes margin improvement and a higher dividend despite lower sales; and (ii) medium term; a period that targets operating income of 2.5 billion yen, ordinary income of 2.0 billion yen, and ROE of 9–12% through profit growth centered on leasehold land and old unutilized properties. The most significant risks are a slowdown in inventory turnover due to changes in real-estate market conditions and an increase in funding costs due to higher interest rates; however, in the plan, the Company clearly indicates a balance of cash generation, shareholder returns, and growth investment, and the shift toward management conscious of capital efficiency and shareholder returns is clear.
The full-year plan is designed to constrain net sales while increasing profits and dividends, indicating a shift towards a focus on margins. Given progress through the third quarter, while the probability of achieving the profit side is high, the risks of increasing inventories and market fluctuations are prerequisites of the medium-term scenario; therefore, it is necessary to check, while confirming actual inventory turnover and operating cash flow in 2026 and beyond, whether the Company is proceeding as planned on both performance and shareholder returns.
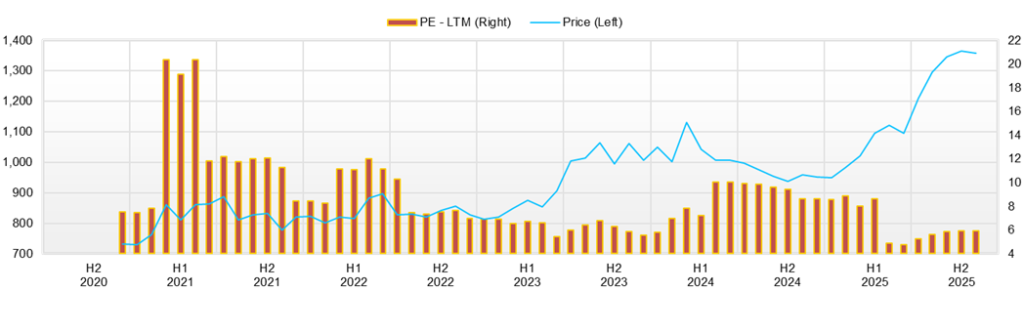
◇ Share-price trend and points of focus: a gentle uptrend over three months; share price remains in value territory with PBR below 1.0x.
While the Company’s recent share price is maintaining an uptrend, on investment indicators it remains strongly undervalued, with a PBR below 1.0x and a PER in the low-10x range, and conditions persist in which it is easy for medium- to long-term investors to buy on dips. Current indicators include a market capitalization of 11.9 billion yen, a forecast PER of 10.54x, a PBR of 0.79x, an ROE of 8.46%, and a beta of 0.46.
Looking at the share price trend, it rose about 17% from the closing price of 1,209 yen on August 1 to the closing price of 1,411 yen on November 14, updating the year-to-date high of 1,458 yen (November 14) during this period. On August 8, the day of the announcement of “revisions to the full-year earnings forecast and the medium-term management plan,” the closing price was 1,233 yen (+0.2% from the previous day) with trading volume temporarily swelling to over 80 thousand shares; thereafter, the share price gradually corrected upward into the 1,300-yen range. On November 14, the day of the third-quarter earnings announcement, after recording an intraday year-to-date high of 1,458 yen, the share price fell back to a close of 1,411 yen (down 2.76% from the previous day), confirming a pattern of “good results → temporary rise → profit-taking into the close.”
As a market assessment, despite the fundamentals of higher profit, a higher dividend, and an upward revision to the medium-term plan, a discount in indicators, PBR around 0.8x and a dividend yield in the 3% range, persists. Hence, it can be characterized as a phase in which, while growth expectations are evaluated to some extent, the market is factoring in inventory increases and real estate market risk and is maintaining a cautious stance. Regarding share-price indicators, at the latest share price of 1,411 yen, PER is in the low 10x range, PBR is in the high 0.8x range, and the margin balance is approximately 17x; the supply–demand balance is somewhat skewed toward buyers but not excessively so. Technically, the share price is clearly above all moving averages, at +2.69% vs. the 25-day line, +8.24% vs. the 75-day line, and +22.46% vs. the 200-day line, confirming a medium-term uptrend. Short-term divergence (relative to the 25-day line) remains below 3%, and there is no excessive overheating.
Looking at the pattern of announcements and share-price reactions, for positive factors such as (i) revision of the medium-term plan / full-year upward revision (August 8) and (ii) third-quarter results (November 14), in both cases what stands out is a pattern in which “the rise on the day or immediately thereafter is limited, and the price creeps up over the following weeks.” Therefore, rather than a name that is re-rated in one shot by short-term events, it can be evaluated as a stock whose valuation is corrected gradually as results and disclosures accumulate.
Conditions for considering an increase in overweight include: (i) landing of full-year results and the 43 yen dividend plan; (ii) further disclosure on the trends in inventory balances and interest-bearing debt (property size, area, expected recovery, etc.); (iii) confirmation of progress toward the medium-term targets of operating income of 2.5 billion yen, ordinary income of 2.0 billion yen, and the ROE range of 9–12%; and (iv) execution of additional shareholder returns such as share repurchases. In phases where these progress and the share price corrects to around 1,250–1,300 yen, the scope for medium- to long-term investors to consider overweighting could widen. If inventory turnover slows due to deterioration in the real estate market or rising interest rates, a return to the PBR 0.7x range must also be assumed; therefore, we will continue to monitor trends in inventory turnover and operating cash flow.
Although the share price is near the year-to-date high, combining indicators, PBR below 1.0x and a dividend yield in the 3% range, with fundamentals, profit increase, higher dividend, and an upwardly revised medium-term plan, still places the stock as a “defensive-leaning value name.” For institutional investors, an approach that evaluates results and progress against the medium-term plan, waits for a dip immediately after events, and builds positions is considered realistic.
Company profile
◇ A mid-sized real estate company that, as a pure-play in “rights adjustment × real estate revitalization,” generates stable earnings in a niche market
Sansei Landic Co., Ltd. is a mid-sized real estate company dedicated to the real estate rights-adjustment business, whose mainstay is to revitalize and sell properties with complex rights relationships, such as Leasehold land, Old unutilized properties, and older income-producing properties, through “rights adjustment.”
The core of the business model is to purchase from brokers, etc., properties of the following types: (i) Leasehold land (land subject to leasehold rights) to which the former Leasehold and House Lease Law applies, (ii) Old unutilized properties, i.e., land with buildings occupied by tenants, and (iii) Freehold; after scrutinizing legal regulations and rights relationships, the Company enables liquidity and higher-value use through negotiations with lessees and tenants and through the structuring of rebuilding/redevelopment schemes, thereby earning sales gains and income such as ground rents and rents. The accumulation of standardized investigation/negotiation processes and know-how in these “rights-involved areas that large players find hard to enter” constitutes the Company’s barriers to entry and competitive advantage.
Key financial data
| Unit: million yen | 2020/12 | 2021/12 | 2022/12 | 2023/12 | 2024/12 | 2025/12 CE |
| Sales | 17,775 | 16,836 | 15,533 | 23,269 | 25,620 | 24,000 |
| EBIT (Operating Income) | 847 | 1,118 | 1,469 | 2,155 | 1,883 | 2,020 |
| Pretax Income | 712 | 1,004 | 1,270 | 1,756 | 1,585 | 1,650 |
| Net Profit Attributable to Owner of Parent | 358 | 609 | 1,060 | 1,183 | 1,051 | 1,100 |
| Cash & Short-Term Investments | 4,330 | 5,361 | 3,837 | 3,770 | 5,013 | |
| Total assets | 20,071 | 20,051 | 28,977 | 30,976 | 33,107 | |
| Total Debt | 8,342 | 8,108 | 16,399 | 16,879 | 18,506 | |
| Net Debt | 4,012 | 2,747 | 12,562 | 13,109 | 13,493 | |
| Total liabilities | 10,004 | 9,749 | 17,921 | 18,899 | 20,349 | |
| Total Shareholders’ Equity | 10,067 | 10,302 | 11,056 | 12,077 | 12,759 | |
| Net Operating Cash Flow | -917 | 1,705 | -9,268 | -12 | 1,143 | |
| Capital Expenditure | 21 | 40 | 28 | 304 | 138 | |
| Net Investing Cash Flow | -288 | -51 | -267 | -766 | -715 | |
| Net Financing Cash Flow | 953 | -608 | 7,971 | 303 | 1,223 | |
| Free Cash Flow | -923 | 1,682 | -9,282 | -291 | 1,049 | |
| ROA (%) | 1.82 | 3.04 | 4.32 | 3.95 | 3.28 | |
| ROE (%) | 3.58 | 5.98 | 9.93 | 10.23 | 8.46 | |
| EPS (Yen) | 42.3 | 73.6 | 129.6 | 143.8 | 127.2 | 135.1 |
| BPS (Yen) | 1,192.9 | 1,249.5 | 1,356.8 | 1,465.5 | 1,541.8 | |
| Dividend per Share (Yen) | 25.00 | 26.00 | 28.00 | 33.00 | 41.00 | 43.00 |
| Shares Outstanding (Million Shares) | 8.47 | 8.47 | 8.49 | 8.58 | 8.58 |
Source: Omega Investment from company data, rounded to the nearest whole number.
Share price
Key stock price data
Financial data (quarterly basis)
| Unit: million yen | 2023/12 | 2024/12 | 2025/12 | ||||||
| 3Q | 4Q | 1Q | 2Q | 3Q | 4Q | 1Q | 2Q | 3Q | |
| (Income Statement) | |||||||||
| Sales | 7,485 | 3,804 | 7,207 | 5,785 | 8,358 | 4,270 | 8,848 | 5,664 | 5,202 |
| Year-on-year | 141.8% | -11.0% | 11.1% | 5.3% | 11.7% | 12.3% | 22.8% | -2.1% | -37.8% |
| Cost of Goods Sold (COGS) | 5,681 | 3,067 | 5,521 | 4,228 | 6,448 | 3,122 | 5,842 | 4,062 | 3,684 |
| Gross Income | 1,803 | 737 | 1,686 | 1,558 | 1,910 | 1,149 | 3,006 | 1,602 | 1,518 |
| Gross Income Margin | 24.1% | 19.4% | 23.4% | 26.9% | 22.9% | 26.9% | 34.0% | 28.3% | 29.2% |
| SG&A Expense | 1,128 | 914 | 1,115 | 1,102 | 1,125 | 1,077 | 1,200 | 1,168 | 1,108 |
| EBIT (Operating Income) | 676 | -177 | 571 | 455 | 785 | 72 | 1,806 | 434 | 410 |
| Year-on-year | 135.5% | -165.8% | -49.0% | -15.5% | 16.2% | -140.5% | 216.6% | -4.6% | -47.7% |
| Operating Income Margin | 9.0% | -4.7% | 7.9% | 7.9% | 9.4% | 1.7% | 20.4% | 7.7% | 7.9% |
| EBITDA | 692 | -161 | 587 | 476 | 806 | 92 | 1,827 | 460 | 442 |
| Pretax Income | 587 | -254 | 493 | 369 | 728 | -4 | 1,728 | 349 | 313 |
| Consolidated Net Income | 387 | -144 | 328 | 245 | 485 | -7 | 1,175 | 236 | 213 |
| Minority Interest | 0 | 0 | 0 | 0 | 0 | 0 | 0 | 0 | 0 |
| Net Income ATOP | 387 | -144 | 328 | 245 | 485 | -7 | 1,175 | 236 | 213 |
| Year-on-year | 97.9% | -195.1% | -52.0% | -4.0% | 25.2% | -94.9% | 258.2% | -4.0% | -56.1% |
| Net Income Margin | 5.2% | -3.8% | 4.6% | 4.2% | 5.8% | -0.2% | 13.3% | 4.2% | 4.1% |
| (Balance Sheet) | |||||||||
| Cash & Short-Term Investments | 5,388 | 3,770 | 4,479 | 4,988 | 4,728 | 5,013 | 5,788 | 5,730 | 5,319 |
| Total assets | 30,632 | 30,976 | 30,487 | 30,561 | 29,940 | 33,107 | 31,353 | 32,250 | 35,709 |
| Total Debt | 16,262 | 16,879 | 16,787 | 16,211 | 15,595 | 18,506 | 15,747 | 16,379 | 20,002 |
| Net Debt | 10,874 | 13,109 | 12,308 | 11,223 | 10,867 | 13,493 | 9,959 | 10,649 | 14,683 |
| Total liabilities | 18,412 | 18,899 | 18,354 | 18,163 | 17,173 | 20,349 | 17,712 | 18,471 | 21,832 |
| Total Shareholders’ Equity | 12,220 | 12,077 | 12,133 | 12,398 | 12,768 | 12,759 | 13,641 | 13,779 | 13,877 |
| (Profitability %) | |||||||||
| ROA | 5.08 | 3.95 | 2.75 | 2.66 | 3.02 | 3.28 | 6.14 | 6.01 | 4.93 |
| ROE | 12.79 | 10.23 | 6.98 | 6.74 | 7.32 | 8.46 | 14.73 | 14.43 | 12.13 |
| (Per-share) Unit: JPY | |||||||||
| EPS | 47.0 | -17.4 | 39.8 | 29.7 | 58.6 | -0.9 | 142.4 | 29.1 | 26.2 |
| BPS | 1,482.9 | 1,465.5 | 1,472.3 | 1,501.2 | 1,542.9 | 1,541.8 | 1,665.9 | 1,701.6 | 1,709.9 |
| Dividend per Share | 0.00 | 33.00 | 0.00 | 16.00 | 0.00 | 25.00 | 0.00 | 17.00 | 0.00 |
| Shares Outstanding(Million shares) | 8.58 | 8.58 | 8.58 | 8.58 | 8.58 | 8.58 | 8.58 | 8.58 | 8.58 |
Source: Omega Investment from company materials
Financial data (full-year basis)
| Unit: million yen | 2014/12 | 2015/12 | 2016/12 | 2017/12 | 2018/12 | 2019/12 | 2020/12 | 2021/12 | 2022/12 | 2023/12 | 2024/12 |
| (Income Statement) | |||||||||||
| Sales | 10,446 | 11,569 | 12,300 | 13,099 | 16,833 | 18,020 | 17,775 | 16,836 | 15,533 | 23,269 | 25,620 |
| Year-on-year | 13.7% | 10.8% | 6.3% | 6.5% | 28.5% | 7.1% | -1.4% | -5.3% | -7.7% | 49.8% | 10.1% |
| Cost of Goods Sold | 7,055 | 7,798 | 8,344 | 8,566 | 12,028 | 12,902 | 13,788 | 12,468 | 10,486 | 16,927 | 19,318 |
| Gross Income | 3,391 | 3,770 | 3,957 | 4,532 | 4,805 | 5,119 | 3,986 | 4,368 | 5,047 | 6,342 | 6,302 |
| Gross Income Margin | 32.5% | 32.6% | 32.2% | 34.6% | 28.5% | 28.4% | 22.4% | 25.9% | 32.5% | 27.3% | 24.6% |
| SG&A Expense | 2,204 | 2,216 | 2,295 | 2,434 | 2,702 | 2,891 | 2,750 | 2,877 | 3,031 | 3,569 | 4,420 |
| EBIT (Operating Income) | 1,187 | 1,300 | 1,446 | 1,762 | 1,766 | 1,861 | 847 | 1,118 | 1,469 | 2,155 | 1,883 |
| Year-on-year | 31.6% | 9.6% | 11.2% | 21.9% | 0.2% | 5.4% | -54.5% | 31.9% | 31.5% | 46.7% | -12.6% |
| Operating Income Margin | 11.4% | 11.2% | 11.8% | 13.5% | 10.5% | 10.3% | 4.8% | 6.6% | 9.5% | 9.3% | 7.3% |
| EBITDA | 1,260 | 1,406 | 1,532 | 1,833 | 1,822 | 1,912 | 896 | 1,161 | 1,517 | 2,236 | 1,962 |
| Pretax Income | 1,044 | 1,196 | 1,329 | 1,672 | 1,539 | 1,759 | 712 | 1,004 | 1,270 | 1,756 | 1,585 |
| Consolidated Net Income | 626 | 724 | 854 | 1,111 | 1,007 | 1,159 | 358 | 609 | 1,060 | 1,183 | 1,051 |
| Minority Interest | 0 | 0 | 0 | 0 | 0 | 0 | 0 | 0 | 0 | 0 | 0 |
| Net Income ATOP | 626 | 724 | 854 | 1,111 | 1,007 | 1,159 | 358 | 609 | 1,060 | 1,183 | 1,051 |
| Year-on-year | 37.5% | 15.6% | 17.9% | 30.2% | -9.4% | 15.1% | -69.1% | 70.5% | 73.9% | 11.6% | -11.2% |
| Net Income Margin | 6.0% | 6.3% | 6.9% | 8.5% | 6.0% | 6.4% | 2.0% | 3.6% | 6.8% | 5.1% | 4.1% |
| (Balance Sheet) | |||||||||||
| Cash & Short-Term Investments | 2,276 | 2,254 | 2,435 | 3,558 | 3,594 | 4,134 | 4,330 | 5,361 | 3,837 | 3,770 | 5,013 |
| Total assets | 8,793 | 11,398 | 10,833 | 16,916 | 16,777 | 19,294 | 20,071 | 20,051 | 28,977 | 30,976 | 33,107 |
| Total Debt | 2,414 | 3,958 | 2,712 | 7,439 | 6,048 | 7,203 | 8,342 | 8,108 | 16,399 | 16,879 | 18,506 |
| Net Debt | 139 | 1,704 | 277 | 3,881 | 2,454 | 3,069 | 4,012 | 2,747 | 12,562 | 13,109 | 13,493 |
| Total liabilities | 3,531 | 5,363 | 3,977 | 8,909 | 7,869 | 9,399 | 10,004 | 9,749 | 17,921 | 18,899 | 20,349 |
| Total Shareholders’ Equity | 5,262 | 6,034 | 6,856 | 8,006 | 8,908 | 9,895 | 10,067 | 10,302 | 11,056 | 12,077 | 12,759 |
| (Cash Flow) | |||||||||||
| Net Operating Cash Flow | 1,761 | -1,451 | 1,611 | -3,666 | 1,617 | -420 | -917 | 1,705 | -9,268 | -12 | 1,143 |
| Capital Expenditure | 91 | 58 | 111 | 57 | 66 | 61 | 21 | 40 | 28 | 304 | 138 |
| Net Investing Cash Flow | -111 | -116 | -184 | 107 | -64 | -71 | -288 | -51 | -267 | -766 | -715 |
| Net Financing Cash Flow | -612 | 1,588 | -1,278 | 4,667 | -1,495 | 984 | 953 | -608 | 7,971 | 303 | 1,223 |
| Free Cash Flow | 1,697 | -1,491 | 1,536 | -3,692 | 1,572 | -446 | -923 | 1,682 | -9,282 | -291 | 1,049 |
| (Profitability %) | |||||||||||
| ROA | 7.07 | 7.17 | 7.68 | 8.01 | 5.98 | 6.42 | 1.82 | 3.04 | 4.32 | 3.95 | 3.28 |
| ROE | 13.72 | 12.82 | 13.24 | 14.96 | 11.90 | 12.32 | 3.58 | 5.98 | 9.93 | 10.23 | 8.46 |
| (Per-share) Unit: JPY | |||||||||||
| EPS | 90.2 | 90.1 | 104.9 | 134.4 | 119.6 | 137.1 | 42.3 | 73.6 | 129.6 | 143.8 | 127.2 |
| BPS | 664.8 | 744.2 | 841.3 | 958.0 | 1,054.5 | 1,170.2 | 1,192.9 | 1,249.5 | 1,356.8 | 1,465.5 | 1,541.8 |
| Dividend per Share | 6.00 | 10.00 | 12.00 | 18.00 | 21.00 | 23.00 | 25.00 | 26.00 | 28.00 | 33.00 | 41.00 |
| Shares Outstanding (Million shares) | 7.91 | 8.11 | 8.15 | 8.35 | 8.45 | 8.46 | 8.47 | 8.47 | 8.49 | 8.58 | 8.58 |
Source: Omega Investment from company materials