2026-04-10
Home
Japanese

Omega Investment Co., Ltd.
MAMEZO (Investment report – 3Q update)
| Share price (2/25) | ¥3,545 | Dividend Yield (26/3 CE) | 0.9 % |
| 52weeks high/low | ¥1,090/,5000 | ROE(25/3) | 50.6 % |
| Avg Vol (3 month) | 592.6 thou shrs | Operating margin (25/3) | 19.6 % |
| Market Cap | ¥568.9 bn | Beta (5Y Monthly) | N/A |
| Enterprise Value | ¥272.7 bn | Shares Outstanding | 16.050 mn shrs |
| PER (26/3 CE) | 36.5 X | Listed market | TSE Growth |
| PBR (25/3 act) | 18.1 X |
| Click here for the PDF version of this page |
| PDF version |
Completion of the TOB marks the end of the investment opportunity. The top priority is to complete the tender procedures.
Investment conclusion
The share price is converging toward the TOB level, and the rational course of action for institutional investors is to tender and close their positions with certainty.
We organize our investment stance toward the Company as a situation in which execution of the tender offer should be prioritized over ordinary valuation updates. While the Company has expressed its support for the tender offer, it has adopted a neutral stance on whether to tender. It has indicated that it will leave the decision to shareholders.
Under these circumstances, upside potential for the share price tends to be limited. At the same time, the residual costs of not tendering (such as reduced liquidity, time costs, and procedural burdens) are relatively high. Accordingly, our recommended action is to include tendering in the TOB as the baseline.
Key points of the tender offer (conditions and schedule)
The tender offer price is 3,551 yen per share of common stock. The tender offer period runs from January 26, 2026, to March 10, with acceptance on the final day closing at 15:30, and settlement will commence on March 17.
Applications to tender will be accepted through the tender offer agent (Nomura Securities), and the procedures will diverge depending on investors’ holding format (Nomura account, another securities company account, or special account).
While the Company has expressed its support for the tender offer, taking into account such factors as the fact that the tender offer price represents a 12.75% discount to the closing price (4,070 yen) before the announcement, it has clearly stated that it will adopt a neutral stance on whether to recommend tendering and will leave the decision to shareholders.
Shareholder structure and transaction scheme (basis for the likelihood of completion)
The controlling shareholder holds approximately 66–68%, and the likelihood of the TOB being completed is high. The TOB is structured so that the controlling shareholder’s holdings will not be tendered and will be acquired indirectly after completion.
According to the securities report as of the end of March 2025, the largest shareholder is Mamezo K2TOP Holdings Co., Ltd., with a holding ratio of 67.99%.
On the other hand, the TOB-related materials identify “M&I Co., Ltd.” as the controlling shareholder with a holding ratio of 65.94%, and present a transaction framework in which the tender offeror will acquire all shares other than those held by this company and take the Company private. In addition, the structure is explained: M&I shareholders and others will not tender the “non-tendered shares” into the tender offer but will transfer the M&I shares, etc., after completion, and the tender offeror positions this method as another way to achieve its objective.
For these reasons, we evaluate the TOB as a structure that is easy to complete, from both a formal and structural standpoint.
Background of the major shareholder (founder × fund)
The major shareholder combines founder involvement and fund involvement, and taking the Company private is a structural outcome that could occur.
The securities report states that, in addition to the largest shareholder (Mamezo K2TOP Holdings Co., Ltd.) holding 67.99% of the Company’s shares, a financial sponsor (Integral) is involved.
Regarding the Company’s shareholder structure, the securities report states that it is composed of “a corporation funded by Mr. Norio Ogiwara, founder of the former Mamezo Holdings,” and “funds, etc. in which the Integral group is involved,” and that the majority of the shares are held by funds involving Integral. It also states that, with respect to officers, a majority of the board of directors is appointed by Integral, and that Mr. Ogiwara serves as a representative director.
In general, funds are intended to realize investment returns (i.e., the disposition of shares), and the securities report indicates that the policy for disposing of shares could affect the Company.
Buyer and objectives of the TOB (why take the Company private)
The aim is to enhance corporate value through front-loaded investment that is not swayed by short-term share price movements, leveraging EQT’s investment know-how and human resource network, and Itochu Corporation’s platform.
In the Company’s opinion statement report, as the background to EQT’s proposal, it cites the possibility that taking the Company private will allow “rapid and large-scale front-loaded investment without being constrained by short-term share price movements,” and that the funds, existing businesses, and investment know-how of EQT and Itochu Corporation can be fully utilized.
It also explains that the disadvantages of being private (in terms of credit, recruitment, and financing that come with being listed) may be mitigated by EQT’s network and financial strength, and by the brand complement provided by its capital relationship with Itochu Corporation.
The tender offeror is a vehicle established primarily to acquire shares through the TOB, and the structure is designed to be indirectly owned by EQT (including through MMG funds).
Share price trends and investor issues
The short-term arbitrage spread tends to be limited, and the rationality of not tendering is low.
After the TOB is announced, the share price tends to converge to a range that reflects the TOB price and the time value (capital lock-up) until settlement. Therefore, the issues that investors should consider are not so much the upside potential for corporate value as (1) the practicalities of tendering, (2) capital lock-up until settlement, and (3) the outcome if they do not tender.
The Company has indicated that it is scheduled to become a wholly owned subsidiary and be delisted. In light of this, it has stated that it will not prepare supplementary earnings explanatory materials and will not hold explanatory meetings.
Accordingly, from the standpoint of investment operations, the most rational course is to tender and close the position with certainty.
Highlights of results for the third quarter of the fiscal year ending March 2026
Although caution is required regarding comparability because of the shift to non-consolidated accounting, we see no signs of impairment to financial soundness.
On October 1, 2025, the Company absorbed three subsidiaries and, from the cumulative third quarter of the fiscal year ending March 2026, has changed its disclosure from consolidated to non-consolidated (stand-alone). It has clearly stated that, as this is the first fiscal year on a non-consolidated basis, it will not present comparisons with the same period of the previous fiscal year. As for information, assuming consolidation continued as before as of December 31, 2025, only the statement of income has been disclosed as reference material, and other financial information, such as the balance sheet, has not been disclosed.
On a non-consolidated basis, cumulative third quarter (from April 1 to December 31, 2025) results were net sales of 4,529 million yen, operating profit of 1,942 million yen, and quarterly net income of 2,942 million yen. In addition, at the end of the third quarter, total assets were 4,425 million yen, net assets were 3,148 million yen, and the equity-to-asset ratio was 71.1%.
In this report, we position the earnings results as a confirmation that there is no significant deterioration that would overturn the TOB decision. It is also disclosed that the results are not subject to quarterly review procedures.
Dividend and capital policy
On the condition that the TOB is completed, the year-end dividend has been revised to no dividend, and the option of waiting for a dividend has effectively disappeared in practical terms.
On the condition that this tender offer is completed, the Company has revised its policy for the fiscal year ending March 2026, not to pay a year-end dividend (no dividend). It explains that the tender offer price has been determined on the premise that no surplus dividend will be paid, with March 31, 2026, as the record date.
Accordingly, the rationality of postponing tendering for the purpose of collecting the dividend is low.
Investment actions (specific recommendations)
Counting backward from the deadline (March 10, 15:30), investors should check how their shares are held and complete the tender procedures at an early stage.
Recommended actions
1.Tender into the TOB and close the position.
2.If conducting arbitrage trades, check whether the spread is reasonable, on the premise of capital lock-up until the settlement date (March 17) and operational risk (in general).
3.We do not recommend remaining invested by not tendering (as delisting, reduced liquidity, time costs, and other burdens may arise).
Company profile
◇ An independent tech company that operates its growth engines in an integrated manner as an operating company, with AI software engineering at its core
MAMEZO Inc. (formerly MAMEZO DIGITAL HOLDINGS CO., LTD.) is an independent technology company that develops a high-profit, knowledge-intensive model centered on AI software engineering and robotics engineering and, through the absorption-type merger of its subsidiaries in October 2025 and the resulting shift “from a holding company to an operating company,” has reached a stage where it has established a growth base for the integrated operation of its brand, human resources, sales, and development.
The Company provides four services, Cloud Consulting, AI Consulting, AI Robotics Engineering, and Mobility Automation, and mainly for enterprise customers such as large financial institutions, telecom operators, manufacturers, and trading companies, it adopts a client-side, upstream-focused business model that supports them end-to-end from requirements definition and architecture design through implementation and education.
On the technology side, the Company is pursuing AI robotics research and development, which has been adopted as a national project. It aims to build recurring revenue through licenses and cloud-based offerings. In October 2025, it established the cross-business organization “AI Technical Sector,” which brings together AI specialists with academic experience, and has positioned it as the core for providing AI technology support to each service area and for creating new businesses. In addition, through co-creation with DENSO of the SOMRIE® software human resource certification system, the Company is building a cross-industry human resource development platform rooted in the mobility industry. It is seeking synergies with the education and human resource development business.
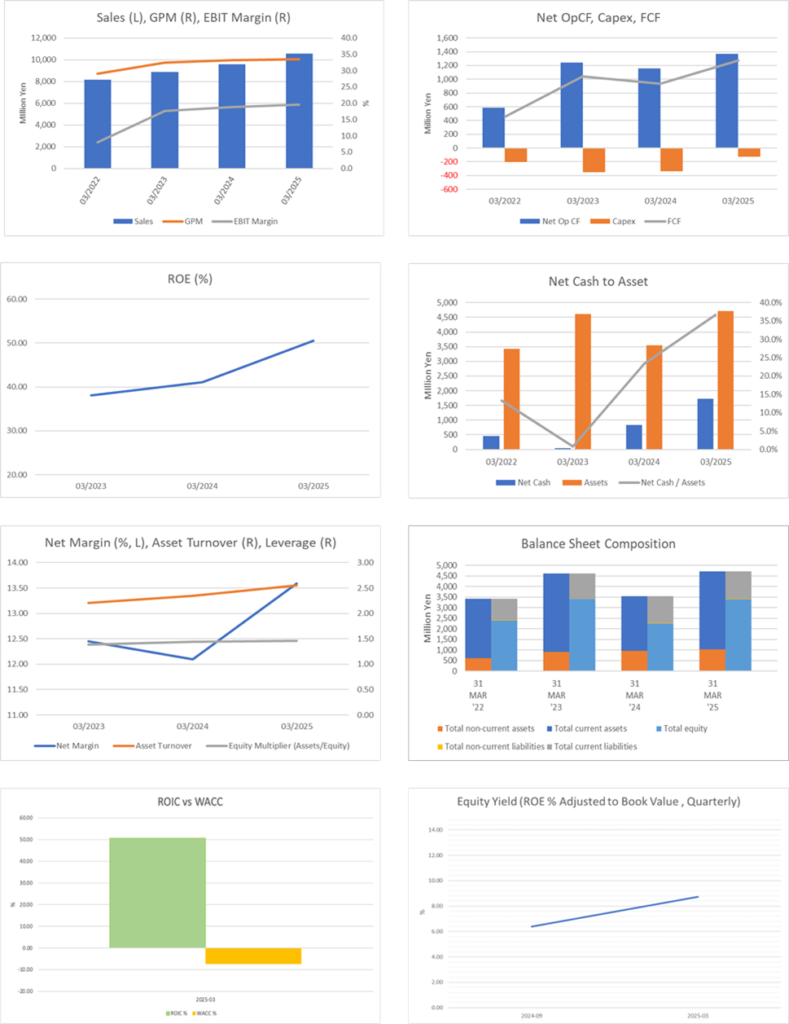
Key financial data
| Unit: million yen | 2023/3 | 2024/3 | 2025/3 | 2026/3 CE |
| Sales | 8,175 | 9,586 | 10,552 | 7,437 |
| EBIT (Operating Income) | 651 | 1,799 | 2,070 | |
| Pretax Income | 1,351 | 1,672 | 2,034 | |
| Net Profit Attributable to Owner of Parent | 1,134 | 1,160 | 1,434 | 3,207 |
| Cash & Short-Term Investments | 469 | 828 | 1,833 | |
| Total assets | 3,424 | 3,544 | 4,715 | |
| Total Debt | 10 | 0 | 103 | |
| Net Debt | -459 | -828 | -1,730 | |
| Total liabilities | 1,021 | 1,282 | 1,305 | |
| Total Shareholders’ Equity | 2,403 | 2,262 | 3,409 | |
| Net Operating Cash Flow | 588 | 1,155 | 1,372 | |
| Capital Expenditure | 202 | 335 | 127 | |
| Net Investing Cash Flow | -1,145 | 1,922 | -180 | |
| Net Financing Cash Flow | -27 | -2,288 | -187 | |
| Free Cash Flow | 455 | 933 | 1,271 | |
| ROA (%) | N/A | 28.42 | 34.72 | |
| ROE (%) | N/A | 41.04 | 50.57 | |
| EPS (Yen) | 70.6 | 72.3 | 89.4 | 199.82 |
| BPS (Yen) | 149.7 | 140.9 | 212.4 | |
| Dividend per Share (Yen) | N/A | 4.35 | 60.00 | 30.00 |
| Shares Outstanding (Million shares) | N/A | 16.05 | 16.05 |
Share price
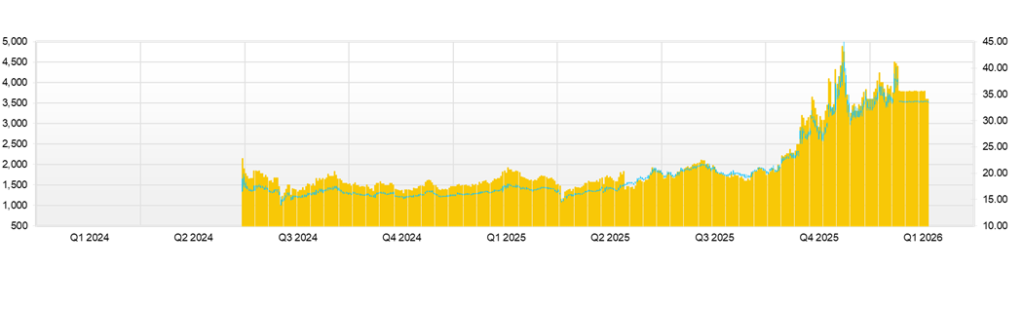
Key stock price data
Source: Omega Investment from company data, rounded to the nearest whole number.
Financial data (quarterly basis)
| Unit: million yen | 2022/3 | 2026/3 | |||||
| 1Q | 2Q | 3Q | 4Q | 1Q | 2Q | 3Q | |
| (Income Statement) | |||||||
| Sales | 2,718 | 2,548 | 2,572 | 2,714 | 2,888 | 2,921 | 2,890 |
| Year-on-year | 16.4% | 6.3% | 14.6% | 12.4% | |||
| Cost of Goods Sold (COGS) | 1,790 | 1,745 | 1,735 | 1,747 | 1,898 | 1,945 | 1,892 |
| Gross Income | 928 | 803 | 837 | 968 | 990 | 976 | 998 |
| Gross Income Margin | 34.1% | 31.5% | 32.5% | 35.6% | 34.3% | 33.4% | 34.5% |
| SG&A Expense | 394 | 366 | 358 | 347 | 452 | 401 | 420 |
| EBIT (Operating Income) | 534 | 438 | 478 | 621 | 538 | 576 | 578 |
| Year-on-year | 48.1% | 0.8% | 31.5% | 20.8% | |||
| Operating Income Margin | 19.6% | 17.2% | 18.6% | 22.9% | 18.6% | 19.7% | 20.0% |
| EBITDA | 554 | 458 | 498 | 642 | 557 | 614 | N.A. |
| Pretax Income | 504 | 437 | 479 | 614 | 540 | 573 | 591 |
| Consolidated Net Income | 335 | 286 | 326 | 486 | 364 | 423 | 396 |
| Minority Interest | 0 | 0 | 0 | 0 | 0 | 0 | 0 |
| Net Income ATOP | 335 | 286 | 326 | 486 | 364 | 423 | 396 |
| Year-on-year | 99.8% | 8.8% | 47.6% | 21.2% | |||
| Net Income Margin | 12.3% | 11.2% | 12.7% | 17.9% | 12.6% | 14.5% | 13.7% |
| (Balance Sheet) | |||||||
| Cash & Short-Term Investments | 926 | 1,208 | 1,383 | 1,833 | 1,432 | 1,531 | N.A. |
| Total assets | 3,827 | 3,743 | 3,915 | 4,715 | 4,457 | 4,492 | N.A. |
| Total Debt | 210 | 3 | 3 | 103 | 303 | 3 | N.A. |
| Net Debt | -716 | -1,205 | -1,380 | -1,730 | -1,129 | -1,528 | N.A. |
| Total liabilities | 1,517 | 1,146 | 992 | 1,305 | 1,646 | 1,259 | N.A. |
| Total Sharehjolders’ Equity | 2,310 | 2,597 | 2,923 | 3,409 | 2,810 | 3,233 | N.A. |
| (Profitability %) | |||||||
| ROA | 34.72 | 35.33 | 38.85 | N.A. | |||
| ROE | 50.57 | 57.15 | 54.87 | N.A. | |||
| (Per-share) Unit: JPY | |||||||
| EPS | 20.9 | 17.8 | 20.3 | 30.3 | 22.7 | 26.3 | 24.6 |
| BPS | 143.9 | 161.8 | 182.1 | 212.4 | 175.1 | 201.4 | N.A. |
| Dividend per Share | 0.00 | 0.00 | 0.00 | 60.00 | 0.00 | 30.00 | 0.00 |
| Shares Outstanding (milion shares) | 16.05 | 16.05 | 16.05 | 16.05 | 16.05 | 16.05 | 16.05 |
Source: Omega Investment.
The company disclosed consolidated financial results for the third quarter of FY03/2025 but has reported non-consolidated results from the third quarter of FY03/2026 onward. Accordingly, as a reference, the company has published only an income statement, based on the assumption that the financial statements remain consolidated as before as of 31 December 2025, and has not disclosed any other financial information, such as a balance sheet.
Financial data (full-year basis)
| Unit: million yen | 2022 | 2023 | 2024 |
| (Income Statement) | |||
| Sales | 8,175 | 9,586 | 10,552 |
| Year-on-year | N/A | 8.2% | 10.1% |
| Cost of Goods Sold | 5,794 | 6,406 | 7,017 |
| Gross Income | 2,381 | 3,181 | 3,535 |
| Gross Income Margin | 29.1% | 33.2% | 33.5% |
| SG&A Expense | 1,729 | 1,381 | 1,465 |
| EBIT (operating profit) | 651 | 1,799 | 2,070 |
| Year-on-year | N/A | 15.1% | 15.1% |
| Operating profit Margin | 8.0% | 18.8% | 19.6% |
| EBITDA | 698 | 1,899 | 2,152 |
| Pretax Income | 1,351 | 1,672 | 2,034 |
| Consolidated Net Income | 1,134 | 1,160 | 1,434 |
| Minority Interest | 1,134 | 1,160 | 1,434 |
| Net Income ATOP | #N/A | 5.1% | 23.6% |
| Year-on-year | 13.9% | 12.1% | 13.6% |
| Net Income Margin | |||
| (Balance Sheet) | 469 | 828 | 1,833 |
| Cash & Short-Term Investments | 3,424 | 3,544 | 4,715 |
| Total assets | 10 | 0 | 103 |
| Total Debt | -459 | -828 | -1,730 |
| Net Debt | 1,021 | 1,282 | 1,305 |
| Total liabilities | 2,403 | 2,262 | 3,409 |
| Total Shareholders’ Equity | |||
| (Cash Flow) | 588 | 1,155 | 1,372 |
| Net Operating Cash Flow | 202 | 335 | 127 |
| Capital Expenditure | -1,145 | 1,922 | -180 |
| Net Investing Cash Flow | -27 | -2,288 | -187 |
| Net Financing Cash Flow | 455 | 933 | 1,271 |
| Free Cash Flow | |||
| (Profitability ) | N/A | 28.42 | 34.72 |
| ROA (%) | N/A | 41.04 | 50.57 |
| ROE (%) | 13.87 | 12.10 | 13.59 |
| Net Margin (%) | N/A | 2.35 | 2.56 |
| Asset Turn | N/A | 1.44 | 1.46 |
| Assets/Equity | |||
| (Per-share) Unit: JPY | 70.6 | 72.3 | 89.4 |
| EPS | 149.7 | 140.9 | 212.4 |
| BPS | N/A | 4.35 | 60.00 |
| Dividend per Share | N/A | 16.05 | 16.05 |
Source: Omega Investment