2026-03-12
Home
Japanese

Omega Investment Co., Ltd.
SUMIDA CORPORATION (Company note – 4Q update)

| Share price (3/5) | ¥1,175 | Dividend Yield (12/26 CE) | 4.5 % |
| 52weeks high/low | ¥1,253/757 | ROE(12/25) | 6.0 % |
| Avg Vol (3 month) | 319.1 thou shrs | Operating margin (12/25) | 5.1 % |
| Market Cap | ¥38.90 bn | Beta (5Y Monthly) | 0.83 |
| Enterprise Value | ¥98.82 bn | Shares Outstanding | 33.109 mn shrs |
| PER (12/26 CE) | 10.6 X | Listed market | TSE Prime section |
| PBR (12/25 act) | 0.45 X |
| Click here for the PDF version of this page |
| PDF version |
The results of cost structure reforms are clearly visible. In the new fiscal year, the Company aims for further substantial increases in revenue and profit in real terms. Expectations are rising for the Mid-Term Business Plan 2026–2028, which will promote a niche-top strategy.
◇ FY12/2025 full-year results highlights: outperformance versus company forecasts, solid project wins
The FY12/2025 full-year results that SUMIDA CORPORATION (the “Company”) announced on February 6, 2026, came in above the Company’s forecasts and showed increases in both revenue and profit for the full year. Full-year revenue was 147.19 billion yen (up 2.2% YoY), operating profit was 7.44 billion yen (up 64.8% YoY), profit before income taxes was 4.83 billion yen (up 272.9% YoY), profit attributable to owners of the parent was 3.62 billion yen (up 512.4% YoY), basic earnings per share were 109.47 yen, and the annual dividend was 53 yen.
The key points of these results are the following three.
First, even in a business environment with a high degree of uncertainty, full-year revenue increased through both internal (organic) and external (inorganic) growth, and the effects of cost-structure reforms became evident.
On the revenue side, although demand softened in some areas, such as automotive-related products, xEV rapid-charging infrastructure, and solar power generation, the Company’s wide-ranging customer base and its global “Made in Market” supply network underpinned revenue. Furthermore, the Company timely acquired Schmidbauer, which is highly complementary to Sumida in terms of products and supply structure, and achieved full-year revenue growth.
| FY2024 | FY2025 | YoY (%) | |
| Aoutomotive | 87,893 | 85,415 | -2.8 |
| Industrial | 36,314 | 39,312 | 8.3 |
| CE | 19,770 | 22,466 | 13.6 |
Source: Company material
Operating profit, excluding temporary factors, increased by 720 million yen for the full year, reflecting the results of cost structure reforms. The effects of business restructuring in Europe, optimization of production capacity in China, and reductions in manufacturing overhead in China more than offset the negative impact of revenue-decreasing factors, improving profitability. It can be said that the earnings structure has become more muscular. The impact of foreign exchange gains and losses was limited.
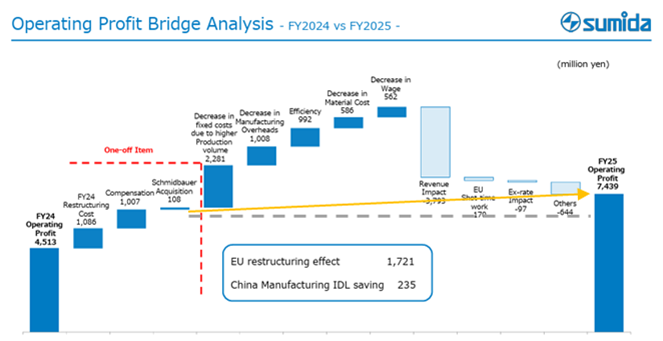
Source: Company materials, with notes by our firm.
Looking at operating profit by quarter, the Company has continued to post YoY increases since the second quarter, which is reassuring.
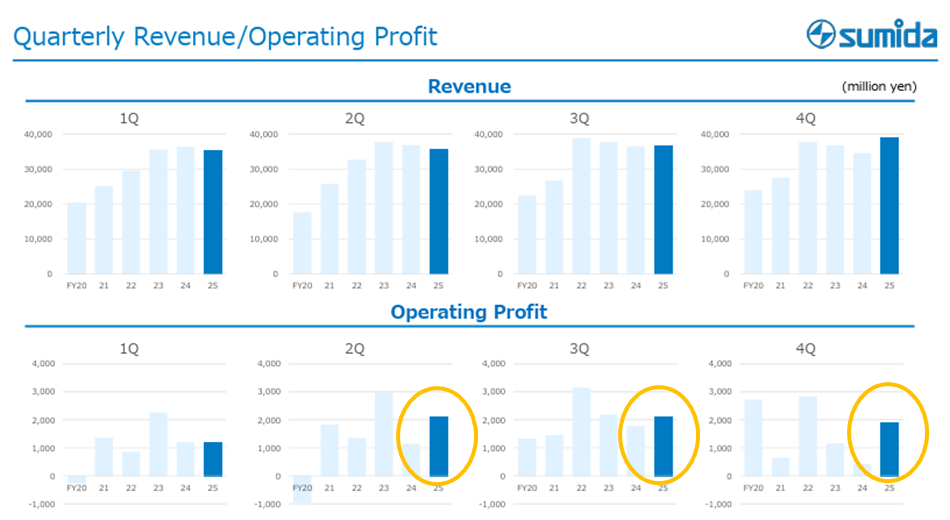
Source: Company materials, with notes by our firm.
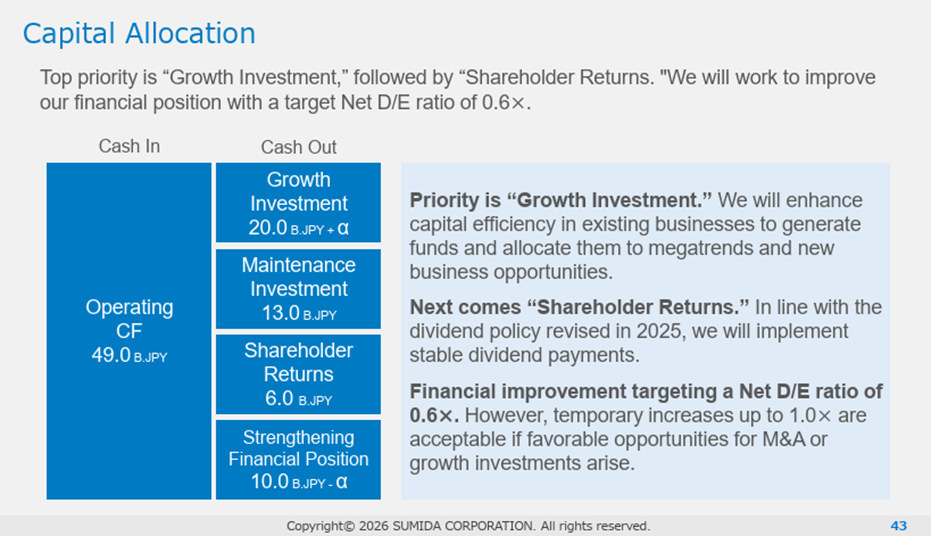
Second, the balance sheet and cash flow can be regarded as sound. The net D/E ratio stands at 0.81x, and the cash conversion cycle of 96 days is almost unchanged from the previous fiscal year in both cases. Inventory turnover days are 87 days, two days longer than in the previous fiscal year, which warrants some attention. Free cash flow was positive at 3.57 billion yen despite the large-scale acquisition.
Third, the trend in the amount of acquired projects, which serves as a leading indicator of the Company’s medium- to long-term earnings performance, is favorable. In FY12/2025, the Company acquired new projects totaling 88.0 billion yen. Although this is below the 97.0 billion yen in FY12/2024, it is larger than the 82.0 billion yen in FY12/2023. Looking at the breakdown, the temporary pause in automotive-related projects has been successfully covered by increases in the Industry and Consumer Electronics fields.
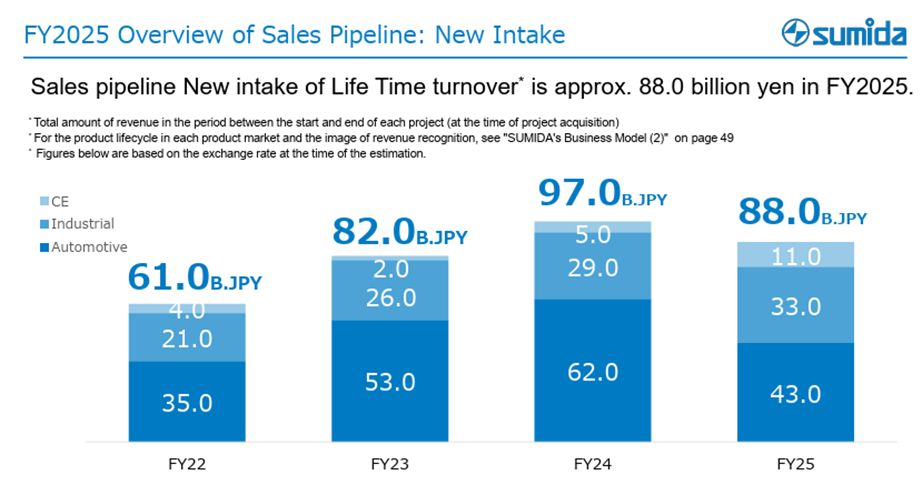
Source: Company material
◇ FY12/2026 earnings forecast: outlook for a second consecutive year of higher revenue and profit, with operating profit set to increase steadily in real terms
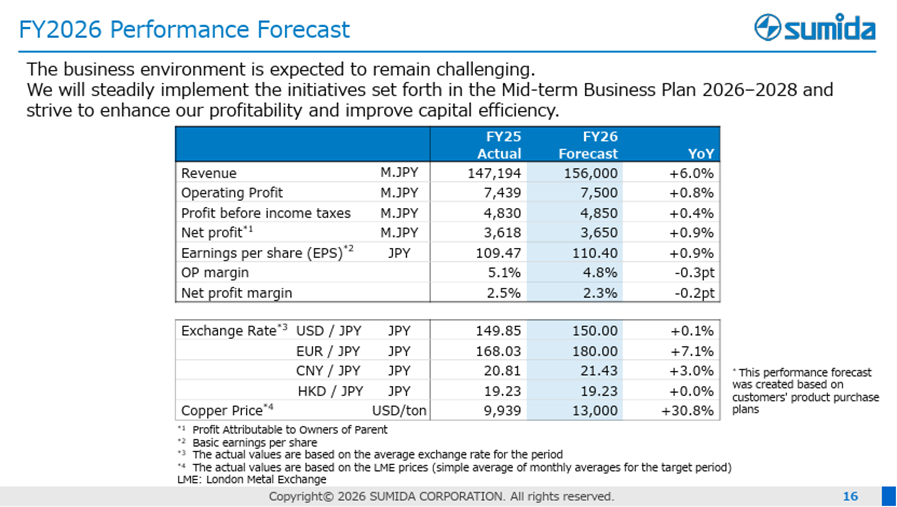
The FY12/2026 earnings forecast calls for revenue of 156.00 billion yen (up 6.0% YoY), operating profit of 7.50 billion yen (up 0.8% YoY), profit before income taxes of 4.85 billion yen (up 0.4% YoY), profit attributable to owners of the parent of 3.65 billion yen (up 0.9% YoY), basic earnings per share of 110.40 yen, and an annual dividend per share of 53 yen. The Company is thus aiming for a second consecutive year of increases in both revenue and profit.
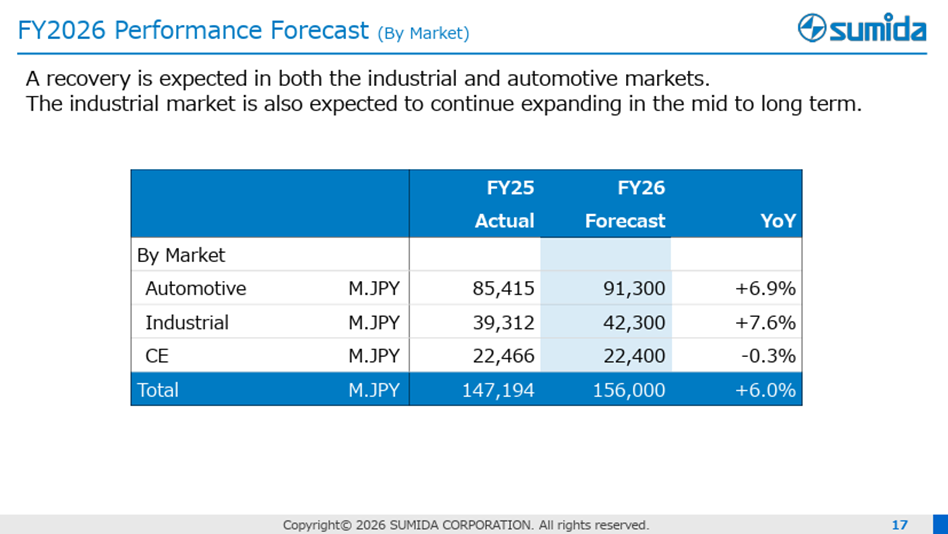
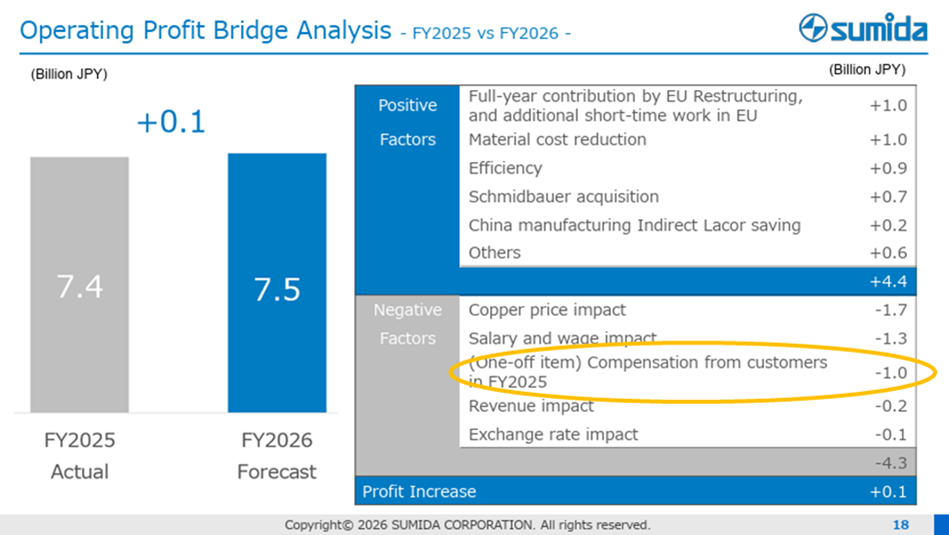
For revenue, the Company is assuming a recovery in the Industry and automotive markets, with the full-year consolidation contribution from Schmidbauer also contributing positively. On the profit and loss side, while continued positive effects are expected from revenue growth and ongoing cost structure reforms, negative factors such as higher cost of sales due to rising copper prices are also assumed.
As a result, the Company’s forecast for operating profit calls for only a 0.1 billion yen increase, but the FY12/2025 operating profit figure includes 1.0 billion yen in compensation from customers. Excluding this, the underlying increase would be 1.1 billion yen, and this should be regarded as a plan for steady profit growth.
Capital expenditures are planned at 6.8 billion yen (up 9.1% YoY), with an emphasis on profitability.
Source: Company material
Source: Company material
Source: Company material
Source: Company materials, with notes by our firm.
◇ Announcement of VISION to 2035 and the Mid-Term Business Plan 2026–2028
The Company also announced VISION to 2035 and the Mid-Term Business Plan 2026–2028 on the same day.
VISION to 2035
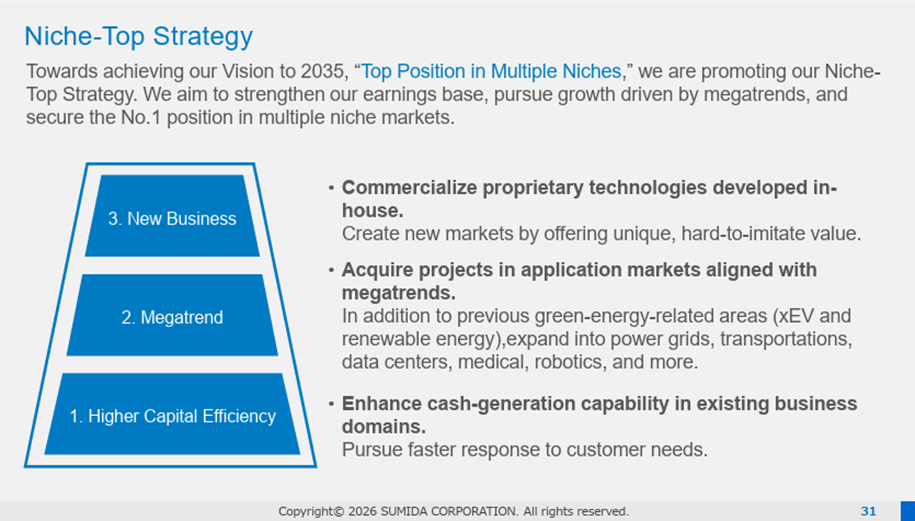
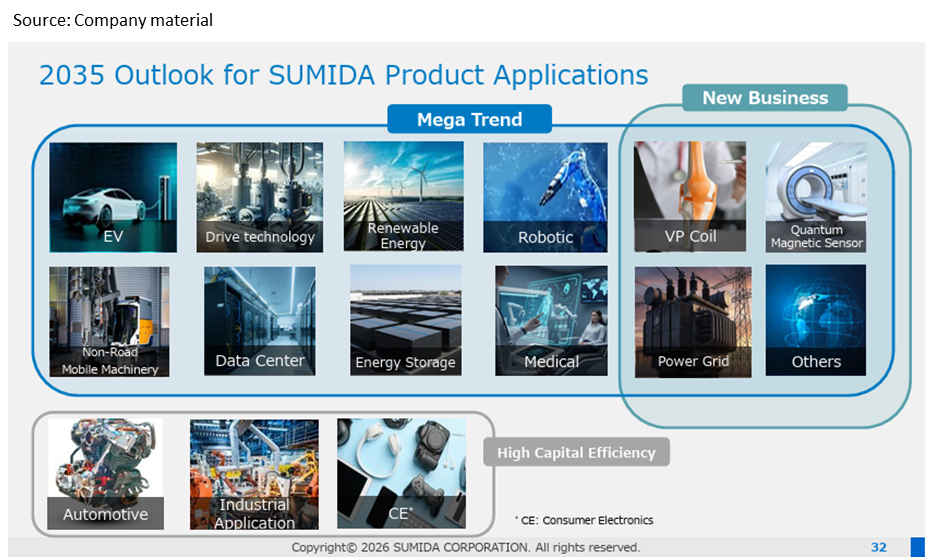
First, in its long-term vision VISION to 2035, the Company states that, based on the recognition that the fields in which it can leverage its strengths in technological capabilities, global development capabilities, and application development capabilities will expand due to responses to global warming, the implementation of AI, mobility innovation, and other factors, it will strengthen its earnings base, pursue growth driven by mega-trends, and promote a niche-top strategy that aims to be number one in multiple niche markets. The slogan is “Top Position in Multiple Niches”.
This strategy is reasonable, as it has a high likelihood of leveraging the Company’s strengths to achieve robust earnings and high capital efficiency. The precedents of many Japanese companies presented in the Ministry of Economy, Trade and Industry’s “Global Niche Top Companies Selection 100” also appear likely to provide useful reference points.
Source: Company material
Source: Company material
Mid-Term Business Plan 2026–2028
The Mid-Term Business Plan 2026–2028 has been presented as the immediate plan for achieving the VISION to 2035.
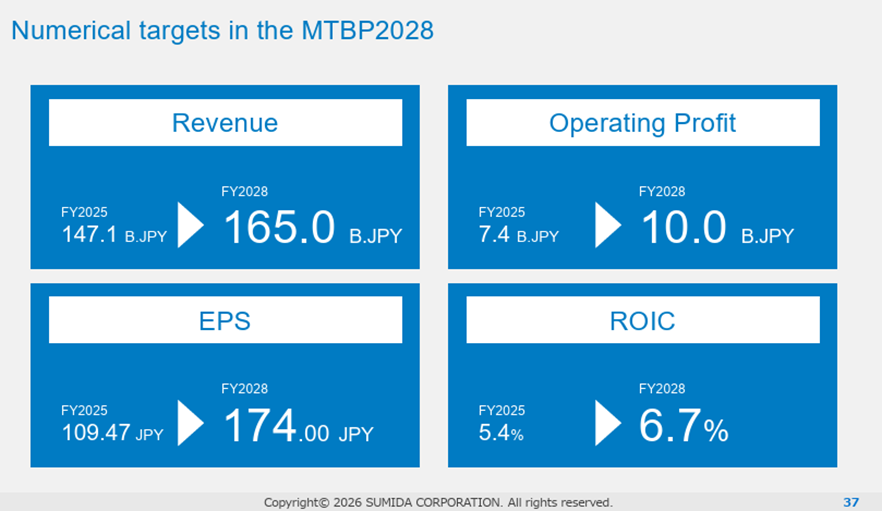
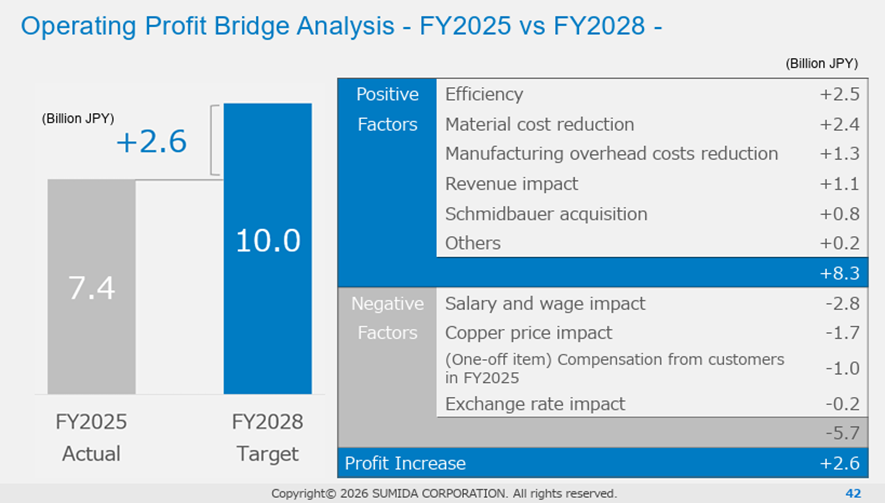
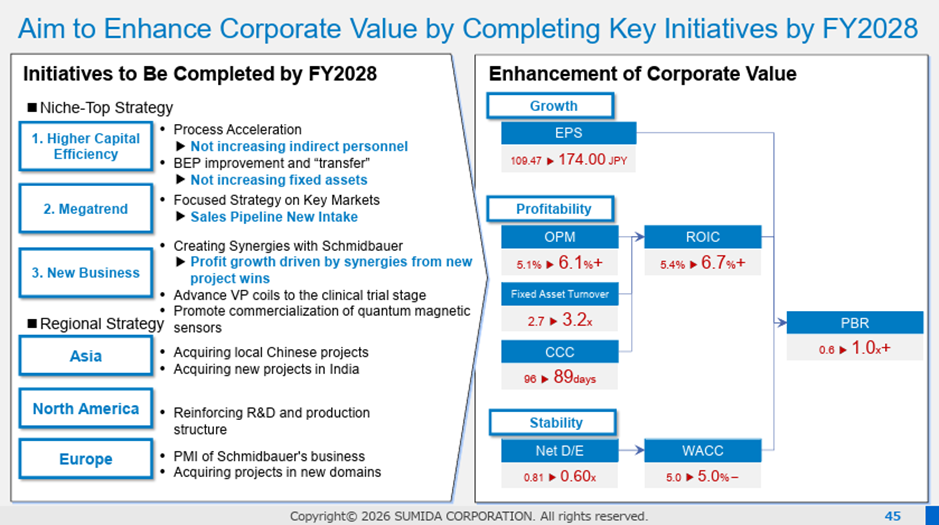
For the fiscal year ending December 2028, the numerical targets are revenue of 165.0 billion yen, operating profit of 10.0 billion yen, EPS of 174 yen, and ROIC of 6.7%. The key points are as follows: maintaining strong earning power; winning projects in mega-trend areas such as green energy-related fields, power grids, transportation, data centers, healthcare, and robotics; pursuing synergies with Schmidbauer; and promoting new niche-top businesses. The plan is to expand the ROIC–WACC spread and achieve a PBR of over 1x by improving ROIC and keeping WACC under control.
In terms of the numerical targets, they do not exceed those of the previous Mid-Term Business Plan 2024–2026, revenue of 190.0 billion yen, operating profit of 13.5 billion yen, and EPS of 272 yen, but given changes in the business environment, they can be regarded as reasonable targets.
Source: Company material
Source: Company material
Source: Company material
Source: Company material
◇ Stock price trends and points to watch going forward
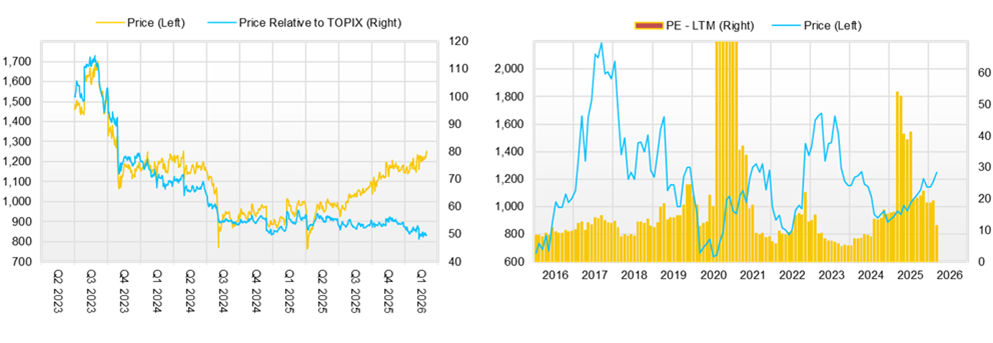
Since the announcement of the first-quarter FY12/2025 results, the Company’s stock price has been rising consistently and has continued to show a steady upward trend around the 1,200-yen level even after the announcement. From a longer-term perspective, it is also supported by a gentle upward trendline that has been in place since 2012. Background factors likely include the absence of a sense of overheating in the stock price, with a forward PER of 11.0x and a PBR of around 0.65x; steady progress in cost structure reforms; the favorable trend in acquired projects; the fact that the direction and measures of the Mid-Term Business Plan 2026–2028 described above are convincing; and the fact that the FY12/2026 earnings forecast calls for higher revenue and profit.
However, a resistance line originating from the 2017 high of 2,400 yen has also formed, and the stock price is moving within a large symmetrical triangle pattern. Accordingly, the most important point to watch going forward will be whether, when, and how PBR will exceed 1x (1,875 yen) and whether the stock price will break out of this large symmetrical triangle pattern to the upside. As expectations for achieving the final-year numerical targets of the Mid-Term Business Plan 2026–2028 rise, the stock price is expected to continue its upward trajectory.
In the near term, the points to watch are as follows. In particular, the key will be the growth curve the Company draws for the operating profit of 7.5 billion yen, which is the Company’s forecast for FY12/2026, toward the final target of 10.0 billion yen. From this perspective, we intend to monitor the Company’s progress closely, focusing on the following points.
- Trends in FY12/2026 earnings: whether the Company can further maintain and strengthen its improved earnings structure, continue to move on a stable track on a quarterly basis, and, if possible, exceed the forecast.
- Trends in acquired projects: whether the Company can steadily translate mega-trends into the number of acquired projects.
- Maximization of synergies with Schmidbauer
- Trends in exchange rates and raw material prices
Company profile
Since its founding in 1950, the Company has been a global leader in the design and manufacture of coil-related components and modules for more than 75 years. Leveraging strengths such as advanced technical design capabilities, proprietary manufacturing know-how, extensive application development capabilities, and a global production structure, the Company is engaged in contract manufacturing of custom-made coils for major customers worldwide under a “Made in Market” model. Its business is appropriately diversified across both geography and market segments.
In recent years, the Company has grown its earnings in “green energy-related” fields, but as business uncertainty has increased, it has temporarily experienced a pause in earnings. However, it has moved quickly to improve its cost structure and has also made progress in capturing external growth through the acquisition of Schmidbauer, placing earnings on a recovery track.
In 2026, the Company announced that it would pursue a niche-top strategy over the long term, and, as initiatives for the time being, announced the Mid-Term Business Plan 2024–2026. Its aim, based on its favorable cost structure, is to translate mega-trends, starting with green energy-related fields, into projects across a broad front and to lay the groundwork for product development aimed at becoming a niche-top player. The key point to watch will be how this leads to PBR exceeding 1x through improvements in ROIC and the ROIC spread.
Key financial data
| Unit: million yen | 2021 | 2022 | 2023 | 2024 | 2025 | 2026 CE |
| Sales | 104,920 | 138,600 | 147,672 | 143,978 | 147,194 | 156,000 |
| EBIT (Operating Income) | 5,669 | 7,983 | 8,829 | 5,633 | 8,084 | |
| Pretax Income | 3,898 | 6,534 | 5,856 | 1,295 | 4,830 | 4,850 |
| Net Profit Attributable to Owner of Parent | 2,629 | 5,099 | 5,064 | 590 | 3,618 | 3,650 |
| Cash & Short-Term Investments | 4,237 | 2,944 | 3,107 | 4,286 | 6,129 | |
| Total assets | 117,725 | 134,846 | 142,786 | 147,766 | 163,656 | |
| Total Debt | 54,763 | 58,546 | 57,198 | 57,975 | 64,023 | |
| Net Debt | 50,526 | 55,602 | 54,091 | 53,689 | 57,894 | |
| Total liabilities | 77,622 | 85,966 | 85,471 | 86,849 | 98,298 | |
| Total Shareholders’ Equity | 38,338 | 46,829 | 55,056 | 58,648 | 62,008 | |
| Net Operating Cash Flow | 600 | 10,566 | 18,343 | 14,928 | 16,457 | |
| Capital Expenditure | 6,737 | 9,174 | 10,914 | 9,005 | 7,347 | |
| Net Investing Cash Flow | -6,712 | -8,174 | -10,702 | -8,834 | -12,886 | |
| Net Financing Cash Flow | 4,751 | -4,130 | -7,782 | -5,268 | -1,958 | |
| Free Cash Flow | -5,212 | 2,362 | 8,539 | 7,068 | 10,224 | |
| ROA (%) | 2.44 | 4.04 | 3.65 | 0.41 | 2.32 | |
| ROE (%) | 7.37 | 11.98 | 9.94 | 1.04 | 6.00 | |
| EPS (Yen) | 96.7 | 187.5 | 167.4 | 17.9 | 109.4 | 110.4 |
| BPS (Yen) | 1,409.8 | 1,722.1 | 1,687.4 | 1,774.6 | 1,875.5 | |
| Dividend per Share (Yen) | 28.00 | 47.00 | 51.00 | 53.00 | 53.00 | 53.00 |
| Shares Outstanding (Million shares) | 27.44 | 27.44 | 32.88 | 33.10 | 33.11 |
Source: Omega Investment from company materials
Share price
Financial data (quarterly basis)
| Unit: million yen | 2023/12 | 2024/12 | 2025/12 | ||||||
| 4Q | 1Q | 2Q | 3Q | 4Q | 1Q | 2Q | 3Q | 4Q | |
| (Income Statement) | |||||||||
| Sales | 36,739 | 36,313 | 36,752 | 36,470 | 34,442 | 35,390 | 35,780 | 36,906 | 39,118 |
| Year-on-year | -2.4% | 2.1% | -2.4% | -3.3% | -6.3% | -2.5% | -2.6% | 1.2% | 13.6% |
| Cost of Goods Sold (COGS) | 32,584 | 32,014 | 32,263 | 31,656 | 30,037 | 31,007 | 30,524 | 31,618 | 33,121 |
| Gross Income | 4,155 | 4,299 | 4,489 | 4,814 | 4,405 | 4,383 | 5,256 | 5,288 | 5,997 |
| Gross Income Margin | 11.3% | 11.8% | 12.2% | 13.2% | 12.8% | 12.4% | 14.7% | 14.3% | 15.3% |
| SG&A Expense | 3,006 | 3,218 | 3,353 | 3,091 | 2,713 | 3,151 | 3,059 | 3,154 | 3,476 |
| EBIT (Operating Income) | 1,149 | 1,081 | 1,136 | 1,723 | 1,692 | 1,232 | 2,197 | 2,134 | 2,521 |
| Year-on-year | -56.3% | -51.1% | -56.2% | -40.1% | 47.3% | 14.0% | 93.4% | 23.9% | 49.0% |
| Operating Income Margin | 3.1% | 3.0% | 3.1% | 4.7% | 4.9% | 3.5% | 6.1% | 5.8% | 6.4% |
| EBITDA | 3,718 | 3,707 | 3,956 | 4,552 | 4,439 | 3,809 | 5,618 | 4,662 | 5,876 |
| Pretax Income | 387 | 464 | 268 | 951 | -389 | 802 | 1,372 | 1,455 | 1,201 |
| Consolidated Net Income | 757 | 313 | 114 | 710 | -703 | 580 | 1,053 | 965 | 984 |
| Minority Interest | 53 | -35 | -23 | -46 | -52 | -5 | -29 | -45 | 44 |
| Net Income ATOP | 702 | 348 | 137 | 756 | -652 | 585 | 1,082 | 1,010 | 941 |
| Year-on-year | -66.0% | -71.8% | -93.3% | -30.2% | -192.9% | 68.1% | 689.8% | 33.6% | 244.3% |
| Net Income Margin | 1.9% | 1.0% | 0.4% | 2.1% | -1.9% | 1.7% | 3.0% | 2.7% | 2.4% |
| (Balance Sheet) | |||||||||
| Cash & Short-Term Investments | 3,107 | 6,002 | 5,156 | 4,750 | 4,286 | 6,087 | 5,429 | 12,256 | 6,129 |
| Total assets | 142,786 | 152,361 | 159,600 | 143,335 | 147,766 | 144,110 | 142,062 | 151,308 | 163,656 |
| Total Debt | 57,198 | 63,785 | 65,509 | 58,303 | 57,975 | 58,367 | 57,039 | 62,193 | 64,023 |
| Net Debt | 54,091 | 57,783 | 60,353 | 53,553 | 53,689 | 52,280 | 51,610 | 49,937 | 57,894 |
| Total liabilities | 85,471 | 92,128 | 95,474 | 85,403 | 86,849 | 85,709 | 83,098 | 90,181 | 98,298 |
| Total Shareholders’ Equity | 55,056 | 57,875 | 61,653 | 55,751 | 58,648 | 56,205 | 56,801 | 58,947 | 62,008 |
| (Profitability %) | |||||||||
| ROA | 3.65 | 2.89 | 1.46 | 1.33 | 0.41 | 0.56 | 1.17 | 1.38 | 2.32 |
| ROE | 9.94 | 7.90 | 3.74 | 3.32 | 1.04 | 1.45 | 2.99 | 3.53 | 6.00 |
| (Per-share) Unit: JPY | |||||||||
| EPS | 21.5 | 10.7 | 4.2 | 22.9 | -19.7 | 17.7 | 32.7 | 30.6 | 28.5 |
| BPS | 1,687.4 | 1,773.8 | 1,867.5 | 1,687.0 | 1,774.6 | 1,700.6 | 1,718.1 | 1,783.0 | 1,875.5 |
| Dividend per Share | 28.00 | 0.00 | 26.00 | 0.00 | 27.00 | 0.00 | 26.00 | 0.00 | 27.00 |
| Shares Outstanding (million shares) | 32.88 | 32.88 | 33.04 | 33.10 | 33.10 | 33.10 | 33.11 | 33.11 | 33.11 |
Source: Omega Investment from company materials
Financial data (full-year basis)
| Unit: million yen | 2016 | 2017 | 2018 | 2019 | 2020 | 2021 | 2022 | 2023 | 2024 | 2025 |
| (Income Statement) | ||||||||||
| Sales | 81,052 | 90,153 | 97,538 | 94,283 | 84,417 | 104,920 | 138,600 | 147,672 | 143,978 | 147,194 |
| Year-on-year | -6.0% | 11.2% | 8.2% | -3.3% | -10.5% | 24.3% | 32.1% | 6.5% | -2.5% | 2.2% |
| Cost of Goods Sold | 66,191 | 75,019 | 82,192 | 81,414 | 73,319 | 89,563 | 119,298 | 126,561 | 125,970 | 126,270 |
| Gross Income | 14,861 | 15,134 | 15,346 | 12,869 | 11,098 | 15,357 | 19,302 | 21,111 | 18,008 | 20,924 |
| Gross Income Margin | 18.3% | 16.8% | 15.7% | 13.6% | 13.1% | 14.6% | 13.9% | 14.3% | 12.5% | 14.2% |
| SG&A Expense | 8,507 | 8,837 | 9,694 | 9,330 | 8,798 | 9,688 | 11,319 | 12,282 | 12,375 | 12,840 |
| EBIT (Operating Income) | 6,354 | 6,297 | 5,652 | 3,539 | 2,300 | 5,669 | 7,983 | 8,829 | 5,633 | 8,084 |
| Year-on-year | 50.0% | -0.9% | -10.2% | -37.4% | -35.0% | 146.5% | 40.8% | 10.6% | -36.2% | 43.5% |
| Operating Income Margin | 7.8% | 7.0% | 5.8% | 3.8% | 2.7% | 5.4% | 5.8% | 6.0% | 3.9% | 5.5% |
| EBITDA | 9,251 | 9,574 | 9,660 | 8,848 | 8,247 | 12,337 | 16,103 | 18,190 | 16,655 | 19,965 |
| Pretax Income | 5,469 | 5,697 | 4,061 | 2,184 | 1,470 | 3,898 | 6,534 | 5,856 | 1,295 | 4,830 |
| Consolidated Net Income | 3,844 | 4,628 | 2,531 | 1,596 | 839 | 2,695 | 5,168 | 5,102 | 434 | 3,582 |
| Minority Interest | 178 | 123 | 110 | 13 | 11 | 66 | 68 | 37 | -156 | -35 |
| Net Income ATOP | 3,666 | 4,504 | 2,420 | 1,582 | 828 | 2,629 | 5,099 | 5,064 | 590 | 3,618 |
| Year-on-year | 80.4% | 22.9% | -46.3% | -34.6% | -47.7% | 217.5% | 94.0% | -0.7% | -88.3% | 513.2% |
| Net Income Margin | 4.5% | 5.0% | 2.5% | 1.7% | 1.0% | 2.5% | 3.7% | 3.4% | 0.4% | 2.5% |
| (Balance Sheet) | ||||||||||
| Cash & Short-Term Investments | 3,546 | 5,375 | 4,098 | 3,286 | 5,237 | 4,237 | 2,944 | 3,107 | 4,286 | 6,129 |
| Total assets | 69,007 | 84,366 | 94,277 | 96,561 | 98,063 | 117,725 | 134,846 | 142,786 | 147,766 | 163,656 |
| Total Debt | 30,611 | 35,836 | 40,206 | 43,646 | 44,586 | 54,763 | 58,546 | 57,198 | 57,975 | 64,023 |
| Net Debt | 27,065 | 30,461 | 36,108 | 40,360 | 39,349 | 50,526 | 55,602 | 54,091 | 53,689 | 57,894 |
| Total liabilities | 46,982 | 54,242 | 58,835 | 61,963 | 63,503 | 77,622 | 85,966 | 85,471 | 86,849 | 98,298 |
| Total Shareholders’ Equity | 20,629 | 28,570 | 33,829 | 33,013 | 32,990 | 38,338 | 46,829 | 55,056 | 58,648 | 62,008 |
| (Cash Flow) | ||||||||||
| Net Operating Cash Flow | 8,291 | 3,658 | 4,672 | 8,732 | 9,107 | 600 | 10,566 | 18,343 | 14,928 | 16,457 |
| Capital Expenditure | 5,024 | 9,511 | 9,610 | 8,302 | 6,765 | 6,737 | 9,174 | 10,914 | 9,005 | 7,347 |
| Net Investing Cash Flow | -4,961 | -9,254 | -15,153 | -8,133 | -6,669 | -6,712 | -8,174 | -10,702 | -8,834 | -12,886 |
| Net Financing Cash Flow | -3,016 | 7,389 | 9,477 | -1,261 | -447 | 4,751 | -4,130 | -7,782 | -5,268 | -1,958 |
| Free Cash Flow | 3,941 | -5,173 | -3,769 | 1,379 | 3,118 | -5,212 | 2,362 | 8,539 | 7,068 | 10,224 |
| (Profitability ) | ||||||||||
| ROA (%) | 5.36 | 5.87 | 2.71 | 1.66 | 0.85 | 2.44 | 4.04 | 3.65 | 0.41 | 2.32 |
| ROE (%) | 19.27 | 18.31 | 7.76 | 4.74 | 2.51 | 7.37 | 11.98 | 9.94 | 1.04 | 6.00 |
| Net Margin (%) | 4.52 | 5.00 | 2.48 | 1.68 | 0.98 | 2.51 | 3.68 | 3.43 | 0.41 | 2.46 |
| Asset Turn | 1.18 | 1.18 | 1.09 | 0.99 | 0.87 | 0.97 | 1.10 | 1.06 | 0.99 | 0.95 |
| Assets/Equity | 3.60 | 3.12 | 2.86 | 2.86 | 2.95 | 3.03 | 2.97 | 2.72 | 2.56 | 2.58 |
| (Per-share) Unit: JPY | ||||||||||
| EPS | 157.9 | 176.4 | 90.2 | 58.3 | 30.5 | 96.7 | 187.5 | 167.4 | 17.9 | 109.4 |
| BPS | 888.8 | 1,069.6 | 1,250.0 | 1,216.1 | 1,213.7 | 1,409.8 | 1,722.1 | 1,687.4 | 1,774.6 | 1,875.5 |
| Dividend per Share | 34.00 | 45.00 | 27.00 | 24.00 | 9.00 | 28.00 | 47.00 | 51.00 | 53.00 | 53.00 |
| Shares Outstanding (million shares) | 23.94 | 27.44 | 27.44 | 27.44 | 27.44 | 27.44 | 27.44 | 32.88 | 33.10 | 33.11 |
Source: Omega Investment from company materials