2026-03-30
Home
Japanese

Omega Investment Co., Ltd.
Kidswell Bio (Investment report – 3Q update)
| Share price (3/9) | ¥264 | Dividend Yield (26/3 CE) | – % |
| 52weeks high/low | ¥93/417 | ROE(25/3 act) | -1.6 % |
| Avg Vol (3 month) | 1,658.5 thou shrs | Operating margin (25/3 act) | 0.5 % |
| Market Cap | ¥13.09 bn | Beta (5Y Monthly) | 1.22 |
| Enterprise Value | ¥13.18 bn | Shares Outstanding | 49.611 mn shrs |
| PER (26/3 CE) | – X | Listed market | TSE Growth |
| PBR (25/3 act) | 6.9 X |
| Click here for the PDF version of this page |
| PDF version |
Operating profit confirmed; a phase to increase holdings on the back of an improved earnings base
Investment conclusion
The investment stance toward the shares of Kidswell Bio Corporation (the “Company”) is raised one notch from the previous “slightly bullish” view. The weighting in portfolios is intended to be increased. The Company’s shares trade at a high PBR and also have a high beta of around 1.5. In addition, as pointed out in the previous report, the share price is prone to fluctuation depending on factors such as upside or downside in earnings, progress in development and alliances, fund-raising, and the timing of expense recognition. In portfolio management, a core holding should be maintained while using the share price movements around earnings announcements and disclosure events to increase holdings on dips. The increase in the portfolio weighting should not be carried out all at once; rather, the timing and size of incremental purchases should be adjusted in line with the digestion of news flow and the accumulation of earnings support. Even at present, with market capitalization of 12.9 billion yen and an actual PBR of 6.92x, market expectations are high. For this reason, instead of aggressively buying up the stock, it is easier to curb valuation adjustment risk by increasing holdings stepwise at each stage where progress on news flow and corroboration by earnings figures accumulates.
The primary reason for raising the investment stance is that the shift into the black has become clearer. In the cumulative 3Q of FY3/2026, the Company recorded net sales of 5.02 billion yen, gross profit of 1.33 billion yen, and operating profit of 84 million yen, while increasing R&D expenses to 671 million yen, and maintained operating profitability. The view emphasized in the previous report, “simultaneous progress in structural improvement and growth investment,” can be confirmed in the P&L, and this can be taken as a step toward moving from outlook to actual results. Accordingly, this can be characterized as a phase in which investment should move from a wait-and-see stance to raising positions in line with the increased certainty of improvement.
What needs to be borne in mind is that in the short term, bottom-line profit is prone to fluctuation, and the higher the PBR, the more likely the share price reaction is to be amplified. In the cumulative 3Q, non-operating expenses included 75 million yen in fees paid and a 125 million yen loss on disposal of inventories, resulting in an ordinary loss of 135 million yen and a quarterly net loss of 143 million yen. This can be seen not as a deterioration in the business environment but as a result of short-term cost and operational factors causing profit to swing. Without making short-term profit-taking the primary purpose, the pace of increasing holdings and the portfolio weighting should be managed while checking (i) whether unexpected expenses remain one-off in nature (assessing the potential for recurrence) and (ii) whether the buildup of gross profit is continuing. In phases where the share price overheats on the back of expectations, the pace of increasing holdings should not be rushed, and buying capacity should be conserved in preparation for additional investment on dips.
The appeal of the Company lies in its two-layer structure under which upside potential in future earnings is built up through cell therapy and new biosimilars, grounded in the cash-generating capacity of biosimilars. This time, full-year earnings forecasts have been revised to net sales of 6.0–6.5 billion yen and operating profit of -100 million to +100 million yen, with the background explained as firm biosimilar demand and price revisions. Such revisions serve as a factor underpinning the share price, but at the same time can give rise to phases in which expectations for a move into the black run ahead and are quickly priced into the shares.
The Company is in a phase of consolidating the establishment of consolidated operating profitability while waiting for the results of growth investments to emerge. Accordingly, rather than a concentrated short-term investment, the policy should be to adjust the pace of increasing holdings while confirming earnings support and KPI trends, and to raise the portfolio weighting stepwise.
◇ FY3/2026 3Q results highlights: progress toward profitability, but bottom-line profit remains prone to fluctuation due to non-operating expenses
In the FY3/2026 3Q results, while operating profit remained in the black from 2Q and improved from an operating loss to an operating profit YoY, thereby confirming an improvement in the earnings structure, an increase in non-operating expenses dragged down bottom-line profit and remained an issue. In the cumulative 3Q, net sales expanded to 5.02 billion yen (+65.3% YoY) and gross profit to 1.33 billion yen (+29.0% YoY), and operating income came to 84 million yen (compared with an operating loss of 137 million yen in the same period of the previous year). The greatest positive factor is that the structure in which gross profit increases in line with growth in sales has become clearer, as the manufacturing and delivery of biosimilar APIs and other products progressed according to plan, and supply price revisions also contributed. Although R&D expenses increased to 671 million yen, the fact that operating profit was maintained indicates that the earnings base has reached a stage where R&D investment can be absorbed.
Ordinary loss was 135 million yen, and loss attributable to the parent’s owners was 143 million yen. The reason was that fees paid of 75 million yen and a 125 million yen loss on disposal of inventories were recorded as non-operating expenses. In particular, the recognition of a loss on disposal of inventories demonstrated that costs arising from manufacturing and supply operations can influence bottom-line profit. Even when operating profit is positive, the presence or absence of one-off expenses can alter the appearance of bottom-line profit. Therefore, points of focus lie not only in sales growth but in two aspects: (i) the repeatability of operating profitability (whether the structure under which sales growth translates into profit is maintained) and (ii) the extent to which one-off expenses affect bottom-line profit. In addition, although it has been indicated that steady demand for biosimilar APIs and other products continues, the recognition of a loss on the disposal of inventories confirms the importance of being able to curb inventory and process-control cost fluctuations. If recurrence prevention and strengthening of process control, including at contractors, proceed, this will not readily become a factor that immediately negates the improvement in profitability at the operating profit level.
The full-year outlook has been revised upward to net sales of 6.0–6.5 billion yen and operating profit of -100 million to +100 million yen. As of 3Q, sales progress remains high, and strength on the volume side is evident, but the fact that the profit plan is presented as a range suggests the outcome can fluctuate depending on the timing of expenses. The dividing lines in the evaluation of the share price and earnings are concentrated in two points: (i) whether the buildup of gross profit continues into 4Q, and (ii) whether non-operating expenses and manufacturing-related losses can be prevented from recurring.
The fact that operating profit has remained in the black from 2Q and has improved from an operating loss to an operating profit YoY is a positive factor, but when non-operating expenses arise, bottom-line profit becomes more difficult to read. The buildup of gross profit and the recurrence or absence of unexpected expenses should be reviewed quarterly.
◇ Segment analysis: a two-layer structure that generates profit with biosimilars and expands corporate value with cell therapy
The Company’s business structure is a clear two-layer model in which biosimilars secure current earnings and cell therapy expands corporate value over the medium to long term. In the cumulative 3Q of FY3/2026, net sales of 5.02 billion yen, gross profit of 1.33 billion yen, and operating profit of 84 million yen were recorded, indicating that the biosimilar business currently supports earnings. Cell therapy is at the R&D stage and is in a phase of building up future pipeline value rather than short-term earnings.
The biosimilar business is a model centered on supplying APIs and other products for already-launched products. Customers are domestic partner pharmaceutical companies and others, and the business operates along manufacturing and supply schedules adjusted with partners. In the cumulative 3Q, gross profit expanded to 1.33 billion yen YoY, with increased supply volumes and price revisions driving profit higher. The fact that operating profit has been secured while absorbing 671 million yen in R&D expenses suggests that the profitability structure of this business has entered a certain stable range. However, as evidenced by the recognition of a loss on the disposal of inventories, the possibility remains that cost fluctuations associated with manufacturing and supply operations will affect profit and loss. The sustainability of earnings will be determined by how supply stability is ensured as volumes expand.
The cell therapy business is centered on developing regenerative medicine pipelines using stem cells from human exfoliated deciduous teeth (SHED), with SQ-SHED, independently developed by the Company’s wholly owned subsidiary S-Quatre, targeting pediatric cerebral palsy at the core. At present, its contribution to sales is limited. Agreement on and advice regarding a clinical trial plan targeting cerebral palsy using allogeneic (off-the-shelf) SQ-SHED has been confirmed in a pre-IND meeting with the U.S. FDA (Food and Drug Administration), and the business has entered a concrete step toward overseas clinical trials, which is an important development. If successful, the earnings impact will be substantial, but uncertainties remain high regarding clinical trial progress, regulatory responses, and funding burden.
The key KPIs for biosimilars are volumes, prices, and manufacturing stability, and for cell therapy, achievement of development milestones. It is essential to view the two businesses separately, confirming downside support for the share price through the biosimilar business and assessing the extent of upside potential in the cell therapy business.
◇ FY3/2026 earnings forecast: moving toward break-even this fiscal year; focus on stable profitability in FY3/2027
In FY3/2026, the likelihood has increased that operating income will return to around the break-even level, and, going forward, whether operating profitability can be established stably in FY3/2027 will become the central point in investment decisions. The Company’s plan for FY3/2026 has been revised upward to net sales of 6.0–6.5 billion yen and operating profit of -100 million to +100 million yen. As of 3Q, net sales of 5.02 billion yen represent a high progress rate. Firm demand for biosimilar APIs and other products and the effect of price revisions form the backdrop, and downside risk on the volume side is currently seen as limited.
The fact that the profit plan is presented as a range indicates a structure in which the outcome can fluctuate depending on the occurrence of expenses. In fact, although an operating profit of 84 million yen was secured in the cumulative 3Q, a bottom-line loss was recorded due to non-operating expenses. Key points in evaluating the earnings outlook are (i) maintaining and improving gross margin, (ii) curbing manufacturing process-related costs and one-off expenses, and (iii) controlling R&D expenses. R&D expenses total 671 million yen on a cumulative basis, and with front-loaded investment continuing, they may remain on an upward trend depending on the progress of the cell therapy pipeline. However, if the structure under which gross profit accumulates is maintained, a scenario can be envisaged in which operating profit expands while absorbing R&D investment.
From a medium-term perspective, expansion of the biosimilar business and strengthening of domestic manufacturing infrastructure will form the foundation for stable earnings. The Company has agreed to establish a joint venture with Alfresa Holdings, Chiome Bioscience, and Mycenax Biotech, and the framework for building a fully integrated domestic supply chain has been put in place. This is expected to lead to lower costs and improved supply stability in the future. In addition, in a pre-IND meeting with the U.S. FDA, agreement on the clinical trial plan for cerebral palsy has been confirmed, and the cell therapy business has entered the preparation stage for overseas development. Although the probability of success remains uncertain, the business has the potential to boost corporate value with each milestone achieved.
Risk factors include additional manufacturing costs, R&D delays, and changes in the funding environment. On the other hand, by concluding a syndicated loan agreement, working capital for manufacturing biosimilar APIs and other products has been secured, and short-term cash management risk is contained.
FY3/2026 is a transition period from shrinking losses to establishing profitability. If earnings from biosimilars expand as planned, a scenario in which operating profitability is firmly established from FY3/2027 onward comes into sufficient view.
In the short term, profit will fluctuate, but if gross profit continues to accumulate, stable profitability is realistic. The absence or presence of recurrence of manufacturing-related costs and progress in milestones in cell therapy should serve as the axes of medium-term evaluation.
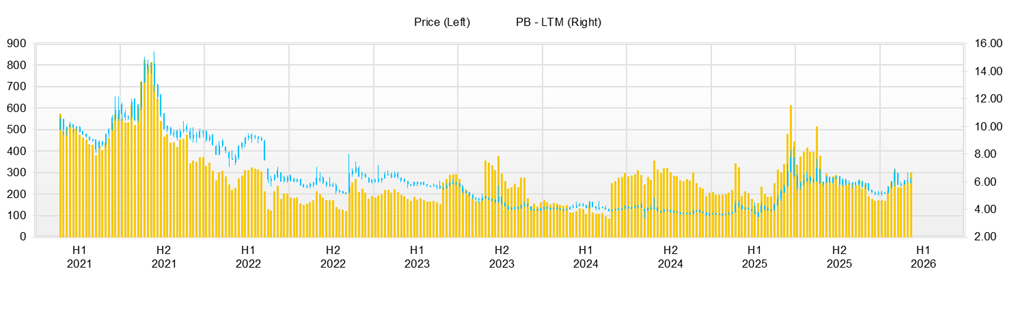
◇ Share price trend and key points to watch: in a phase of large share price volatility, focus on the repeatability of profitability and cost control
Over the past three months (early November 2025 to mid-February 2026), the share price has tended to soar on positive news. Still, it has been pushed back when the repeatability of solid earnings performance is not visible. The market is now in a phase where the direction of the share price is determined more by the probability of results being reflected in numbers than by the size of news flow. The share price has risen only slightly from a closing price of 246 yen on November 4, 2025, to 262 yen on February 13, 2026. Still, during this period there was a sharp rally to a high of 320 yen on January 22, 20,26 with trading volume of 22.21 million shares, confirming a characteristic whereby volatility can surge rapidly due to inflows and outflows of short-term money.
In terms of valuation, the actual PBR is 6.92x, and the Company’s forecast PER cannot be calculated. The market is in a situation where it readily anticipates and prices in the establishment of profitability. At this level, unless it can be demonstrated that the same level of earnings can be maintained in the next quarter, the share price is more prone to profit-taking on rallies than to sustained moves to new highs. In fact, following the sharp rally on January 22, the closing price adjusted in the short term to 302 yen on the 23rd, 275 yen on the 26th, and 254 yen on the 28th, indicating that the digestion of news flow is rapid.
The market’s reaction to news flow is easier to understand if separated into share price movements immediately after announcements and subsequent trends. On November 25, 2025, the Company announced (i) that agreement and advice had been obtained regarding a clinical trial plan for allogeneic SQ-SHED targeting cerebral palsy in a pre-IND meeting with the U.S. FDA, and (ii) that an agreement had been concluded for the establishment of a joint venture company to manufacture biosimilar APIs and drug products. Immediately thereafter, the share price rose from a closing price of 226 yen on November 25 to 233 yen (+3.1%) on the 26th and 249 yen (+10.2%) on the 28th, reflecting the market’s response to overseas expansion of cell therapy and strengthening of supply capacity. In addition, on November 26, the Company announced the conclusion of a syndicated loan agreement to secure working capital for the manufacture of biosimilar APIs and other products, which may also have provided a tailwind.
When earnings announcements fall within the range of market expectations, the share price reaction tends to be muted. Around the earnings announcement on February 12, 2026, the share price reaction was limited, with the closing price rising only modestly from 258 yen on February 12 to 262 yen (+1.6%) on the 13th. This can be interpreted as the market having already priced in some progress in operating profitability and now looking for the sustainability of profitability and the suppression of volatility in expenses. According to the Company, past recognition of losses on disposal of inventories is attributed to deviations in manufacturing processes at CDMOs (contract development and manufacturing organizations). The fact that recurrence of such costs can dampen investor sentiment is likely to be a factor weighing on the upside of the share price.
From a technical perspective, on the downside, the closing price of 226 yen on November 25 and the area around 225 yen in early January are first likely to be watched, and above that, the low price band in February, 238 yen on the 6th and 246 yen on the 13th, is likely to be perceived as short-term support. On the upside, the area around 300 yen (the closing price of 302 yen on January 23), where profit-taking emerged after the sharp rally, and 320 yen (the high on January 22) are clear resistance levels.
The conditions for raising holdings can be narrowed down to three points. First, the buildup of gross profit continues across quarters, and operating profitability is not accidental. Second, unexpected expenses, such as fees paid and losses on the disposal of inventories, are kept from recurring, and the visibility of profit improves. Third, that progress in cell therapy (SQ-SHED) and the supply system is made concrete with respect to the next milestones, schedule, and approximate level of investment. In terms of investment timing, practical approaches include (i) increasing positions in phases where upward revisions to earnings outlooks or improvements in expenses can be confirmed and profit visibility becomes clearer, and (ii) adding to positions in phases where the share price declines due to deterioration in the market environment or one-off expenses, while checking the buildup of gross profit, the absence or presence of recurrence of unexpected expenses, and progress in development and alliances.
In phases where the share price moves ahead of fundamentals on news flow, it is important to verify whether the content will actually translate into earnings and cash generation and to judge whether the share price level is appropriate calmly.
The share price jumps on news flow, but repeatability of profitability is required to justify a PBR in the 6x range. Establishing a share price in the 300 yen range requires the repeatability of profitability and suppression of volatility in expenses. Unless progress is sustained, moves to new highs are unlikely. In phases where the repeatability of operating profitability is confirmed, the share price level can be expected to be reassessed.
Company profile
◇ Growth design that simultaneously pursues overseas expansion of cell therapy and enhancement of supply capacity, leveraging the earnings base of biosimilars
Kidswell Bio Corporation adopts a two-layer business model, securing recurring earnings from biosimilars while fostering cell therapy (regenerative medicine) through R&D investment. In the biosimilar business, supplying APIs and other products to partner pharmaceutical companies is the pillar of earnings, and profitability is being improved as appropriate supply price adjustments are implemented. The cell therapy business is in a stage of developing innovative treatments mainly for pediatric and rare diseases, with front-loaded R&D investment, but in November 2025 the Company disclosed that in a pre-IND meeting with the U.S. FDA, agreement and advice had been obtained regarding a corporate clinical trial plan for allogeneic (off-the-shelf) SQ-SHED targeting cerebral palsy, and progress in preparations for overseas development is a factor that extends the scope of the business. On the supply capacity side, the Company has concluded a syndicated loan agreement arranged by Mizuho Bank to secure working capital for manufacturing biosimilar APIs and other products. It has clearly identified the maintenance and strengthening of a stable supply system capable of responding to strong demand as a management issue.
Key financial data
| Unit: million yen | 2020 | 2021 | 2022 | 2023 | 2024 | 2025 CE |
| Sales | 997 | 1,569 | 2,776 | 2,431 | 5,082 | 6,000 〜6,500 |
| EBIT (Operating Income) | -970 | -976 | -551 | -1,336 | 28 | -100 〜100 |
| Pretax Income | -1,000 | -550 | -656 | -1,421 | 73 | |
| Net Profit Attributable to Owner of Parent | -1,001 | -551 | -657 | -1,422 | -21 | |
| Cash & deposits | 1,461 | 1,161 | 1,067 | 2,231 | 2,995 | |
| Total assets | 3,934 | 3,470 | 3,895 | 5,086 | 7,008 | |
| Total Debt | 1,100 | 700 | 1,950 | 2,575 | 1,838 | |
| Net Debt | -361 | -461 | 883 | 344 | -1,157 | |
| Total liabilities | 2,324 | 1,767 | 2,661 | 4,254 | 5,598 | |
| Total Shareholders’ Equity | 1,610 | 1,703 | 1,234 | 831 | 1,411 | |
| Net Operating Cash Flow | -1,267 | -1,170 | -1,421 | -454 | 937 | |
| Capital Expenditure | 3 | 0 | 0 | 0 | 6 | |
| Net Investing Cash Flow | -22 | 527 | -29 | 0 | 65 | |
| Net Financing Cash Flow | 718 | 369 | 1,356 | 1,618 | -240 | |
| ROA (%) | -26.61 | -14.88 | -17.85 | -31.67 | -0.35 | |
| ROE (%) | -64.66 | -33.25 | -44.78 | -137.73 | -1.89 | |
| EPS (Yen) | -34.8 | -17.9 | -20.8 | -40.2 | -0.5 | |
| BPS (Yen) | 54.4 | 54.2 | 38.5 | 21.4 | 32.2 | |
| Dividend per Share (Yen) | 0.00 | 0.00 | 0.00 | 0.00 | 0.00 | 0.00 |
| Shares Outstanding (Million shares) | 29.06 | 31.44 | 31.90 | 37.31 | 40.66 |
Source: Omega Investment from company data, rounded to the nearest whole number
Share price
Key stock price data
Financial data (quarterly basis)
| Unit: million yen | 2024/3 | 2025/3 | 2026/3 | ||||||
| 3Q | 4Q | 1Q | 2Q | 3Q | 4Q | 1Q | 2Q | 3Q | |
| (Income Statement) | |||||||||
| Sales | 985 | 864 | 483 | 1,267 | 1,286 | 2,046 | 1,721 | 1,556 | 1,743 |
| Year-on-year | 61.3% | -17.6% | 950.4% | 136.4% | 30.6% | 136.6% | 256.3% | 22.8% | 35.5% |
| Cost of Goods Sold (COGS) | 352 | 688 | 259 | 998 | 748 | 1,436 | 1,123 | 1,160 | 1,405 |
| Gross Income | 633 | 176 | 224 | 269 | 538 | 610 | 597 | 396 | 337 |
| Gross Income Margin | 64.3% | 20.4% | 46.3% | 21.2% | 41.8% | 29.8% | 34.7% | 25.4% | 19.4% |
| SG&A Expense | 580 | 845 | 383 | 372 | 414 | 444 | 413 | 365 | 468 |
| EBIT (Operating Income) | 53 | -669 | -159 | -104 | 125 | 166 | 185 | 31 | -131 |
| Year-on-year | -135.9% | 60.9% | -65.1% | -60.9% | 136.8% | -124.8% | -216.2% | -129.6% | -205.3% |
| Operating Income Margin | 5.3% | -77.3% | -32.9% | -8.2% | 9.7% | 8.1% | 10.7% | 2.0% | -7.5% |
| EBITDA | 53 | -668 | -159 | -103 | 125 | 166 | 185 | 31 | -131 |
| Pretax Income | 35 | -676 | -176 | -65 | 107 | 207 | 176 | -88 | -212 |
| Consolidated Net Income | 33 | -675 | -177 | -65 | 54 | 167 | 157 | -97 | -203 |
| Minority Interest | 0 | 0 | 0 | 0 | 0 | 0 | 0 | 0 | 0 |
| Net Income ATOP | 33 | -675 | -177 | -65 | 54 | 167 | 157 | -97 | -203 |
| Year-on-year | -121.6% | 45.9% | -62.5% | -79.0% | 64.4% | -124.7% | -188.9% | 48.3% | -476.5% |
| Net Income Margin | 3.3% | -78.0% | -36.6% | -5.1% | 4.2% | 8.1% | 9.1% | -6.2% | -11.7% |
| (Balance Sheet) | |||||||||
| Cash & Short-Term Investments | 2,187 | 2,231 | 1,167 | 1,695 | 1,318 | 2,995 | 2,840 | 1,542 | 3,785 |
| Total assets | 5,199 | 5,086 | 4,609 | 4,646 | 4,575 | 7,008 | 6,579 | 5,815 | 6,320 |
| Total Debt | 2,275 | 2,575 | 2,402 | 2,131 | 2,034 | 1,838 | 1,549 | 1,134 | 2,625 |
| Net Debt | 88 | 344 | 1,235 | 436 | 715 | -1,157 | -1,291 | -407 | -1,160 |
| Total liabilities | 3,755 | 4,254 | 3,895 | 3,789 | 3,523 | 5,598 | 4,531 | 3,629 | 4,394 |
| Total Shareholders’ Equity | 1,444 | 831 | 714 | 857 | 1,052 | 1,411 | 2,048 | 2,186 | 1,926 |
| (Profitability %) | |||||||||
| ROA | -25.82 | -31.67 | -29.48 | -22.54 | -17.65 | -0.35 | 5.59 | 5.38 | 0.44 |
| ROE | -77.27 | -137.73 | -152.15 | -91.46 | -69.11 | -1.89 | 22.64 | 18.48 | 1.60 |
| (Per-share) Unit: JPY | |||||||||
| EPS | 0.9 | -17.5 | -4.5 | -1.6 | 1.3 | 3.8 | 3.3 | -1.9 | -4.1 |
| BPS | 37.6 | 21.4 | 18.1 | 21.1 | 25.9 | 32.2 | 43.0 | 44.1 | 38.8 |
| Dividend per Share | 0.00 | 0.00 | 0.00 | 0.00 | 0.00 | 0.00 | 0.00 | 0.00 | 0.00 |
| Shares Outstanding (million shares) | 37.31 | 38.43 | 39.41 | 40.66 | 40.66 | 43.88 | 47.63 | 49.56 | 49.58 |
Source: Omega Investment from company data, rounded to the nearest whole number
Financial data (full-year basis)
| Unit: million yen | 2016/3 | 2017/3 | 2018/3 | 2019/3 | 2020/3 | 2021/3 | 2022/3 | 2023/3 | 2024/3 | 2025/3 |
| (Income Statement) | ||||||||||
| Sales | 1,161 | 1,089 | 1,060 | 1,022 | 1,078 | 997 | 1,569 | 2,776 | 2,431 | 5,082 |
| Year-on-year | 1817.7% | -6.2% | -2.7% | -3.6% | 5.5% | -7.5% | 57.5% | 76.9% | -12.4% | 109.0% |
| Cost of Goods Sold | 501 | 398 | 423 | 413 | 653 | 120 | 553 | 1,251 | 1,393 | 3,443 |
| Gross Income | 660 | 692 | 637 | 609 | 425 | 877 | 1,017 | 1,525 | 1,038 | 1,639 |
| Gross Income Margin | 56.9% | 63.5% | 60.1% | 59.6% | 39.4% | 88.0% | 64.8% | 54.9% | 42.7% | 32.3% |
| SG&A Expense | 1,480 | 1,876 | 1,551 | 1,414 | 1,586 | 1,847 | 1,992 | 2,076 | 2,374 | 1,611 |
| EBIT (Operating Income) | -820 | -1,184 | -913 | -806 | -1,161 | -970 | -976 | -551 | -1,336 | 28 |
| Year-on-year | 129.1% | 44.4% | -22.9% | -11.8% | 44.2% | -16.5% | 0.6% | -43.5% | 142.4% | -102.1% |
| Operating Income Margin | -70.7% | -108.7% | -86.2% | -78.8% | -107.8% | -97.3% | -62.2% | -19.8% | -54.9% | 0.5% |
| EBITDA | -820 | -1,184 | -913 | -805 | -1,161 | -969 | -973 | -550 | -1,335 | 29 |
| Pretax Income | -786 | -1,222 | -903 | -854 | -7,314 | -1,000 | -550 | -656 | -1,421 | 73 |
| Consolidated Net Income | -788 | -1,225 | -905 | -856 | -7,316 | -1,001 | -551 | -657 | -1,422 | -21 |
| Minority Interest | 0 | 0 | 0 | 0 | 0 | 0 | 0 | 0 | 0 | 0 |
| Net Income ATOP | -788 | -1,225 | -905 | -856 | -7,316 | -1,001 | -551 | -657 | -1,422 | -21 |
| Year-on-year | 108.9% | 55.5% | -26.1% | -5.3% | 754.4% | -86.3% | -45.0% | 19.3% | 116.3% | -98.5% |
| Net Income Margin | -67.9% | -112.4% | -85.4% | -83.8% | -678.9% | -100.5% | -35.1% | -23.7% | -58.5% | -0.4% |
| (Balance Sheet) | ||||||||||
| Cash & Deposits | 817 | 2,380 | 1,891 | 2,009 | 2,033 | 1,461 | 1,161 | 1,067 | 2,231 | 2,995 |
| Total assets | 1,694 | 3,706 | 3,025 | 3,151 | 3,592 | 3,934 | 3,470 | 3,895 | 5,086 | 7,008 |
| Total Debt | 810 | 0 | 0 | 0 | 1,225 | 1,100 | 700 | 1,950 | 2,575 | 1,838 |
| Net Debt | -7 | -2,380 | -1,891 | -2,009 | -808 | -361 | -461 | 883 | 344 | -1,157 |
| Total liabilities | 1,291 | 206 | 421 | 420 | 2,105 | 2,324 | 1,767 | 2,661 | 4,254 | 5,598 |
| Total Shareholders’ Equity | 403 | 3,500 | 2,604 | 2,731 | 1,487 | 1,610 | 1,703 | 1,234 | 831 | 1,411 |
| (Cash Flow) | ||||||||||
| Net Operating Cash Flow | -607 | -1,759 | -438 | -860 | -1,325 | -1,267 | -1,170 | -1,421 | -454 | 937 |
| Capital Expenditure | 2 | 0 | 0 | 0 | 2 | 3 | 0 | 0 | 0 | 6 |
| Net Investing Cash Flow | -122 | -150 | -50 | -0 | -137 | -22 | 527 | -29 | 0 | 65 |
| Net Financing Cash Flow | 947 | 3,472 | 0 | 978 | 1,222 | 718 | 369 | 1,356 | 1,618 | -240 |
| (Profitability ) | ||||||||||
| ROA (%) | -60.21 | -45.35 | -26.88 | -27.73 | -216.99 | -26.61 | -14.88 | -17.85 | -31.67 | -0.35 |
| ROE (%) | -122.00 | -62.74 | -29.64 | -32.10 | -346.86 | -64.66 | -33.25 | -44.78 | -137.73 | -1.89 |
| Net Margin (%) | -67.85 | -112.41 | -85.36 | -83.81 | -678.87 | -100.49 | -35.10 | -23.68 | -58.49 | -0.42 |
| Asset Turn | 0.89 | 0.40 | 0.31 | 0.33 | 0.32 | 0.26 | 0.42 | 0.75 | 0.54 | 0.84 |
| Assets/Equity | 2.03 | 1.38 | 1.10 | 1.16 | 1.60 | 2.43 | 2.23 | 2.51 | 4.35 | 5.39 |
| (Per-share) Unit: JPY | ||||||||||
| EPS | -75.7 | -68.5 | -47.3 | -43.8 | -264.7 | -34.8 | -17.9 | -20.8 | -40.2 | -0.5 |
| BPS | 34.9 | 182.9 | 136.1 | 134.3 | 53.8 | 54.4 | 54.2 | 38.5 | 21.4 | 32.2 |
| Dividend per Share | 0.00 | 0.00 | 0.00 | 0.00 | 0.00 | 0.00 | 0.00 | 0.00 | 0.00 | 0.00 |
| Shares Outstanding (million shares) | 10.85 | 18.74 | 19.14 | 19.68 | 27.65 | 29.06 | 31.44 | 31.90 | 37.31 | 40.66 |
Source: Omega Investment from company data, rounded to the nearest whole number