2026-03-30
Home
Japanese

Omega Investment Co., Ltd.
f-code (Investment report – 4Q update)
| Share price (3/9) | ¥1,512 | Dividend Yield (26/12 CE) | 0.0 % |
| 52weeks high/low | ¥1,136/2,985 | ROE(25/12) | 20.3 % |
| Avg Vol (3 month) | 207.2 thou shrs | Operating margin (TTM) | 19.6 % |
| Market Cap | ¥18.76 bn | Beta (5Y Monthly) | 1.56 |
| Enterprise Value | ¥23.33 bn | Shares Outstanding | 12.409 mn shrs |
| PER (26/12 CE) | 9.7 X | Listed market | TSE Growth |
| PBR (25/12 act) | 2.5 X |
| Click here for the PDF version of this page |
| PDF version |
Growth continues, yet the PER remains low. While the sustainability of growth should be assessed carefully, we would like to take an active stance on it.
◇ Investment conclusion: While there are liquidity constraints, we would like to build a position in phases of share price declines actively.
f-Code Inc. (the Company) has a low PER despite high growth. While recognising the liquidity constraint implied by a market capitalisation of 18.6 billion yen, we would like to proceed with acquisitions in a planned manner. The Company’s investment appeal lies in its high capital efficiency, with ROE of 20.3% and ROIC of 9.8%, and in the fact that it encompasses the AI and education domains and can add to its portfolio businesses that provide AI implementation support and human resource development simultaneously. The consolidation of AI ONE as a subsidiary is a move that strengthens vertical expansion in the education domain and reinforces the investment appeal from a multi-layered growth-driver perspective.
In addition to the sustainability of strong performance, if we can confirm the absence of dilution concerns from equity financing as disclosed in the Company’s earnings materials, the growth rate and financial model assumed by the Company, the progress of growth and support structures at existing subsidiaries, and the progress in the retreat of uncertainties regarding finance and intangible assets for the target markets the Company aims at in future M&A, we would like to increase our ownership ratio. The combination of a forward PER of 9.9x, a trailing PBR of 2.4x, and a forward ROE of 19.3% can be interpreted as a level that prices in long-term EPS growth of roughly 7–8% per annum. Compared with EPS growth over the past several years and the magnitude of the increase implied by the Company’s plan for the current fiscal year, the market’s view is quite cautious, and periods when multiples fall sharply due to share price declines could present acquisition opportunities. In our fair value estimates, the median DCF value is 2,669 yen, implying upside of approximately +77%. By contrast, the median upside based on PER and PBR estimates remains broadly at +8–15%.
There are three points to consider when investing. First, the Company’s growth is relatively reproducible. Through M&A, it has brought a variety of services under its umbrella, and business diversification has progressed, with the SaaS-related profit ratio declining to below 10%. In addition, by bundling DX and AI support with education (school) and expanding cross-selling and room for higher unit prices through service collaboration, it has broadened the upside. Second, shareholder returns (share price appreciation and dividends) depend not only on the continuation of growth but also on whether it can enhance the explanation of net debt management and intangible assets and realise an uplift in valuation multiples (PER and PBR). If it continues to roll up M&A under IFRS, fair value measurement (remeasurement) of contingent consideration and impairment assessments of goodwill can cause period profit and loss to fluctuate. Therefore, more concrete explanations that account for swings driven by accounting factors and the accumulation of financial discipline can help stabilise share price valuations and raise valuation multiples. Specifically, the fact that it clarifies its approach to accounting treatment related to contingent consideration and goodwill, presents a growth model that does not depend on equity financing and a financial management policy centred on borrowings, and organises and presents the growth progress and support structures of existing subsidiaries as well as the target markets for future M&A can be evaluated as proactive disclosure aimed at reducing uncertainty. Third, in light of liquidity constraints, acquisitions should be executed in tranches to limit price impact.
The guideposts for investment triggers are as follows. Acquisitions will be stepped up in phases where a discount to growth expectations widens due to share price declines. As a guide, we assume levels at which the forward PER clearly falls below 10x. If we confirm that disclosure regarding finance and intangible assets continues to accumulate and market concerns have retreated further, we will increase our ownership ratio from that phase.
The Company is transitioning from a rapid growth phase to an expansion phase. It is at a stage where the market simultaneously demands continued growth and the maturation of financial discipline and disclosure. Therefore, for an investment in the Company’s shares, it is reasonable to design an approach in which a position is built in a planned manner in phases where the share price valuation is low, while evaluating that enhanced disclosure is progressing in reducing uncertainty, and then increasing the ownership ratio on the premise of continuous confirmation.
◇ FY12/2025 financial highlights: Exceeded the post-upward-revision plan; a phase to organise both M&A-driven growth and IFRS one-off factors
In FY12/2025, the sharp increase in revenue and the growth in operating profit were clear, and results came in above the Company plan that had been revised upward in the previous quarter; however, large other income and expenses under IFRS were also recorded, and it is important to separate underlying earnings power from one-off factors. Revenue was 11.93 billion yen (approximately 2.3x YoY), and operating profit was 2.34 billion yen (approximately 1.8x YoY), with the main drivers of growth being the overlap of M&A contributions and growth in existing businesses.
By business, revenue was 7.10 billion yen in the Marketing domain (59.5% of the total) and 4.83 billion yen in the AI and Technology domain (40.5%), confirming a structure in which the two domains share the expansion. In terms of profitability, segment profit by domain is disclosed as 1.99 billion yen for Marketing, 1.01 billion yen for AI and Technology, and common costs of -0.65 billion yen. Profit creation through post-M&A PMI (Post Merger Integration) is underpinning the overall results.
The Company executed a total of six M&A transactions in FY12/2025, with a total investment of 3.8 billion yen, and explains that the build-up in operating profit is 0.67 billion yen on a full-year basis. The fact that it shows a track record of profit creation against investment can be viewed positively. However, given the rapid pace of expansion, this is a phase in which how finance and intangible assets are perceived can more readily influence equity market valuation.
In fact, under IFRS, fair value remeasurement of contingent consideration is reflected in other gains and losses, and in FY12/2025, the Company recorded other income of 2.93 billion yen due to fair value changes (decreases). In contrast, other expenses totaling 2.34 billion yen also resulted from goodwill impairments at certain subsidiaries, among other factors. While the structure in which accounting revaluations cause profit and loss to swing remains, the Company has organised and disclosed its thinking on contingent consideration and goodwill, its financial model, the growth progress and support structures of existing subsidiaries, and the target markets for future M&A, clearly indicating a stance of balancing profit creation with financial management rather than mere expansion in scale.
Investors need to confirm, in addition to the build-up in operating profit, the contents of other gains and losses and the status of execution of financial discipline; however, this is a phase in which uncertainty regarding intangible assets and leverage can gradually be reduced as disclosure becomes more concrete.
The fact that results ultimately came in above the earnings plan, revised upward in the previous quarter, can be viewed as indicating a high degree of earnings certainty and execution capability. On the other hand, gains and losses under IFRS are substantial, and goodwill impairments and contingent consideration valuations can swing profits. Continued growth in operating profit and the ability to explain intangible assets and leverage are key to the share price.
◇ Segment analysis: Growth is driven by the two pillars of Marketing, AI, and Technology
The Company’s segments consist of two pillars: the Marketing domain and the AI and Technology domain. The former is responsible for stable earnings generation, while the latter, supported by M&A and demand for education and AI, drives growth and accelerates profit. In FY12/2025, of revenue of 11.94 billion yen, the Marketing domain accounted for 7.10 billion yen (59.5% of the total), and the AI and Technology domain accounted for 4.83 billion yen (40.5%), with AI and Technology rising significantly YoY.
An overview and the earnings model for each domain are as follows.
• Marketing domain: Supports maximising results at customers’ digital touchpoints through data analytics, marketing and sales support, and related services. It addresses customer issues through proposals that combine diverse service lines, and cross-selling through in-group service collaboration for existing customers is, in fact, increasing. Domain profit in FY12/2025 (segment profit calculated by deducting the domain’s cost and SG&A from revenue) was 1.99 billion yen, functioning as an earnings base.
• AI and Technology domain: A growth domain that includes support for the use of generative AI, business transformation using AI/technology, application development, and DX and AI education. While incorporating the functions and know-how in education and human resource development acquired through M&A, it is expanding its offerings by promoting deployment into DX support and AI implementation support for corporate customers. Revenue in FY12/2025 increased sharply YoY to 4.83 billion yen, and domain profit was 1.01 billion yen, confirming growth on the profit side as well.
In addition, in the outlook for FY12/2026, it has reorganised and disclosed the former Marketing domain as the Marketing and School domain in line with business realities, clearly indicating a stance of positioning education (school) at the forefront as a revenue driver. In the FY12/2026 forecast, the Marketing and School domain is set at revenue of 7.82 billion yen, and the AI and Technology domain at 6.68 billion yen. While it expects AI and Technology to be the growth engine, it also assumes a steady build-up on the Marketing side.
◇ Earnings forecast: Plans for high growth on an existing-business basis, and maintains a profit growth trend even without assuming upside from additional M&A
In FY12/2026, the Company plans operating profit growth of +40.8% even on an existing-business basis, and expects to maintain a strong profit growth trend even excluding the prior year’s M&A effects. The plan aims to achieve both revenue expansion and improved profit margins, and will be a year to demonstrate to the market the certainty of continued growth.
In the FY12/2026 forecast, it expects revenue of 14.5 billion yen and segment profit of 4.05 billion yen. This is a plan for higher revenue and profit than FY12/2025 results (revenue of 11.94 billion yen and segment profit of 3.00 billion yen). Of particular note is that, while incorporating the full-year contribution of the M&A executed in the prior year, it shows profit growth on a base that does not assume new large-scale M&A. In other words, organic growth in existing businesses and improvements in earnings power through PMI are positioned at the centre of profit expansion.
By domain, it plans revenue of 7.82 billion yen for the Marketing and School domain and 6.68 billion yen for the AI and Technology domain. The growth rate on the AI and Technology side is higher, and the mix is expected to rise amid expanding demand for support for the use of generative AI and AI talent development. The Marketing side also assumes a steady build-up through deepening existing customers and promoting cross-selling. AI-related businesses are the growth driver, while the structure in which the Marketing side underpins earnings stability is maintained.
There are three risk factors. First is the continuation of the net debt level. An increase in borrowings accompanying aggressive M&A could become a downside factor if the interest rate environment changes or performance fluctuates. Second is an increase in the goodwill balance, and impairment risk could become apparent if performance falls short of assumptions. Third is intensifying competition in the AI education and AI support markets. As the number of entrants increases, maintaining unit prices and differentiation will be key.
However, the Company has a track record of building profits through post-M&A PMI to date, and operating margin is also trending upward. High capital efficiency, with ROE above 20%, could support a review of PER and PBR, provided profit growth continues. The key point for FY12/2026 is whether profit growth and financial stability can be achieved simultaneously.
The fact that it plans to increase its operating profit by roughly 40% YoY is notable, as it indicates the strength of profit growth. What should be monitored is whether net debt and intangible asset risks remain stable as growth continues. If profit growth continues on an existing-business basis, the foundation for a re-evaluation of valuation will be in place.
◇ Share price trends and points to watch: Adjusting from the November high range; catalysts emerge, but financial comfort drives the share price valuation
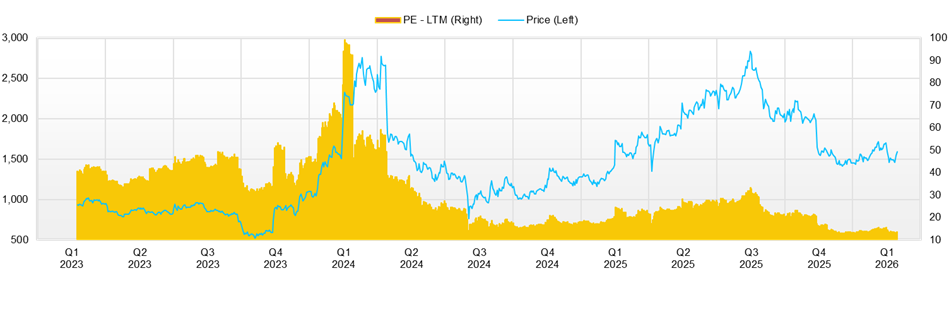
Over the past three months, the share price has not sustained gains even when it rises on catalysts, and this is a phase in which it is prone to decline on earnings or accounting factors; to push up valuation, in addition to the continuation of growth, financial comfort (net debt management and the ability to explain intangible assets) is required. Current market capitalisation is 18.6 billion yen, with a forward PER of 9.9x and a trailing PBR of 2.4x, indicating low multiples for a growth stock.
If this multiple level is reverse-calculated on the assumptions of forecast EPS of 155.6 yen and forecast ROE of 19.3%, it implies an embedded long-term EPS growth rate of roughly 7–8% per annum. Compared with the high growth rates over the past several years, the market is pricing in a meaningful degree of growth deceleration (normalisation) and finance and intangible asset risks accompanying M&A, and upside lies not only in continuation of growth but also in an uplift in valuation multiples through improved explanatory power.
Looking at the share price from November 2025 to February 2026, it was around 2,000 yen in early November at 2,006 yen (closing price on 4 November). Subsequently, it fell, dropping to 1,425 yen (closing price on 16 December) in mid-December. It then turned to a recovery trend from late January, rebounding to 1,718 yen (closing price on 3 February) in early February; however, it weakened again in mid-February and has most recently fallen to 1,461 yen (closing price on 17 February). In other words, after declining from around 2,000 yen to the 1,400 yen range, the share price recovered to the 1,700 yen range and was then pushed back again to the 1,400 yen range, with large swings within the range.
Regarding the share price reaction to announcements, a tendency can be observed in which short-term reactions occur but do not readily lead to sustained buying. Specifically, (1) on the day the KaiU Leader award (ITreview Grid Award 2026 Winter) was announced (21 January), it remained only slightly higher at 1,492 yen (+0.7% day-on-day). (2) Following En place becoming a subsidiary of a subsidiary (27 January), it rose to 1,617 yen (+2.7% day-on-day). (3) The consolidation of AI ONE as a subsidiary (10 February) also showed a buying reaction with a closing price of 1,684 yen (+3.3% day-on-day). Still, supply and demand, and caution tend to prevail over the quality of the catalyst. (4) Thereafter, at the time it announced the recording of other income and expenses on 13 February, it fell sharply to 1,590 yen (-6.3% day-on-day) and continued to fall on the next business day to 1,520 yen (-4.4%). This suggests that uncertainty, such as goodwill impairments and contingent consideration valuations, tends to weigh on the share price more readily than profit growth.
From a technical perspective, the near-term trend is downward, with the lower 1,400 yen range serving as the near-term downside guide (the December low of 1,425 yen and the February low zone), while the 1,700 yen range caps the upside as a wall on rebounds (around 1,718 yen on 3 February). Given the sell-off with increased trading volume (13–17 February), even if there is a short-term rebound, it is a structure in which selling on rallies is likely to emerge.
Three conditions can be considered for increasing the ownership ratio. First, in addition to continued growth in operating profit, control of net debt can be confirmed numerically. Second, disclosure regarding goodwill impairments and contingent consideration continues, and market uncertainty declines. Third, the AI and education domains are represented not only as revenue expansion but also as profit contribution. If these are in place, the low PER will be more likely to be viewed as undervaluation rather than merely a low rating, and there will be room for PER and PBR to rise.
It is more reasonable to build first in phases when valuation distortions widen due to declines, rather than chasing rises, and then to raise the ratio based on confirmatory information. Specifically, we would first build a position in phases where the share price declines and the forward PER falls to the single digits to around 10x, and then, once factors are in place such as (1) continued operating profit growth, (2) numerically confirmable control of net debt, and (3) progress regarding intangible assets (goodwill, contingent consideration, and so forth) while confirming that market concerns are receding, we would increase the ownership ratio in stages. At present, explanations regarding finance and intangible assets have become more concrete than before, and efforts to ease concerns can be considered to be progressing. However, for the equity market to assign higher valuation multiples, continuous disclosure and actual performance accumulation are required. Follow-on buying in phases where the share price surges on announcements tends to worsen acquisition prices under liquidity constraints and should generally be avoided.
Company profile
◇ A marketing tech company expanding through roll-ups centered on DX, AI, and education
f-Code Inc. is a high-growth company that has expanded its business domains through roll-up M&A and has built a platform integrating marketing support, AI utilisation support, and DX talent education. Centered on the Marketing domain, which accounts for the largest share of revenue, it develops within the group, offering services ranging from web production and application development to digital marketing support and DX and AI talent development schools, and is characterised by providing an end-to-end offering from planning through implementation, operations, and talent development. In recent years it has accelerated roll-ups, and in January 2026, through its consolidated subsidiary Real us, it made En place Co., Ltd., which provides MEO for physical stores and SNS support, a subsidiary of a subsidiary. Furthermore, in February 2026, it consolidated AI ONE Inc., which operates an AI school, as a subsidiary, strengthening AI education and AI implementation support for corporate customers. In addition, it has executed the acquisition of the sales support and generative AI utilisation support business by JITT. On the product side, the Company’s tool KaiU won the Leader award in the Web customer service tool category of ITreview’s ITreview Grid Award 2026 Winter, achieving recognition for six consecutive terms.
Another feature of the Company is that it adopts IFRS standards and provides transparent disclosure through fair value measurement of contingent consideration and goodwill impairment testing. It can be positioned as a company that is transitioning from a rapid growth phase to an expansion phase, leveraging a composite model that fuses marketing, AI, and education.
Key financial data
| Unit: million yen | 2021 | 2022 | 2023 | 2024 | 2025 | 2026 CE |
| Sales | 661 | 1,072 | 2,482 | 5,131 | 11,938 | 14,500 |
| EBIT (Operating Income) | 160 | 138 | 638 | 1,149 | 1,902 | |
| Pretax Income | 150 | 124 | 605 | 1,323 | 2,115 | 3,000 |
| Net Profit Attributable to Owner of Parent | 152 | 69 | 480 | 906 | 1,452 | 1,900 |
| Cash & Short-Term Investments | 602 | 978 | 4,040 | 6,236 | 8,086 | |
| Total assets | 843 | 3,281 | 10,975 | 21,825 | 26,741 | |
| Total Debt | 178 | 1,961 | 5,721 | 7,527 | 13,041 | |
| Net Debt | -424 | 983 | 1,681 | 1,291 | 4,955 | |
| Total liabilities | 351 | 2,592 | 7,655 | 15,720 | 19,975 | |
| Total Shareholders’ Equity | 492 | 690 | 3,187 | 6,728 | 7,545 | |
| Net Operating Cash Flow | 103 | 121 | 878 | 916 | 1,347 | |
| Capital Expenditure | 24 | 35 | 46 | 99 | 255 | |
| Net Investing Cash Flow | -16 | -1,441 | -3,404 | -2,881 | -4,460 | |
| Net Financing Cash Flow | 189 | 1,695 | 5,586 | 4,158 | 4,932 | |
| Free Cash Flow | 100 | 97 | 860 | 911 | 1,334 | |
| ROA (%) | 22.37 | 3.36 | 6.73 | 5.52 | 5.98 | |
| ROE (%) | 55.52 | 11.74 | 24.75 | 18.27 | 20.34 | |
| EPS (Yen) | 18.6 | 8.4 | 23.2 | 77.9 | 118.6 | 155.6 |
| BPS (Yen) | 60.0 | 83.2 | 302.2 | 548.8 | 618.0 | |
| Dividend per Share (Yen) | 0.00 | 0.00 | 0.00 | 0.00 | 0.00 | 0.00 |
| Shares Outstanding (Million shares) | 8.20 | 8.29 | 10.55 | 12.17 | 12.41 |
Source: Calculated by Omega Investment based on FactSet’s standard criteria, rounded to the nearest whole number.
Share price
Key stock price data
Financial data (quarterly basis)
| Unit: million yen | 2023/12 | 2024/12 | 2025/12 | ||||||
| 4Q | 1Q | 2Q | 3Q | 4Q | 1Q | 2Q | 3Q | 4Q | |
| (Income Statement) | |||||||||
| Sales | 902 | 1,035 | 1,002 | 1,040 | 2,053 | 2,417 | 2,796 | 3,190 | 3,535 |
| Year-on-year | 234.1% | 168.7% | 109.3% | 45.2% | 127.7% | 133.4% | 178.9% | 206.7% | 72.2% |
| Cost of Goods Sold (COGS) | 423 | 401 | 482 | 475 | 1,050 | 808 | 1,261 | 1,319 | 1,513 |
| Gross Income | 479 | 635 | 520 | 565 | 1,003 | 1,608 | 1,535 | 1,871 | 2,022 |
| Gross Income Margin | 53.1% | 61.3% | 51.9% | 54.3% | 48.9% | 66.6% | 54.9% | 58.7% | 57.2% |
| SG&A Expense | 250 | 320 | 310 | 278 | 737 | 1,185 | 1,093 | 1,318 | 1,539 |
| EBIT (Operating Income) | 229 | 315 | 210 | 287 | 266 | 423 | 442 | 553 | 483 |
| Year-on-year | 1675.9% | 181.1% | 91.6% | 53.3% | 16.1% | 34.5% | 110.3% | 92.6% | 81.5% |
| Operating Income Margin | 25.4% | 30.4% | 21.0% | 27.6% | 13.0% | 17.5% | 15.8% | 17.3% | 13.7% |
| EBITDA | 252 | 356 | 257 | 333 | 292 | 460 | 484 | 600 | 569 |
| Pretax Income | 215 | 296 | 255 | 319 | 383 | 541 | 553 | 587 | 434 |
| Consolidated Net Income | 197 | 191 | 164 | 206 | 327 | 352 | 357 | 381 | 414 |
| Minority Interest | -0 | 8 | 4 | 2 | 15 | 28 | 36 | -8 | -2 |
| Net Income ATOP | 198 | 183 | 160 | 204 | 313 | 325 | 322 | 389 | 416 |
| Year-on-year | 3095.2% | 144.6% | 153.9% | 41.4% | 58.1% | 77.6% | 100.5% | 91.1% | 33.1% |
| Net Income Margin | 21.9% | 17.7% | 16.0% | 19.6% | 15.2% | 13.4% | 11.5% | 12.2% | 11.8% |
| (Balance Sheet) | |||||||||
| Cash & Short-Term Investments | 4,040 | 4,937 | 7,233 | 7,021 | 6,236 | 4,969 | 7,206 | 7,867 | 8,086 |
| Total assets | 10,975 | 14,588 | 17,973 | 17,629 | 21,825 | 24,553 | 25,838 | 28,652 | 26,741 |
| Total Debt | 5,721 | 8,430 | 8,484 | 7,988 | 7,527 | 9,155 | 11,104 | 13,312 | 13,041 |
| Net Debt | 1,681 | 3,493 | 1,251 | 967 | 1,291 | 4,187 | 3,898 | 5,446 | 4,955 |
| Total liabilities | 7,655 | 10,980 | 12,424 | 11,803 | 15,720 | 18,607 | 19,755 | 22,294 | 19,975 |
| Total Shareholders’ Equity | 3,187 | 3,408 | 5,988 | 6,277 | 6,728 | 6,619 | 6,741 | 7,134 | 7,545 |
| (Profitability %) | |||||||||
| ROA | 6.73 | 5.94 | 5.45 | 5.29 | 5.24 | 5.12 | 5.31 | 5.83 | 5.98 |
| ROE | 24.75 | 19.01 | 15.58 | 16.09 | 17.34 | 19.97 | 18.27 | 20.11 | 20.34 |
| (Per-share) Unit: JPY | |||||||||
| EPS | 9.4 | 17.3 | 13.2 | 16.8 | 25.5 | 26.4 | 26.3 | 31.9 | 34.1 |
| BPS | 302.2 | 282.1 | 494.5 | 518.3 | 548.8 | 536.8 | 552.5 | 584.3 | 618.0 |
| Dividend per Share | 0.00 | 0.00 | 0.00 | 0.00 | 0.00 | 0.00 | 0.00 | 0.00 | 0.00 |
| Shares Outstanding (million shares) | 10.55 | 10.61 | 12.11 | 12.11 | 12.17 | 12.35 | 12.40 | 12.41 | 12.41 |
Source: Calculated by Omega Investment based on FactSet’s standard criteria, rounded to the nearest whole number.
Financial data (full-year basis)
| Unit: million yen | 2021/12 | 2022/12 | 2023/12 | 2024/12 | 2025/12 |
| (Income Statement) | |||||
| Sales | 661 | 1,072 | 2,482 | 5,131 | 11,938 |
| Year-on-year | 24.3% | 62.3% | 131.5% | 106.7% | 132.7% |
| Cost of Goods Sold | 258 | 479 | 1,084 | 2,379 | 4,813 |
| Gross Income | 403 | 593 | 1,398 | 2,752 | 7,125 |
| Gross Income Margin | 61.0% | 55.3% | 56.3% | 53.6% | 59.7% |
| SG&A Expense | 242 | 455 | 759 | 1,603 | 5,223 |
| EBIT (Operating Income) | 160 | 138 | 638 | 1,149 | 1,902 |
| Year-on-year | 407.6% | -13.9% | 362.0% | 80.0% | 65.5% |
| Operating Income Margin | 24.3% | 12.9% | 25.7% | 22.4% | 15.9% |
| EBITDA | 164 | 172 | 711 | 1,238 | 2,113 |
| Pretax Income | 150 | 124 | 605 | 1,323 | 2,115 |
| Consolidated Net Income | 152 | 69 | 479 | 934 | 1,505 |
| Minority Interest | 0 | 0 | 0 | 28 | 54 |
| Net Income ATOP | 152 | 69 | 480 | 906 | 1,452 |
| Year-on-year | 275.3% | -54.5% | 591.7% | 88.8% | 60.3% |
| Net Income Margin | 23.1% | 6.5% | 19.3% | 17.7% | 12.2% |
| (Balance Sheet) | |||||
| Cash & Short-Term Investments | 602 | 978 | 4,040 | 6,236 | 8,086 |
| Total assets | 843 | 3,281 | 10,975 | 21,825 | 26,741 |
| Total Debt | 178 | 1,961 | 5,721 | 7,527 | 13,041 |
| Net Debt | -424 | 983 | 1,681 | 1,291 | 4,955 |
| Total liabilities | 351 | 2,592 | 7,655 | 15,720 | 19,975 |
| Total Shareholders’ Equity | 492 | 690 | 3,187 | 6,728 | 7,545 |
| (Cash Flow) | |||||
| Net Operating Cash Flow | 103 | 121 | 878 | 916 | 1,347 |
| Capital Expenditure | 24 | 35 | 46 | 99 | 255 |
| Net Investing Cash Flow | -16 | -1,441 | -3,404 | -2,881 | -4,460 |
| Net Financing Cash Flow | 189 | 1,695 | 5,586 | 4,158 | 4,932 |
| Free Cash Flow | 100 | 97 | 860 | 911 | 1,334 |
| (Profitability ) | |||||
| ROA (%) | 22.37 | 3.36 | 6.73 | 5.52 | 5.98 |
| ROE (%) | 55.52 | 11.74 | 24.75 | 18.27 | 20.34 |
| Net Margin (%) | 23.06 | 6.47 | 19.33 | 17.65 | 12.16 |
| Asset Turn | 0.97 | 0.52 | 0.35 | 0.31 | 0.49 |
| Assets/Equity | 2.48 | 3.49 | 3.68 | 3.31 | 3.40 |
| (Per-share) Unit: JPY | |||||
| EPS | 18.6 | 8.4 | 23.2 | 77.9 | 118.6 |
| BPS | 60.0 | 83.2 | 302.2 | 548.8 | 618.0 |
| Dividend per Share | 0.00 | 0.00 | 0.00 | 0.00 | 0.00 |
| Shares Outstanding (million shares) | 8.20 | 8.29 | 10.55 | 12.17 | 12.41 |
Source: Calculated by Omega Investment based on FactSet’s standard criteria, rounded to the nearest whole number.