2026-03-12
Home
Japanese

Omega Investment Co., Ltd.
Sansei Landic (Investment report – 4Q update)
| Share price (3/27) | ¥1,412 | Dividend Yield (26/12 CE) | 3.6 % |
| 52weeks high/low | ¥920/1,555 | ROE(25/12 act) | 9.8 % |
| Avg Vol (3 month) | 15.4 thou shrs | Operating margin (25/12 act) | 9.6 % |
| Market Cap | ¥12.12 bn | Beta (5Y Monthly) | 0.26 |
| Enterprise Value | ¥22.23 bn | Shares Outstanding | 8.584 mn shrs |
| PER (26/12 CE) | 8.6 X | Listed market | TSE Standard |
| PBR (25/12 act) | 0.9 X |
| Click here for the PDF version of this page |
| PDF version |
Stable characteristics as a small-cap, low-beta stock. ROE improvement has progressed, and inventory turnover and improvement in operating cash flow are the focus of a reassessment of share-price valuation.
Investment conclusion
For FY12/2025, full-year results showed that, although net sales fell below the previous year, profits reached a record-high level, indicating that the Company’s earnings structure is being strengthened by improvements in profitability rather than by expansion in the scale of sales. We also positively evaluate the fact that the direction of ROE improvement emphasized in the previous report was confirmed in the form of a reported ROE of 9.84%. On the other hand, due to the buildup of real estate for sale and the increase in borrowings, the structure in which market caution regarding operating cash flow and capital efficiency is likely to remain has not changed. These results should be positioned as showing once again that, while improvement in earnings quality was confirmed, a reassessment of share-price valuation still requires confirmation in the actual results of inventory turnover and improvement in operating cash flow.
The grounds supporting the investment conclusion are as follows. First, the Company increased profits even under lower sales, and the recovery in ROE progressed through improved profitability. The Company aims for management that places greater emphasis on profit growth than on the absolute amount of net sales, and in this fiscal year, it raised the profit level in line with that policy. At the time of the previous report, the focus in evaluating management capability was whether ROE could be returned to the 9–12% range, but the latest results indicate that reaching the lower end of that range has come into view. This is a clear step forward in evaluating the Company not merely as a small-cap real estate stock, but as a company with room to improve capital efficiency and strengths in execution capability in rights adjustment.
Second, balance-sheet management has become more aggressive, and while the earnings base for the next fiscal year and beyond is being accumulated, factors that cap the upside of the share-price valuation are also expanding at the same time. The increase in real estate for sale can be interpreted positively as preparation for future sales and profit recognition, but as long as operations with a high reliance on borrowings continue, the market places more emphasis not on the profit level itself, but on how quickly inventory turns over and is recovered as cash. Behind the Company’s PBR remaining below 1.0x, there remains not only insufficient understanding of its growth strategy but also a cautious view of capital efficiency and cash-generation capacity. This point is not easy to resolve all at once merely because profits have improved, and it needs to be assessed over time.
Third, the Company’s shares have relatively subdued price movement characteristics and are easy to position as a medium- to long-term holding for contributing to the stabilization of portfolio risk. While earning power improvement and higher ROE are progressing, profit improvement will not necessarily lead immediately to a full reassessment of share-price valuation, and valuation correction is likely to proceed gradually. While this characteristic is somewhat lacking as an investment target aimed at a sharp rise in the share price in the short term, it is easy to include in an investment strategy that emphasizes price stability. The more the improvement in profits continues, and the improvement in operating cash flow and progress in inventory turnover are confirmed, the more likely the share-price valuation is to move closer to a PBR of 1.0x.
Based on the above, we evaluate the Company’s shares as a medium- to long-term holding position that contributes to stabilization of portfolio risk. In terms of investment action, it is appropriate to build new positions in small lots and continue to hold existing positions. At present, a decision to raise the weighting significantly requires confirmation of improvement in operating cash flow and progress in inventory turnover, but these results, in which improvement in earning power has begun to appear ahead of that, were sufficiently positive as a starting point for the Company’s valuation level to rise over time.
◇ Highlights of FY12/2025 results: profits at a record-high level, even with lower sales; inventory buildup is the source of profits for the next fiscal year
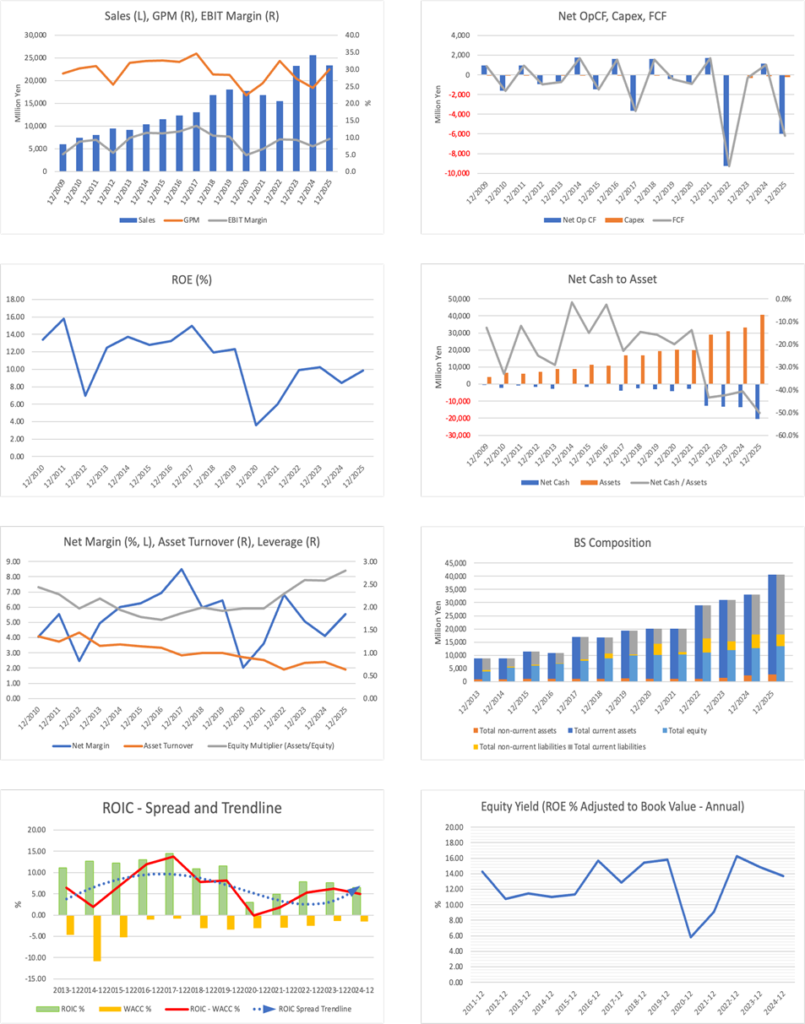
For FY12/2025, net sales decreased, while gross profit and each profit line below it increased, and profits reached a record-high level. Full-year results were net sales of 23.348 billion yen (-8.9% YoY), gross profit of 6.994 billion yen (+11.0% YoY), operating income of 2.247 billion yen (+19.4% YoY), ordinary income of 1.852 billion yen (+16.8% YoY), net income attributable to owners of parent of 1.294 billion yen (+23.2% YoY), and EPS of 158.93 yen (+24.9% YoY). The Company has indicated a policy of placing emphasis on growth in gross profit and each profit line below it, and these full-year results can be evaluated as being in line with that policy.
As a structural factor behind the results, the impact of the business mix caused net sales to decline, while growth in gross profit was the major factor allowing the Company to maintain a profit-growth trend. In addition, the Company revised the full-year earnings forecast announced on August 8, 2025 on February 12, 2026, lowering net sales from 24.000 billion yen to 23.348 billion yen, while raising operating income from 2.020 billion yen to 2.247 billion yen, ordinary income from 1.650 billion yen to 1.852 billion yen, net income attributable to owners of parent from 1.100 billion yen to 1.294 billion yen, and EPS from 135.13 yen to 158.93 yen. In other words, while the scale of sales was revised downward, the profit plan was clearly revised upward, confirming a structure in which profits were accumulated through improved profitability rather than through expansion in sales.
On the financial side, aggressive balance-sheet management became clear. Real estate for sale at year-end built up to 32.346 billion yen (+7.013 billion yen YoY), interest-bearing debt increased to 25.144 billion yen (+6.639 billion yen YoY), and the equity ratio declined to 33.3% (-5.2 percentage points YoY). Operating cash flow was negative 5.968 billion yen, mainly due to the increase in real estate for sale, but on the funding side this was covered by positive financing cash flow of 6.093 billion yen. Although increases in inventory and debt tend to be perceived negatively first by the market, given the Company’s business characteristics, it is also necessary to evaluate them as preparation for future sales and profit recognition.
Overall, FY12/2025 results confirmed that the Company increased profits even under lower sales and that ROE improvement through improved profitability progressed, while at the same time leaving the results of capital efficiency and cash recovery associated with inventory buildup as important matters to be confirmed for the next reassessment of share-price valuation.
◇ Segment analysis: building a high-gross-margin model centered on leasehold land and old unutilized properties
The Company’s earnings structure is concentrated in the real estate rights-adjustment business centered on leasehold land and old unutilized properties. It is a model in which the Company purchases properties with complex rights relationships and earns profits by selling them after adjustment and reorganization, and it is an area where each deal is highly individual. While net sales tend to fluctuate depending on the replacement of deals and the business mix, the Company has adopted a policy of emphasizing growth in gross profit and each profit line below it, and it aims for an operating style that accumulates profits through execution capability in rights adjustment rather than through volume expansion.
Its main businesses are the leasehold land business and the old unutilized properties business. The leasehold land business is a business in which the Company acquires land subject to land lease rights (leasehold land) and sells it to third parties through negotiations with land lease right holders and the reorganization of rights relationships, and the rights-adjustment process itself is the source of earnings opportunities. The old unutilized properties business is a business in which the Company acquires land with buildings and sells it after reorganization of rights relationships and adjustment of conditions. In both businesses, differences in conditions from deal to deal are large, and differences in sales timing and deal composition tend to lead to fluctuations in net sales and profit margins, but for that very reason, they have business characteristics in which differences in practical capabilities, such as property investigation capability, negotiation capability, and legal-response capability are readily reflected in earning power.
At the same time, in addition to leasehold land and old unutilized properties, the Company is also expanding into surrounding areas, such as derivative businesses and the regional revitalization promotion business. In the medium-term management plan, derivative businesses are positioned as growth drivers with a view to scaling after 2028, with the aim of broadening the range of earnings opportunities based on the existing know-how of rights adjustment. As for the regional revitalization promotion business, it is an initiative to monetize regional resources through the regeneration and utilization of idle real estate in cooperation with local governments, and the Company is at the stage of building a track record in multiple areas.
However, at present, what is driving earnings is the existing real estate sales business centered on leasehold land and old unutilized properties. While building up real estate for sale, whether the Company can turn that inventory appropriately and recover it as profit below gross profit will determine performance in the short to medium term. Therefore, while surrounding businesses are to be evaluated as pillars of medium- to long-term growth, there has been no material change in the picture that the existing businesses are the earnings driver for the time being.
◇ FY12/2026 forecast: inventory turnover and improvement in operating cash flow are key. A year to verify the sustainability of profits and the stability of capital management
FY12/2026 will be a phase in which performance will depend on whether the real estate for sale accumulated in FY12/2025 can be sold as planned and converted into profit and operating cash flow. In the Company plan, the consolidated earnings forecast calls for net sales of 25.5 billion yen (+9.2% YoY), operating income of 2.4 billion yen (+6.8% YoY), ordinary income of 1.9 billion yen (+2.2% YoY), net income attributable to owners of parent of 1.330 billion yen (+2.7% YoY), and EPS of 163.53 yen. While the numerical plan itself maintains higher sales and higher profit, evaluation in the current fiscal year is likely to be placed not so much on expansion of the scale of sales itself, but on the speed and profitability with which the accumulated inventory can be recovered.
At the end of FY12/2025, real estate for sale had built up to a record-high 32.346 billion yen, while ROE had improved to 9.8%. This can be evaluated as showing that the Company’s balance-sheet management is progressing not through simple asset expansion, but together with improved profitability. However, increases in inventory and interest-bearing debt tend to be received first by the market as negative factors and can also become factors capping the upside of share-price valuation. Therefore, it is necessary to confirm not only the scale of the increase in inventory, but also its composition.
Looking at the yearly composition of real estate for sale, properties purchased in or after 2023 account for 92.3% by purchase year, consisting of 62.7% purchased in 2025, 21.6% purchased in 2024, and 8.0% purchased in 2023. In other words, the current inventory consists mainly of properties purchased in recent years, and it is reasonable to view the increase in inventory content not as the swelling of stagnant inventory but as the accumulation of purchases premised on future sales. This point serves as grounds for revising the view that uniformly sees the increase in inventory and debt as negative.
However, this assessment does not end with the yearly composition of inventory alone. What the market ultimately wants to confirm is whether the accumulated inventory will actually appear as sales progress, whether inventory turnover will be maintained or improved, and whether that will lead to stable capital management. Therefore, at this point, while the content of the inventory can be evaluated positively, the conclusion is that a rise in share-price valuation requires confirmation of actual recovery and turnover. If improvement in sales progress, inventory turnover, and operating cash flow can be confirmed, the valuation multiple is likely to rise.
On the business-strategy side, existing businesses have remained firm on the purchasing front through the strengthening of sales operations. The Company has indicated a policy of pursuing expansion of purchases not as a mere pursuit of volume, but through reproducible mechanisms such as expansion of purchase channels, sophistication of purchase and sales schemes, commercialization of new rights-adjustment menus, diversification of funding methods, and expansion of purchases in focus areas. In addition, regarding the management of real estate for sale, a linkage to sales plans with a view to profit recovery has also been indicated, and clarification is progressing on a model that converts the balance sheet into profits through a growth cycle that manages purchases and sales in an integrated manner.
Regarding the external environment, since this is a real estate business, trends in interest rates and changes in the financing environment are preconditions. In general, it is necessary to keep in mind that, in a rising-interest-rate environment, higher borrowing costs may put pressure on profit margins. On the other hand, the rights-adjustment area, which is the Company’s earnings base, differs from ordinary development-type real estate in its earnings drivers, and it is a model in which performance is more likely to be determined by negotiation capability and deal turnover than by price fluctuations. This structure can be evaluated as a medium- to long-term differentiating factor. As for derivative businesses, the Company intends to pursue initiatives with emphasis on certainty, with a view to scaling after 2028, and for the time being, they are expected to be positioned as future growth sources while complementing the earnings base of existing businesses.
Risk factors are (i) deterioration in capital efficiency due to inventory stagnation, (ii) unexpected valuation losses, and (iii) changes in the financing environment. If the accumulation of sales progress and improvement in operating cash flow are confirmed, caution regarding the financial side is likely to ease, and PBR is likely to be corrected toward 1.0x. FY12/2026 will be a year in which the issue is not so much whether there is growth, but whether the Company can show the market the quality of that growth, and whether it can simultaneously demonstrate continued profit expansion and stable capital management, will be the principal criterion determining the scope for upgrading the investment conclusion.
◇ Share-price trend and points of focus: the key to lifting PBR is cash-generation capacity. We want to confirm improvement in operating cash flow and inventory turnover
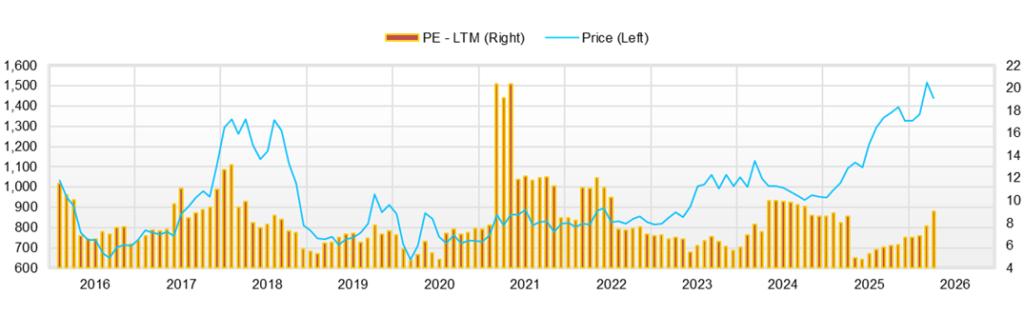
Over the roughly three months from November 4, 2025, to February 20, 2026, the share price rose modestly from 1,331 yen to 1,406 yen on a closing-price basis. During the period, price movement remained within the range from the high of 1,458 yen on November 14 to the low of 1,289 yen on December 4, and the stock did not enter a clear uptrend, continuing instead to move up and down within a certain price range. Valuation metrics were a market capitalization of 11.9 billion yen, a forecast PER of 9.78x, and an actual PBR of 0.83x, leaving a valuation gap with PBR below 1.0x. In addition, the characteristic of low beta indicates a tendency for share-price movement to be relatively limited.
The share-price reaction to catalyst announcements tends to take a form in which, rather than surging sharply, buying emerges on positive news and supports the downside, while profit-taking selling tends to emerge on the upside. Specifically, on February 12, 2026, the Company disclosed a revision to the full-year earnings forecast and a revision to the year-end dividend forecast (dividend increase), and the share price on that day rose to a closing price of 1,375 yen and an intraday high of 1,430 yen. Trading volume also increased to 52,800 shares (10-day average trading volume: 9,800 shares), indicating heightened interest in the news, but the increase in the closing price was limited. While the market had priced in the dividend increase and the upward revision to a certain extent, it is waiting for the next confirmation, such as inventory turnover and improvement in operating cash flow, and there is likely to be a time lag before the share price moves higher. In that disclosure, the year-end dividend was revised from 26 yen per share to 29 yen per share, and the planned annual dividend is 46 yen. Even after the disclosure of FY12/2025 results on February 13, 2026, the closing price remained at only a modestly changed 1,387 yen.
The market’s focus on raising valuation is likely to be placed not on the profit level itself, but on whether those profits are recovered as cash. Operating cash flow for FY12/2025 was negative 5.968 billion yen, mainly due to the increase in inventories. Going forward, the focus will be on whether the growth cycle presented by the Company, which manages purchases through sales in an integrated manner, and the management of real estate for sale with a view to profit recovery, will appear in the financial figures as improvements in sales progress, inventory turnover, and cash recovery. If these improvements are confirmed, market caution is likely to recede, and a reassessment of PBR is likely to progress.
From an investment-operation perspective, we would like to consider raising the holding ratio at a stage when an improvement in operating cash flow can be confirmed. In terms of investment timing, rather than the upward revision or the dividend increase itself, it is more rational to focus on occasions when KPI improvement is specifically shown in earnings announcements or briefings. While the dividend increase and the revision to the earnings outlook are factors supporting the downside, whether the reassessment of share-price valuation will progress depends on whether improvement in inventory turnover and cash recovery is shown in actual results. If sales progress and stable capital management are confirmed, the share price is likely to move into a phase in which it tests a rise in the upper end of its range.
Company profile
◇ A pure-play model in real estate rights adjustment. An independent player targeting high profitability in a niche market
Sansei Landic Co., Ltd. is a real estate company specializing in the real estate rights-adjustment business centered on leasehold land and old unutilized properties, and has secured earnings opportunities in a niche market where competition is limited. The Company operates a flow business nationwide in which it purchases real estate with complex rights relationships and sells it to third parties after adjustment and reorganization. Its mainstay is the acquisition of leasehold land for land subject to land lease rights and old unutilized properties consisting of land with buildings, and one of its characteristics is that it accumulates property investigation capability, negotiation capability, and legal-response capability organizationally rather than relying on individuals. In August 2024, it announced a new medium-term management plan covering through FY2027, setting out reinforcement of existing businesses, cultivation of derivative businesses, improvement of capital efficiency, and reinforcement of shareholder returns. Its ROE target is the 9–12% range, clearly indicating a shift toward management being conscious of capital costs. In addition, it positions the regional revitalization promotion business as a pillar of its social-issue model, and has a policy of balancing the creation of local vibrancy and earnings opportunities through the regeneration of idle real estate and underutilized assets in cooperation with local governments. From 2025 through 2027, it will prioritize building the foundation and is advancing initiatives in Hachimantai City, Iwate Prefecture; Hirado City, Nagasaki Prefecture; and Higashi-Izu Town, Shizuoka Prefecture, among other locations.
Key financial data
| Unit: million yen | 2021/12 | 2022/12 | 2023/12 | 2024/12 | 2025/12 | 2026/12 CE |
| Sales | 16,836 | 15,533 | 23,269 | 25,620 | 23,349 | 25,500 |
| EBIT (Operating Income) | 1,118 | 1,469 | 2,155 | 1,883 | 2,248 | 2,400 |
| Pretax Income | 1,004 | 1,270 | 1,756 | 1,585 | 1,852 | 1,900 |
| Net Profit Attributable to Owner of Parent | 609 | 1,060 | 1,183 | 1,051 | 1,295 | 1,330 |
| Cash & Short-Term Investments | 5,361 | 3,837 | 3,770 | 5,013 | 4,717 | |
| Total assets | 20,051 | 28,977 | 30,976 | 33,107 | 40,679 | |
| Total Debt | 8,108 | 16,399 | 16,879 | 18,506 | 25,145 | |
| Net Debt | 2,747 | 12,562 | 13,109 | 13,493 | 20,428 | |
| Total liabilities | 9,749 | 17,921 | 18,899 | 20,349 | 27,127 | |
| Total Shareholders’ Equity | 10,302 | 11,056 | 12,077 | 12,759 | 13,551 | |
| Net Operating Cash Flow | 1,705 | -9,268 | -12 | 1,143 | -5,969 | |
| Capital Expenditure | 40 | 28 | 304 | 138 | 217 | |
| Net Investing Cash Flow | -51 | -267 | -766 | -715 | -464 | |
| Net Financing Cash Flow | -608 | 7,971 | 303 | 1,223 | 6,094 | |
| Free Cash Flow | 1,682 | -9,282 | -291 | 1,049 | -6,177 | |
| ROA (%) | 3.04 | 4.32 | 3.95 | 3.28 | 3.51 | |
| ROE (%) | 5.98 | 9.93 | 10.23 | 8.46 | 9.84 | |
| EPS (Yen) | 73.6 | 129.6 | 143.8 | 127.2 | 158.9 | 163.5 |
| BPS (Yen) | 1,249.5 | 1,356.8 | 1,465.5 | 1,541.8 | 1,670.0 | |
| Dividend per Share (Yen) | 26.00 | 28.00 | 33.00 | 41.00 | 46.00 | 51.00 |
| Shares Outstanding (Million shares) | 8.47 | 8.49 | 8.58 | 8.58 | 8.58 |
Source: Omega Investment from company data, rounded to the nearest whole number.
Share price
Key stock price data
Financial data (quarterly basis)
| Unit: million yen | 2023/12 | 2024/12 | 2025/12 | ||||||
| 4Q | 1Q | 2Q | 3Q | 4Q | 1Q | 2Q | 3Q | 4Q | |
| (Income Statement) | |||||||||
| Sales | 3,804 | 7,207 | 5,785 | 8,358 | 4,270 | 8,848 | 5,664 | 5,202 | 3,634 |
| Year-on-year | -11.0% | 11.1% | 5.3% | 11.7% | 12.3% | 22.8% | -2.1% | -37.8% | -14.9% |
| Cost of Goods Sold (COGS) | 3,067 | 5,521 | 4,228 | 6,448 | 3,122 | 5,842 | 4,062 | 3,684 | 2,767 |
| Gross Income | 737 | 1,686 | 1,558 | 1,910 | 1,149 | 3,006 | 1,602 | 1,518 | 868 |
| Gross Income Margin | 19.4% | 23.4% | 26.9% | 22.9% | 26.9% | 34.0% | 28.3% | 29.2% | 23.9% |
| SG&A Expense | 914 | 1,115 | 1,102 | 1,125 | 1,077 | 1,200 | 1,168 | 1,108 | 1,271 |
| EBIT (Operating Income) | -177 | 571 | 455 | 785 | 72 | 1,806 | 434 | 410 | -403 |
| Year-on-year | -165.8% | -49.0% | -15.5% | 16.2% | -140.5% | 216.6% | -4.6% | -47.7% | -662.5% |
| Operating Income Margin | -4.7% | 7.9% | 7.9% | 9.4% | 1.7% | 20.4% | 7.7% | 7.9% | -11.1% |
| EBITDA | -161 | 587 | 476 | 806 | 92 | 1,827 | 460 | 442 | -372 |
| Pretax Income | -254 | 493 | 369 | 728 | -4 | 1,728 | 349 | 313 | -538 |
| Consolidated Net Income | -144 | 328 | 245 | 485 | -7 | 1,175 | 236 | 213 | -329 |
| Minority Interest | 0 | 0 | 0 | 0 | 0 | 0 | 0 | 0 | 0 |
| Net Income ATOP | -144 | 328 | 245 | 485 | -7 | 1,175 | 236 | 213 | -329 |
| Year-on-year | -195.1% | -52.0% | -4.0% | 25.2% | -94.9% | 258.2% | -4.0% | -56.1% | 4432.4% |
| Net Income Margin | -3.8% | 4.6% | 4.2% | 5.8% | -0.2% | 13.3% | 4.2% | 4.1% | -9.1% |
| (Balance Sheet) | |||||||||
| Cash & Short-Term Investments | 3,770 | 4,479 | 4,988 | 4,728 | 5,013 | 5,788 | 5,730 | 5,319 | 4,717 |
| Total assets | 30,976 | 30,487 | 30,561 | 29,940 | 33,107 | 31,353 | 32,250 | 35,709 | 40,679 |
| Total Debt | 16,879 | 16,787 | 16,211 | 15,595 | 18,506 | 15,747 | 16,379 | 20,002 | 25,145 |
| Net Debt | 13,109 | 12,308 | 11,223 | 10,867 | 13,493 | 9,959 | 10,649 | 14,683 | 20,428 |
| Total liabilities | 18,899 | 18,354 | 18,163 | 17,173 | 20,349 | 17,712 | 18,471 | 21,832 | 27,127 |
| Total Shareholders’ Equity | 12,077 | 12,133 | 12,398 | 12,768 | 12,759 | 13,641 | 13,779 | 13,877 | 13,551 |
| (Profitability %) | |||||||||
| ROA | 3.95 | 2.75 | 2.66 | 3.02 | 3.28 | 6.14 | 6.01 | 4.93 | 3.51 |
| ROE | 10.23 | 6.98 | 6.74 | 7.32 | 8.46 | 14.73 | 14.43 | 12.13 | 9.84 |
| (Per-share) Unit: JPY | |||||||||
| EPS | -17.4 | 39.8 | 29.7 | 58.6 | -0.9 | 142.4 | 29.1 | 26.2 | -40.1 |
| BPS | 1,465.5 | 1,472.3 | 1,501.2 | 1,542.9 | 1,541.8 | 1,665.9 | 1,701.6 | 1,709.9 | 1,670.0 |
| Dividend per Share | 33.00 | 0.00 | 16.00 | 0.00 | 25.00 | 0.00 | 17.00 | 0.00 | 29.00 |
| Shares Outstanding (million shares) | 8.58 | 8.58 | 8.58 | 8.58 | 8.58 | 8.58 | 8.58 | 8.58 | 8.58 |
Source: Omega Investment from company data, rounded to the nearest whole number.
Financial data (full-year basis)
| Unit: million yen | 2016/12 | 2017/12 | 2018/12 | 2019/12 | 2020/12 | 2021/12 | 2022/12 | 2023/12 | 2024/12 | 2025/12 |
| (Income Statement) | ||||||||||
| Sales | 12,300 | 13,099 | 16,833 | 18,020 | 17,775 | 16,836 | 15,533 | 23,269 | 25,620 | 23,349 |
| Year-on-year | 6.3% | 6.5% | 28.5% | 7.1% | -1.4% | -5.3% | -7.7% | 49.8% | 10.1% | -8.9% |
| Cost of Goods Sold | 8,344 | 8,566 | 12,028 | 12,902 | 13,788 | 12,468 | 10,486 | 16,927 | 19,318 | 16,355 |
| Gross Income | 3,957 | 4,532 | 4,805 | 5,119 | 3,986 | 4,368 | 5,047 | 6,342 | 6,302 | 6,994 |
| Gross Income Margin | 32.2% | 34.6% | 28.5% | 28.4% | 22.4% | 25.9% | 32.5% | 27.3% | 24.6% | 30.0% |
| SG&A Expense | 2,295 | 2,434 | 2,702 | 2,891 | 2,750 | 2,877 | 3,031 | 3,569 | 3,752 | 4,746 |
| EBIT (Operating Income) | 1,446 | 1,762 | 1,766 | 1,861 | 847 | 1,118 | 1,469 | 2,155 | 1,883 | 2,248 |
| Year-on-year | 11.2% | 21.9% | 0.2% | 5.4% | -54.5% | 31.9% | 31.5% | 46.7% | -12.6% | 19.4% |
| Operating Income Margin | 11.8% | 13.5% | 10.5% | 10.3% | 4.8% | 6.6% | 9.5% | 9.3% | 7.3% | 9.6% |
| EBITDA | 1,532 | 1,833 | 1,822 | 1,912 | 896 | 1,161 | 1,517 | 2,236 | 1,962 | 2,357 |
| Pretax Income | 1,329 | 1,672 | 1,539 | 1,759 | 712 | 1,004 | 1,270 | 1,756 | 1,585 | 1,852 |
| Consolidated Net Income | 854 | 1,111 | 1,007 | 1,159 | 358 | 609 | 1,060 | 1,183 | 1,051 | 1,295 |
| Minority Interest | 0 | 0 | 0 | 0 | 0 | 0 | 0 | 0 | 0 | 0 |
| Net Income ATOP | 854 | 1,111 | 1,007 | 1,159 | 358 | 609 | 1,060 | 1,183 | 1,051 | 1,295 |
| Year-on-year | 17.9% | 30.2% | -9.4% | 15.1% | -69.1% | 70.5% | 73.9% | 11.6% | -11.2% | 23.2% |
| Net Income Margin | 6.9% | 8.5% | 6.0% | 6.4% | 2.0% | 3.6% | 6.8% | 5.1% | 4.1% | 5.5% |
| (Balance Sheet) | ||||||||||
| Cash & Short-Term Investments | 2,435 | 3,558 | 3,594 | 4,134 | 4,330 | 5,361 | 3,837 | 3,770 | 5,013 | 4,717 |
| Total assets | 10,833 | 16,916 | 16,777 | 19,294 | 20,071 | 20,051 | 28,977 | 30,976 | 33,107 | 40,679 |
| Total Debt | 2,712 | 7,439 | 6,048 | 7,203 | 8,342 | 8,108 | 16,399 | 16,879 | 18,506 | 25,145 |
| Net Debt | 277 | 3,881 | 2,454 | 3,069 | 4,012 | 2,747 | 12,562 | 13,109 | 13,493 | 20,428 |
| Total liabilities | 3,977 | 8,909 | 7,869 | 9,399 | 10,004 | 9,749 | 17,921 | 18,899 | 20,349 | 27,127 |
| Total Shareholders’ Equity | 6,856 | 8,006 | 8,908 | 9,895 | 10,067 | 10,302 | 11,056 | 12,077 | 12,759 | 13,551 |
| (Cash Flow) | ||||||||||
| Net Operating Cash Flow | 1,611 | -3,666 | 1,617 | -420 | -917 | 1,705 | -9,268 | -12 | 1,143 | -5,969 |
| Capital Expenditure | 111 | 57 | 66 | 61 | 21 | 40 | 28 | 304 | 138 | 217 |
| Net Investing Cash Flow | -184 | 107 | -64 | -71 | -288 | -51 | -267 | -766 | -715 | -464 |
| Net Financing Cash Flow | -1,278 | 4,667 | -1,495 | 984 | 953 | -608 | 7,971 | 303 | 1,223 | 6,094 |
| Free Cash Flow | 1,536 | -3,692 | 1,572 | -446 | -923 | 1,682 | -9,282 | -291 | 1,049 | -6,177 |
| (Profitability ) | ||||||||||
| ROA (%) | 7.68 | 8.01 | 5.98 | 6.42 | 1.82 | 3.04 | 4.32 | 3.95 | 3.28 | 3.51 |
| ROE (%) | 13.24 | 14.96 | 11.90 | 12.32 | 3.58 | 5.98 | 9.93 | 10.23 | 8.46 | 9.84 |
| Net Margin (%) | 6.94 | 8.48 | 5.98 | 6.43 | 2.01 | 3.62 | 6.82 | 5.08 | 4.10 | 5.55 |
| Asset Turn | 1.11 | 0.94 | 1.00 | 1.00 | 0.90 | 0.84 | 0.63 | 0.78 | 0.80 | 0.63 |
| Assets/Equity | 1.72 | 1.87 | 1.99 | 1.92 | 1.97 | 1.97 | 2.30 | 2.59 | 2.58 | 2.80 |
| (Per-share) Unit: JPY | ||||||||||
| EPS | 104.9 | 134.4 | 119.6 | 137.1 | 42.3 | 73.6 | 129.6 | 143.8 | 127.2 | 158.9 |
| BPS | 841.3 | 958.0 | 1,054.5 | 1,170.2 | 1,192.9 | 1,249.5 | 1,356.8 | 1,465.5 | 1,541.8 | 1,670.0 |
| Dividend per Share | 12.00 | 18.00 | 21.00 | 23.00 | 25.00 | 26.00 | 28.00 | 33.00 | 41.00 | 46.00 |
| Shares Outstanding (million shares) | 8.15 | 8.35 | 8.45 | 8.46 | 8.47 | 8.47 | 8.49 | 8.58 | 8.58 | 8.58 |
Source: Omega Investment from company data, rounded to the nearest whole number.