2026-03-30
Home
Japanese

Omega Investment Co., Ltd.
Human Creation Holdings (Investment report – 1Q update)
| Share price (4/1) | ¥1,213 | Dividend Yield (26/9 CE) | 3.6 % |
| 52weeks high/low | ¥943/1,430 | ROE(25/9) | 28.0 % |
| Avg Vol (3 month) | 12.7 thou shrs | Operating margin (25/9) | 8.7 % |
| Market Cap | ¥4.34 bn | Beta (5Y Monthly) | 0.78 |
| Enterprise Value | ¥3.16 bn | Shares Outstanding | 3.573 mn shrs |
| PER (26/9 CE) | 8.6 X | Listed market | TSE Growth |
| PBR (25/9 act) | 2.5 X |
| Click here for the PDF version of this page |
| PDF version |
High capital efficiency is a major attraction. While accumulating shares during the undervalued period, wait for a phase in which developments in earnings and capital measures are reflected in the valuation.
◇ Investment conclusion
Human Creation Holdings, Inc. (hereinafter, the company) appears undervalued given its market capitalization of 4.4 billion yen and a forecast PER of 10.1x, along with indicators such as a trailing PBR of 2.61x, ROA of 10.5%, ROE of 27.6%, and ROIC of 16.5%. On the other hand, with a net debt of 36 million yen, it cannot be said that the company has ample financial capacity, and at this stage, it is likely to be viewed as “it will grow, but is its financial position sound?” It is therefore difficult to expect a sharp re-rating in the short term. Nevertheless, as undervaluation itself supports medium- to long-term upside, we believe a policy of patiently accumulating shares while the valuation remains low is appropriate, on the premise of low liquidity.
Concerns include a cautious view toward expansion involving M&A, vigilance over earnings volatility in the strategic domains business, and the burden of goodwill amortization, anxiety over stock liquidity because it is a small-cap, and a gap between expectations and the level of shareholder returns. These factors continue to create a structure that easily restrains upside buying. Although price movement is relatively calm at a beta of 0.78, there remains a risk that it will take time for the undervaluation to be corrected. Therefore, starting from the current undervalued level, we would like to continue building a position patiently and wait for a phase in which the valuation moves as catalysts materialize (confirmation of upside in earnings, clarification of capital measures, etc.).
As previously noted, the source of the company’s strength lies in its two-layer structure. It secures a stable earnings base in the SES business (engineer staffing) while accumulating high-value-added areas such as IT consulting, contract development, and M&A brokerage. As long as this structure functions, the company’s earning power is not easily impaired, even if it continues to make expansion investments. On the other hand, what the market most wants to see is how the results of expansion generate profit and cash, and how disciplined capital allocation is managed. Previously, we viewed the company’s ability to pursue growth investments and shareholder returns in parallel while maintaining a net cash position positively. At present, however, net debt stands at 36 million yen, which warrants even closer attention.
The company is at a stage of pursuing business expansion, and the conditions for upside in its stock price valuation are the accumulation of disclosures confirming, in profit and cash, the results of M&A and strategic investments, as well as a reduction in concerns over shareholder returns and liquidity.
◇ FY9/2026 1Q results highlights: sales growth maintained; profits in line with plan despite upfront investments. The focus is on whether this can lead to a recovery phase in the second half.
In 1Q FY9/2026, the company secured higher net sales of 2.24 billion yen (+11.6% YoY), but profits declined due to the execution of strategic investments. However, there were no other downside factors for operating profit, and each item came in above the initial 1Q budget.
Profit and loss results were operating profit of 134 million yen (–36.9% YoY), ordinary profit of 124 million yen (–41.5% YoY), and quarterly net income attributable to owners of parent of 52 million yen (–60.2% YoY). The reason profits were weak is clear, and the company states that the main factor was the execution of strategic investments, such as R&D investment and personnel-related investment in line with the initial plan.
EBITDA declined to 190 million yen (–22.4% YoY), and the company explains that, in addition to the reactionary decline following a large-scale project at Asset Consulting Force (ACF) in the same period of the previous year, investments for the future, such as UI/UX improvements associated with progress in the BaaS (HCH platform development) project, contributed to the decline in EBITDA. On the sales side, the strategic domains business was pushed up by the acquisition effect from HC Financial Advisor (HCFA), and the acquisition effect was 195 million yen. However, because there was a recoil from the large-scale project in the same period as the previous year, it is important, in assessing the underlying pace of growth, that net sales of the strategic domains business, excluding the acquisition effect, were limited to +1.6% YoY.
Regarding the decline in net income, the temporary losses recorded by subsidiaries subject to strategic investment made the effective tax rate appear high on a consolidated basis, but the company’s materials state that they are expected to return to profitability for the full year. Progress against the full-year plan in 1Q was 22.4% for net sales and 17.1% for operating profit, and the fact that operating profit progress is below 25% reflects the plan to front-load expense outlays in the first half. The focus for investors is whether, even while bearing the investment burden in the first half, gross margin and EBITDA can recover in the second half, and the company can achieve full-year earnings at around the previous year’s level.
The profit decline can be understood as resulting from investment activity. What will be important going forward is whether net sales in the strategic domains business will re-accelerate in the second half, even excluding the increase from acquisitions, and whether the actual recovery in EBITDA can be confirmed in the numbers.
◇ Segment analysis: a two-layer model supported by SES and expanded by the strategic domains
The company has a single reportable segment, the system solution service business. It discloses trends by classifying the SES business, which forms the earnings base, and the strategic domains business, which drives growth. Investors can more easily organize the business’s strengths and weaknesses by looking at these two layers.
First, the SES business is the group’s earnings base. It participates in corporate system construction projects through major customers such as system integrators and manufacturers, and, with engineers stationed primarily at client sites, provides services ranging from development to maintenance. The contract structure is centered on dispatch contracts, but also combines some contract work. The company says it serves a wide range of industries, including finance, manufacturing/distribution, public/medical, and telecommunications/media. Sales in the SES business are compiled mainly from engineering staffing sales at Brain Knowledge Systems (BKS), and are managed to include sales of CLS, which was absorbed and merged into BKS on October 1, 2024, as well as some intercompany transactions. Most recently, in 1Q of FY9/2026, net sales in this business were 1.372 billion yen (+1.9% YoY). Although the growth rate was limited, it remains an area that underpins group sales.
Next, the strategic domains business is the area the company positions at the center of accelerating growth. It defines this as sales of each subsidiary engaged in consulting and contract development and operations, with BKS’s contract projects added. In 1Q of FY9/2026, net sales were 873 million yen (+31.0% YoY), indicating strong growth and making it a business that can readily lift the group’s overall growth. In terms of composition, against quarterly net sales of 2.24 billion yen, the SES business accounted for about 61%, and the strategic domains business for about 39%. The structure is such that a rise in the latter business’s ratio tends to influence the company-wide growth rate.
In addition, as a measure to enhance execution capability in the strategic domains business, the company resolved to merge three companies: Asset Consulting Force (ACF), Human Base (HMB), and TARA. Behind this is the recognition of the issue that, while promoting sales expansion toward SMBs (small and medium-sized businesses, including mid-sized companies), proposals have remained limited to the products of each company, and collaboration, such as cross-selling through combinations of group products and expansion into development projects, has not been sufficiently demonstrated. The effective date is scheduled for April 1, 2026, and the company states that it aims to improve business efficiency and promote cross-selling in the strategic domains business by integrating the specialized expertise and customer bases of each company. From a segment perspective, an important point for measuring future qualitative growth will be whether or not only sales growth in the strategic domains business, but also post-integration project creation, higher average proposal values, and spillover into development projects can be confirmed on an ongoing basis.
◇ FY9/2026 earnings forecast: full-year plan unchanged, with profit recovery in the second half being the key
The company has left its full-year earnings forecast for FY9/2026 unchanged, planning net sales of 10.0 billion yen, operating profit of 785 million yen, ordinary profit of 779 million yen, net income attributable to owners of parent of 436 million yen, and earnings per share of 141.08 yen. In 1Q, progress in operating profit was relatively low, and there is a visible delay in profit progress. However, the plan is to continue cost outlays for the medium to long term while securing operating profit at around the previous year’s level, and the fact that the full-year forecast was left unchanged can be taken as a message that the company remains on track.
There are two points of interest in reading the full-year outlook. First is the certainty of sales growth. For the full year, the company targets net sales of 10.0 billion yen and EBITDA of 1.022 billion yen, and in the SES business it intends to advance growth while suppressing market fluctuation risk by focusing on hiring personnel with upstream skills, while in the strategic domains business it says it will drive sales growth through clarification of group strategy, stronger collaboration, and acquisition of new customers. Second is how profits will emerge. Regarding SG&A expenses, the company plans a further increase over the previous year due to increases in hiring-related expenses and the like, and the first half tends to carry a higher investment burden. How far EBITDA and operating profit recover in the second half will determine the persuasiveness of the figures for achieving the full year.
A negative factor is unexpected costs. The company explains that various M&A-related expenses are not incorporated into the full-year plan at this time, and if an M&A transaction is completed, there is a possibility that the initial profit plan may be missed due to the recording of related one-time expenses. The more a company promotes M&A as a growth measure, the more carefully the market tends to view this point. In dispelling investor doubts, the focus is on whether the company can clearly show that ① it can absorb the investment burden with the earning power of existing businesses, such as project acquisition and unit-price improvement, and ② if it executes M&A, it will disclose at an early stage the cost outlook and the recovery scenario for profit and cash, etc.
The medium-term story targets EPS of 1,000 yen and ROE of 30% in FY9/2030, and positions the period up to FY9/2027 as a phase of accelerating business transformation. As the plan for FY9/2027, the company sets out net sales of 12.0 billion yen, 5.0 billion yen in the strategic domains business, and 3.0 billion yen in M&A effects, and in the short term, it is in a phase that simultaneously requires a rise in the ratio of the strategic domains business and maintenance of the profit level. Regarding shareholder returns, the company plans a year-end dividend of 44 yen and explains that this is in line with its policy of a total payout ratio exceeding 30%. In a phase of upfront investments, whether it can show profit recovery and continuity of shareholder returns as a set will be a factor in creating market conviction. In addition, given that the company is currently in a net debt position of 36 million yen, confirming a recovery in cash creation becomes even more important.
Leaving the full-year forecast unchanged is consistent with the plan design. The focus narrows to whether the recovery in EBITDA and operating profit in the second half can be confirmed in the numbers, and whether the fact that M&A costs are not incorporated will become an unexpected cost.
◇ Share price trends and future points of attention: the sense of undervaluation is becoming pronounced in the adjustment phase. Recovery in second-half earnings is the turning point for valuation.
Since the start of 2026, the company’s shares have underperformed the TOPIX by about 20%, and the market has become more cautious in response to recent results showing a decline in profits. On the technical side, RSI (14-day) has reached the lower end of the past 12-month range, putting the stock at a level where a technical rebound is also in view in the short term.
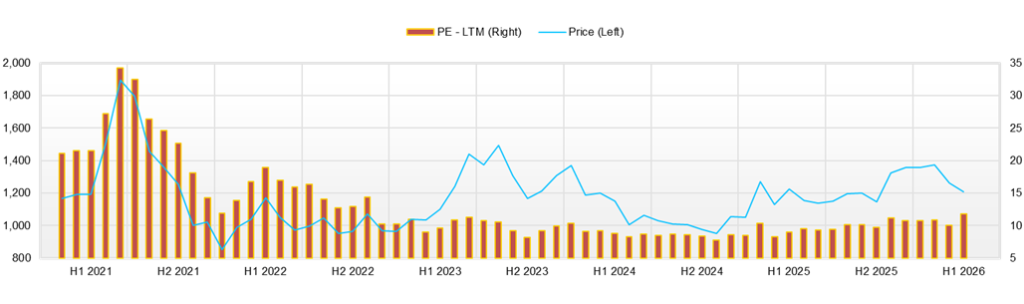
Over the past three months, the share price traded at closing prices of around 1,151–1,170 yen in early November 2025, and then moved up to the upper 1,200-yen range to the lower 1,300-yen range from mid- to late November. After that, in December, it traded mainly in the 1,270–1,320 yen closing price range and recovered to 1,359–1,362 yen by year-end. In January 2026, it maintained a high level at 1,390–1,407 yen, and the year-to-date high was 1,430 yen on January 7. Most recently, it adjusted to a closing price of 1,253 yen on February 12, and in the short term, the stock continues to face resistance on the upside. RSI is positioned near the bottom of its range, and in the short term, it is at a level that is easily viewed as close to oversold. However, to switch to a full-fledged uptrend, it is necessary that the rebound not end as a temporary one and that the share price maintain a recovery trend with increased trading volume.
From a valuation perspective, the combination of a forecast PER of 10.1x, trailing PBR of 2.61x, and ROE of 27.6% still gives a sense of undervaluation in light of capital efficiency. In particular, a level that remains at around 10x PER while maintaining ROIC of 16.5% is considered to reflect not only concerns over the sustainability of growth, but also the financial impression created by net debt of 36 million yen. The market is in a phase where it wants to confirm the quality and sustainability of profits more than growth itself.
Looking at the reaction to catalysts, on the day of the 1Q earnings announcement on February 10, 2026, the closing price rose from the previous day to 1,375 yen, but on the following day, the 12th, it fell to a closing price of 1,253 yen, so rather than the valuation settling in one direction from the earnings announcement, it can be understood that price movement became unstable due to inflows and outflows of short-term funds. The earnings announcement explained sales growth and a profit decline due to upfront investments, but the market could not fully judge whether profits would really recover in the second half, and the stock was initially bought immediately after the announcement, after which selling gained the upper hand, and the share price fell. The resolution to merge the three companies had a limited impact on the share price, and the market showed a stance of waiting for concrete synergy figures. The response to IR announcements continues to be a wait-and-see reaction rather than an exhaustion-of-materials type of reaction.
The following three conditions are necessary for the valuation to improve going forward. First, it is necessary to recoup in the second half the investment burden incurred in the first half, and for EBITDA and operating profit actually to recover. Second, with respect to growth in the strategic domains business, it is important that growth be confirmed not only from the increase brought by M&A, but also from the company’s own strength, such as an increase in orders for existing projects and unit-price improvement. Third, if M&A is executed, by specifically showing at an early stage what costs will arise and what will be used to recover those costs, the company can ease financial concerns against the backdrop of net debt of 36 million yen.
Clear catalysts for a reassessment of the share price valuation would be the emergence of any of the following: (1) a visible recovery in profit in the first-half results, (2) an upward revision to the full-year forecast, or (3) KPI disclosure showing the effects of the merger of the three companies. The share price has lagged year to date, and RSI is in oversold territory, but the sustainability of any rebound depends on confirmation of results. If second-half recovery is shown in the numbers, PER could be re-rated. At the current juncture, there is room for a technical rebound, but a full-fledged rise is awaiting catalysts.
Company profile
Under a pure holding company, functional subsidiaries are grouped together to capture the full value chain from upstream to operations through organizational capability.
Human Creation Holdings, Inc. is a solution integrator that addresses clients’ management issues with IT at its core, and its core feature is that, under a pure holding company, it places operating subsidiaries with different areas of expertise and provides value through the optimal organization according to the characteristics of each project. The business model combines consulting and contract system development with engineer staffing that handles system development and maintenance, covering everything from upstream to implementation and operations. The group consists of Brain Knowledge Systems, Asset Consulting Force, Sailing, Cosmopia, TARA, Human Base, HC Financial Advisor, and others, and operates in six cities nationwide. Most recently, for the purpose of integrated operation of the strategic domains business, it has resolved to merge Human Base and TARA into Asset Consulting Force as the surviving company. The shift to a pure holding company structure is intended to separate group management from the execution of individual businesses, thereby promoting faster decision-making and stronger governance. Capital stock is 193 million yen, and the number of consolidated employees is 914 (excluding temporary employees; as of the end of September 2025).
Key financial data
| Unit: million yen | 2021 | 2022 | 2023 | 2024 | 2025 | 2026 CE |
| Sales | 5,035 | 5,803 | 6,487 | 7,166 | 8,946 | 10,005 |
| EBIT (Operating Income) | 478 | 545 | 698 | 631 | 782 | 785 |
| Pretax Income | 464 | 546 | 701 | 630 | 684 | |
| Net Profit Attributable to Owner of Parent | 276 | 343 | 438 | 404 | 398 | 436 |
| Cash & Short-Term Investments | 846 | 673 | 1,020 | 1,003 | 1,417 | |
| Total assets | 2,192 | 2,536 | 2,963 | 2,978 | 4,496 | |
| Total Debt | 266 | 546 | 641 | 376 | 1,143 | |
| Net Debt | -580 | -127 | -379 | -627 | -274 | |
| Total liabilities | 1,128 | 1,620 | 1,901 | 1,625 | 2,965 | |
| Total Shareholders’ Equity | 1,064 | 916 | 1,062 | 1,353 | 1,530 | |
| Net Operating Cash Flow | 268 | 373 | 723 | 481 | 1,030 | |
| Capital Expenditure | 11 | 3 | 17 | 7 | 64 | |
| Net Investing Cash Flow | -52 | -335 | -169 | -3 | -896 | |
| Net Financing Cash Flow | 44 | -212 | -206 | -496 | 282 | |
| Free Cash Flow | 257 | 370 | 717 | 475 | 1,023 | |
| ROA (%) | 13.63 | 14.51 | 15.95 | 13.60 | 10.66 | |
| ROE (%) | 32.43 | 34.65 | 44.34 | 33.47 | 27.64 | |
| EPS (Yen) | 71.6 | 94.6 | 132.4 | 123.1 | 126.0 | 141.0 |
| BPS (Yen) | 276.2 | 265.6 | 324.1 | 415.9 | 494.8 | |
| Dividend per Share (Yen) | 24.49 | 25.00 | 25.50 | 26.00 | 27.00 | 44.00 |
| Shares Outstanding (Million shares) | 3.85 | 3.85 | 3.85 | 3.57 | 3.57 |
Source: Omega Investment from company data, rounded to the nearest whole number.
Share price
Key stock price data
Financial data (quarterly basis)
| Unit: million yen | 2024/9 | 2025/9 | 2026/9 | ||||||
| 1Q | 2Q | 3Q | 4Q | 1Q | 2Q | 3Q | 4Q | 1Q | |
| (Income Statement) | |||||||||
| Sales | 1,649 | 1,770 | 1,845 | 1,902 | 2,013 | 2,058 | 2,227 | 2,647 | 2,246 |
| Year-on-year | 5.4% | 9.3% | 10.4% | 16.6% | 22.1% | 16.3% | 20.7% | 39.2% | 11.6% |
| Cost of Goods Sold (COGS) | 1,184 | 1,262 | 1,295 | 1,346 | 1,421 | 1,473 | 1,566 | 1,769 | 1,611 |
| Gross Income | 465 | 508 | 550 | 557 | 592 | 585 | 661 | 879 | 635 |
| Gross Income Margin | 28.2% | 28.7% | 29.8% | 29.3% | 29.4% | 28.4% | 29.7% | 33.2% | 28.3% |
| SG&A Expense | 325 | 373 | 369 | 383 | 380 | 419 | 492 | 644 | 501 |
| EBIT (Operating Income) | 140 | 135 | 180 | 173 | 212 | 166 | 169 | 235 | 134 |
| Year-on-year | -3.7% | -27.9% | -4.5% | -1.8% | 51.7% | 22.7% | -6.4% | 35.7% | -36.9% |
| Operating Income Margin | 8.5% | 7.6% | 9.8% | 9.1% | 10.6% | 8.1% | 7.6% | 8.9% | 6.0% |
| EBITDA | 169 | 166 | 212 | 206 | 245 | 199 | 221 | 291 | 190 |
| Pretax Income | 139 | 135 | 182 | 174 | 212 | 87 | 166 | 219 | 124 |
| Consolidated Net Income | 89 | 92 | 110 | 113 | 132 | 42 | 92 | 133 | 53 |
| Minority Interest | 0 | 0 | 0 | 0 | 0 | 0 | 0 | 0 | 0 |
| Net Income ATOP | 89 | 92 | 110 | 113 | 132 | 42 | 92 | 133 | 53 |
| Year-on-year | -10.9% | -23.4% | -12.9% | 22.4% | 48.3% | -54.4% | -16.6% | 17.3% | -60.2% |
| Net Income Margin | 5.4% | 5.2% | 6.0% | 6.0% | 6.6% | 2.0% | 4.1% | 5.0% | 2.3% |
| (Balance Sheet) | |||||||||
| Cash & Short-Term Investments | 952 | 995 | 1,122 | 1,003 | 938 | 1,200 | 1,159 | 1,417 | 957 |
| Total assets | 2,791 | 2,997 | 3,035 | 3,051 | 3,004 | 3,365 | 4,355 | 4,511 | 4,052 |
| Total Debt | 587 | 574 | 425 | 376 | 326 | 702 | 1,322 | 1,143 | 994 |
| Net Debt | -365 | -420 | -697 | -627 | -612 | -499 | 163 | -274 | 36 |
| Total liabilities | 1,695 | 1,788 | 1,764 | 1,698 | 1,602 | 2,013 | 2,948 | 2,980 | 2,547 |
| Total Shareholders’ Equity | 1,096 | 1,209 | 1,271 | 1,353 | 1,402 | 1,352 | 1,408 | 1,530 | 1,505 |
| (Profitability %) | |||||||||
| ROA | 15.54 | 13.80 | 12.70 | 13.44 | 15.43 | 12.48 | 10.25 | 10.54 | 9.04 |
| ROE | 47.24 | 38.60 | 33.76 | 33.47 | 35.79 | 31.01 | 28.28 | 27.64 | 21.94 |
| (Per-share) Unit: JPY | |||||||||
| EPS | 27.2 | 27.9 | 33.4 | 34.7 | 40.6 | 13.2 | 29.6 | 42.9 | 17.0 |
| BPS | 334.4 | 366.4 | 387.1 | 415.9 | 431.0 | 429.8 | 455.1 | 494.8 | 486.7 |
| Dividend per Share | 0.00 | 0.00 | 0.00 | 26.00 | 0.00 | 0.00 | 0.00 | 27.00 | 0.00 |
| Shares Outstanding (million shares) | 3.85 | 3.85 | 3.85 | 3.85 | 3.57 | 3.57 | 3.57 | 3.57 | 3.57 |
Source: Omega Investment
Financial data (full-year basis)
| Unit: million yen | 2021 | 2022 | 2023 | 2024 | 2025 |
| (Income Statement) | |||||
| Sales | 5,035 | 5,803 | 6,487 | 7,166 | 8,946 |
| Year-on-year | 10.3% | 15.3% | 11.8% | 10.5% | 24.8% |
| Cost of Goods Sold | 3,607 | 4,030 | 4,522 | 5,087 | 6,228 |
| Gross Income | 1,428 | 1,773 | 1,965 | 2,079 | 2,717 |
| Gross Income Margin | 28.4% | 30.6% | 30.3% | 29.0% | 30.4% |
| SG&A Expense | 950 | 1,228 | 1,267 | 1,448 | 1,935 |
| EBIT (Operating Income) | 478 | 545 | 698 | 631 | 782 |
| Year-on-year | 57.5% | 14.0% | 28.0% | -9.6% | 23.9% |
| Operating Income Margin | 9.5% | 9.4% | 10.8% | 8.8% | 8.7% |
| EBITDA | 558 | 659 | 813 | 754 | 954 |
| Pretax Income | 464 | 546 | 701 | 630 | 684 |
| Consolidated Net Income | 276 | 343 | 438 | 404 | 398 |
| Minority Interest | 0 | 0 | 0 | 0 | 0 |
| Net Income ATOP | 276 | 343 | 438 | 404 | 398 |
| Year-on-year | 31.2% | 24.3% | 27.8% | -7.8% | -1.4% |
| Net Income Margin | 5.5% | 5.9% | 6.8% | 5.6% | 4.5% |
| (Balance Sheet) | |||||
| Cash & Short-Term Investments | 846 | 673 | 1,020 | 1,003 | 1,417 |
| Total assets | 2,192 | 2,536 | 2,963 | 2,978 | 4,496 |
| Total Debt | 266 | 546 | 641 | 376 | 1,143 |
| Net Debt | -580 | -127 | -379 | -627 | -274 |
| Total liabilities | 1,128 | 1,620 | 1,901 | 1,625 | 2,965 |
| Total Shareholders’ Equity | 1,064 | 916 | 1,062 | 1,353 | 1,530 |
| (Cash Flow) | |||||
| Net Operating Cash Flow | 268 | 373 | 723 | 481 | 1,030 |
| Capital Expenditure | 11 | 3 | 17 | 7 | 64 |
| Net Investing Cash Flow | -52 | -335 | -169 | -3 | -896 |
| Net Financing Cash Flow | 44 | -212 | -206 | -496 | 282 |
| Free Cash Flow | 257 | 370 | 717 | 475 | 1,023 |
| (Profitability ) | |||||
| ROA (%) | 13.63 | 14.51 | 15.95 | 13.60 | 10.66 |
| ROE (%) | 32.43 | 34.65 | 44.34 | 33.47 | 27.64 |
| Net Margin (%) | 5.48 | 5.91 | 6.76 | 5.64 | 4.45 |
| Asset Turn | 2.49 | 2.45 | 2.36 | 2.41 | 2.39 |
| Assets/Equity | 2.38 | 2.39 | 2.78 | 2.46 | 2.59 |
| (Per-share) Unit: JPY | |||||
| EPS | 71.6 | 94.6 | 132.4 | 123.1 | 126.0 |
| BPS | 276.2 | 265.6 | 324.1 | 415.9 | 494.8 |
| Dividend per Share | 24.49 | 25.00 | 25.50 | 26.00 | 27.00 |
| Shares Outstanding (million shares) | 3.85 | 3.85 | 3.85 | 3.57 | 3.57 |
Source: Omega Investment