2026-06-19
Home
Japanese

Omega Investment Co., Ltd.
KYODO PUBLIC RELATIONS (Investment report – Basic)
| Share price (5/1) | ¥754 | Dividend Yield (25/12 CE) | 1.9 % |
| 52weeks high/low | ¥430/940 | ROE(24/12) | 16.5 % |
| Avg Vol (3 month) | 23.9 thou shrs | Operating margin (24/12) | 14.7 % |
| Market Cap | ¥6.64 bn | Beta (5Y Monthly) | -0.27 |
| Enterprise Value | ¥3.84 bn | Shares Outstanding | 8.809 mn shrs |
| PER (25/12 CE) | 9.0 X | Listed market | TSE Standard |
| PBR (24/12 act) | 1.9 X |
| Click here for the PDF version of this page |
| PDF version |
“The Power to Create News Becomes the Power to Generate Earnings”
Toward a High-Profit Structure Aligned with the Mid-Term Plan
Investment View
KYODO PUBLIC RELATIONS CO., LTD. (hereinafter, “Kyodo PR”) is an independent company with a strong reputation and proven track record in the public relations industry. The company is now entering a new growth phase by expanding into influencer marketing and the AI and big data domains. In FY2024, consolidated operating profit exceeded the 1 billion yen mark for the first time, marking a third consecutive year of record-high profits. With an operating margin of 14.7%, Kyodo PR has established a high-profit structure. Improvements in ROIC and a significant increase in free cash flow (FCF) have greatly enhanced its financial stability.
The company’s mid-term plan targets 10 billion yen in revenue and 1.6 billion yen in operating profit (operating margin of 16%) by FY2026, driven by strong growth in AI solutions and influencer businesses. With a solid financial base—an equity ratio of 58.8% and cash and deposits accounting for approximately half of total assets—Kyodo PR has ample capacity for growth investments and shareholder returns.
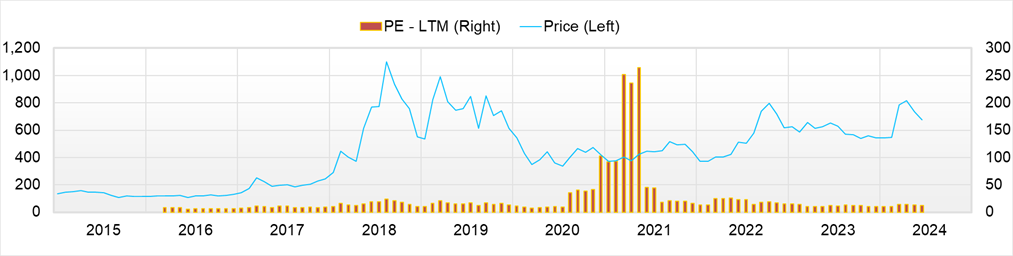
Despite these strengths, the stock’s valuation remains in the low range, with a projected PER around 9x and a PBR of approximately 1.9x. Given its high-quality performance, financial strength, and consistent shareholder returns, Kyodo PR deserves a strong investment rating for its ability to deliver sustainable profit growth and stable cash generation over the medium to long term.
1. Company Overview
Building on Its Foundation as Japan’s Largest Independent PR Firm, Now Entering the Next Stage Through Group Realignment
Founded in 1964, Kyodo PR is one of Japan’s first comprehensive PR firms. Focused on media relations-based corporate PR support, the company has been in business for more than half a century. In addition to its bases in Tokyo and Nagoya, the company opened a new branch in Osaka in 2024 to strengthen its presence in the Kansai region. Listed in 2005, Kyodo PR is currently traded on the Tokyo Stock Exchange Standard Market.
The group structure includes multiple subsidiaries handling PR operations, as well as VAZ Inc. for influencer marketing and Keywalker Inc. for AI and big data solutions. Together, these companies enable in-house execution across media production, marketing, and analytics. As of FY2024, the company has 345 employees on a consolidated basis.
Its business portfolio is well-balanced, consisting of PR (74%), influencer marketing (13%), and AI and big data solutions (12%).
2. Business Characteristics and Overview
A Stable Revenue Base Built on Retainer Contracts and a Three-Pillar Strategy for Diversified Growth
Kyodo PR’s business model is rooted in long-term “retainer” contracts of six months or more, offering comprehensive support for clients’ PR activities and providing a stable revenue base. In FY2024, retainer contracts accounted for more than half of revenue, with the domestic client ratio increasing steadily to 64.6%.
Its PR services go far beyond securing media coverage. The company offers full-spectrum public relations, including crisis communications, CSR PR, IR support, and multimedia content creation via web and video, with particular strength in handling multi-format media.
In influencer marketing, led by group company VAZ Inc., Kyodo PR operates its media channels (e.g., “Mellpuchi”) and generates diversified revenue through advertisements, sponsorships, and MCN (multi-channel network) operations. In 2024, this segment posted record profits, backed by numerous successful promotions targeting Gen Z.
In the AI and big data segment, Keywalker Inc. offers solutions like “Shtock Data” and “Dataiku,” enabling the collection, analysis, and visualization of web-based open data. These tools support clients’ marketing DX and operational efficiency and are gaining traction among non-engineering users thanks to their intuitive, no-code design.
3. Mid-Term Management Plan
A Strategic Blueprint Toward “New’S Design Company” and Discontinuous Growth Potential
To mark its 60th anniversary in 2024, Kyodo PR has launched a three-year mid-term plan (FY2024–FY2026) centered around evolving into a “New’S Design Company.” This vision reflects a shift beyond the traditional PR firm model, positioning the company as a new type of integrated solutions provider that combines information dissemination with problem-solving capabilities.
The financial goals for FY2026 are 10 billion yen in revenue (CAGR of 11.6%) and 1.6 billion yen in operating profit (operating margin of 16%). Compared with FY2024 results (7.32 billion yen in revenue and 1.07 billion yen in operating profit), the company has shown solid progress in its first year, achieving 97.6% of its revenue target and 102.2% of its profit target.
The primary growth drivers are the AI & Big Data Solutions and Influencer Marketing segments. The former is focused on the development and sales of SaaS-based products, while the latter is expanding advertising deals in tandem with increasing media views and subscriber counts.
In contrast, the success of the mid-term plan will hinge on the company’s ability to strengthen its internal infrastructure in response to external risks such as intensifying competition, market changes driven by generative AI, and tighter influencer regulations. Key measures include investment in human capital (education and reskilling), strategic use of M&A, and enhancement of governance systems.
4. International Business
Rebuilding Stage Underway—Strategic Partnerships Aiming to Re-enter the Global Public Affairs Market
Kyodo PR’s international business is currently limited in scale and contributes modestly to consolidated results. Although the company once operated overseas subsidiaries and partnerships in markets such as China and the U.S., many of these have since been dissolved, and direct overseas expansion remains restrained.
However, in 2024, the company entered into a strategic partnership with U.S.-based lobbying firm Ballard Partners, signaling the beginning of a more structured effort to support international public affairs and government relations.
This partnership allows Kyodo PR to support Japanese clients expanding into the U.S. and assist U.S. companies entering the Japanese market, forming a foundation for bi-directional communication capabilities that go beyond conventional PR services. This move also aligns with the rising demand for external communications from government agencies and large enterprises.
At the end of FY2024, the proportion of foreign-affiliated clients had declined slightly to 35.4%, indicating a shift toward a greater emphasis on domestic clients. The expansion of the domestic retainer contract base suggests that the current management strategy prioritizes “domestic deepening.”
Looking ahead, for international business to become a true growth driver in the medium to long term, the company must expand its multilingual capabilities, cross-border PR, and global influencer marketing. Additionally, investors will expect more precise quantitative targets and a roadmap for growing local operations and international partner networks.
5. Long-Term Performance
Operating Profit and ROE More Than Doubled—A Decade of Growth Following the Pandemic
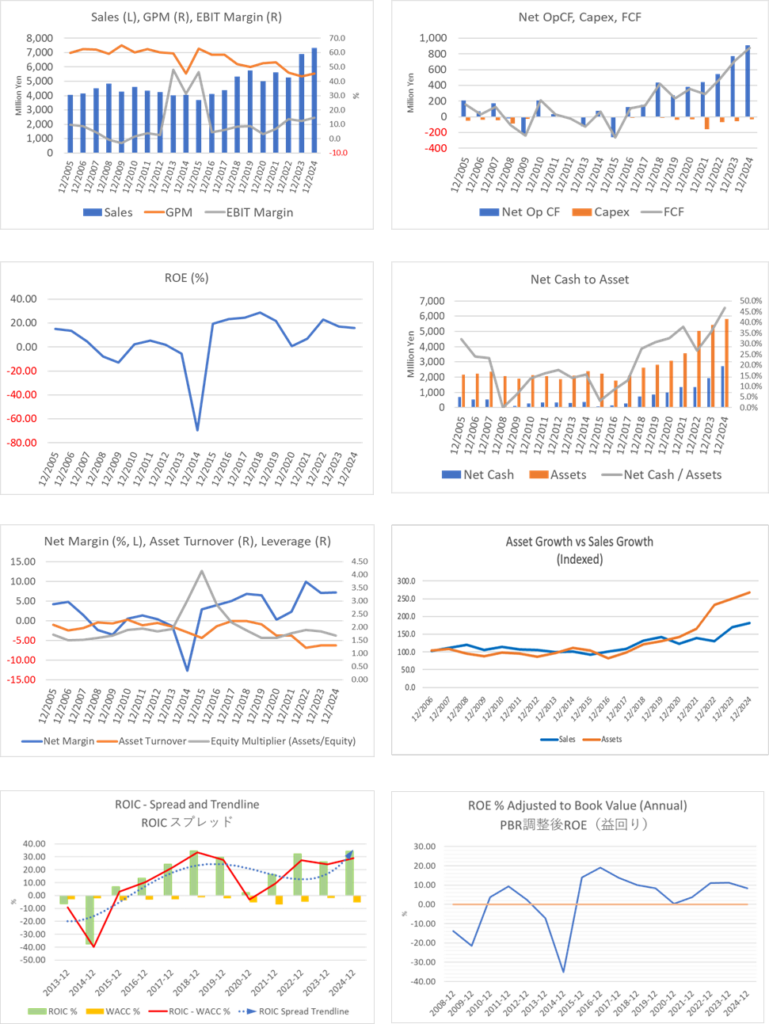
Kyodo PR’s performance rebounded steadily after the temporary slowdown caused by the COVID-19 pandemic in 2020. Between 2020 and 2024, consolidated net sales increased from 4.99 billion yen to 7.32 billion yen, a 1.5 times increase, with a compound annual growth rate (CAGR) of approximately 10%. Notably, the company has posted record-high operating profits for three consecutive years since FY2022, signaling a qualitative improvement in profitability.
The company has also maintained a strong financial position. As of the end of FY2024, the equity ratio stood at 58.8%, and net cash levels remained ample. Cash and deposits increased from 1.9 billion yen in 2021 to over 3.2 billion yen in 2024, accounting for nearly half of total assets.
Return on Equity (ROE) improved significantly, rising from 7.1% in 2021 to 16.5% in 2024, well above the average for listed companies. However, with growing net assets, ROE may gradually decline in the future, making it essential to balance sustained profit growth with capital efficiency.
In terms of workforce, employee numbers increased by approximately 40%, from 243 in 2020 to 345 in 2024. This reflects continued investment in human capital to support new businesses and regional expansion. While this lays a foundation for future growth, rising personnel costs may put pressure on margins.
Over the medium to long term, Kyodo PR stands out as one of the few publicly listed companies in the PR industry to achieve both stable growth and high profitability, making it an attractive investment from a quantitative performance standpoint.
6. Recent Earnings
All Segments Achieve Revenue Growth—Operating Margin Hits a Record High of 14.7%
In FY12/2024, Kyodo PR recorded consolidated net sales of 7.32 billion yen (+6.2% YoY), operating profit of 1.07 billion yen (+27.8%), ordinary profit of 1.08 billion yen (+25.4%), and net income of 530 million yen (+7.9%). The operating margin reached a record 14.7%, which is attributed to improved gross profit margins and effective control over selling, general, and administrative expenses.
All three segments saw year-on-year revenue increases: PR business at 5.44 billion yen (+3.1%), influencer marketing at 990 million yen (+17.8%), and AI & Big Data Solutions at 890 million yen (+14.9%). Notably, the latter two segments also recorded substantial improvements in profitability, with segment profits reaching 83 million yen (+106.8%) and 171 million yen (+44.8%) respectively.
Operating cash flow grew to 910 million yen (+17% YoY), reflecting the company’s continued ability to generate stable internal funding. Investment cash flow remained restrained at -37 million yen, primarily used for equipment and system upgrades, with no large-scale investments or M&A activity recorded. On the other hand, financing cash flow showed outflows due to the repayment of long-term debt (-230 million yen) and dividend payments (-86 million yen). However, the balance of cash and cash equivalents remained solid at 3.10 billion yen.
A notable point is the decline in the proportion of foreign-affiliated clients, which dropped to 35.4% (-4.3pt YoY). As a result, careful attention is required to assess how changes in client composition may impact future pricing and retainer contract terms. However, this has been largely offset by the increase in domestic clients, and the overall customer base continues to grow steadily.
7. Full-Year Forecast
Another Year of Double-Digit Growth Expected in FY2025, With Margin Expansion and Mid-Term Plan Progress in Focus
For FY2025, the company forecasts consolidated net sales of 8.5 billion yen (+16.1%), operating profit of 1.28 billion yen (+19.1%), ordinary profit of 1.28 billion yen (+18.3%), and net income of 730 million yen (+38.7%).
While no segment-level forecast has been disclosed, based on the current business portfolio, balanced contributions are expected from high-growth AI and influencer marketing businesses, as well as stable demand in the PR segment.
Profit growth is particularly notable: both operating and net income are projected to outpace top-line growth, suggesting further margin expansion and potential scale benefits. Having achieved an operating margin of 14.7% in FY2024, the company appears poised to exceed 15% in FY2025.
The mid-term plan targets 10 billion yen in net sales and 1.6 billion yen in operating profit by FY2026. The FY2025 plan assumes sustained growth toward these goals. Against the FY2026 revenue target, the company achieved a progress rate of 73% in FY2024. The plan assumes progress of 85% in FY2025 and 100% in FY2026, but there is already upside potential at this stage. This suggests that the conservative nature of the plan may enhance its investment appeal.
Potential downside risks include structural disruption from generative AI, regulatory tightening in influencer marketing, and platform dependency. Future mid-term growth will hinge on revenue diversification and adaptability to changing regulations.
8. Growth Strategy and Risks
Deepening PR, Digital Expansion, and In-House Media Development Form a Three-Pronged Growth Model; Risks Lie in Structural Shifts and Human Capital.
Kyodo PR’s growth strategy consists of three core pillars:
1. Deepening of its core PR and public affairs operations
2. Expansion into digital and data-driven domains
3. Development of proprietary media and in-house creators to build content assets
The PR business continues to target highly specialized accounts, including foreign corporations, government entities, and IT companies, with a focus on expanding long-term retainer contracts.
The influencer business—regarded as a growth driver—saw substantial revenue from its YouTube and SNS channels (“Mellpuchi,” “MelTV,” “CulDrama”), which attracted advertising sponsors and MCN income. Engagement campaigns like “Mellpuchi Senbatsu 2024” proved effective, and future monetization could involve live commerce or e-commerce integrations.
In the AI and big data solutions segment, the company utilizes tools like “Dataiku” and “Shtock Data” to promote marketing DX for clients. With intuitive no-code GUI interfaces, these tools have gained popularity among non-technical users, and scalability as SaaS products remains a key growth lever.
That said, several risk factors exist. First, the inherent volatility of the influencer business can lead to revenue shocks from incidents such as creator scandals or account bans. Second, rapid technological advances—including the rise of generative AI—could render legacy PR and analytics models obsolete. Third, reliance on external vendors and platforms could present operational risks.
Human capital also poses a strategic challenge. Success depends on acquiring and retaining high-level PR consultants and digital talent. Recruiting difficulties and rising labor costs may affect margins. In a more competitive pricing environment, differentiation through value-added services will become essential.
To address these risks, the company is strengthening internal controls, enhancing internal audit capabilities, and improving governance indicators. Balancing the execution of the growth strategy with effective risk management will be key to long-term value creation.
9. Stock Price and Valuation
Despite High Profitability, Valuation Lags—Improved Shareholder Returns and Growth Execution Could Trigger a Re-Rating
Kyodo PR’s shares currently trade at a forecast PER of around 9x and a PBR of 1.9x—levels that appear undervalued given its high profitability.
Compared to peers such as Sunny Side Up (2180) and Vector (6058), Kyodo PR boasts superior ROE and operating margins, yet market valuation remains muted. This likely stems from lingering perceptions of the company as a traditional PR firm and a lack of market recognition for its AI and digital growth potential.
However, strong FY2024 results and a solid FY2025 outlook, combined with steady progress on the mid-term plan, point toward ample re-rating potential.
In terms of capital policy, the company paid a dividend of 12 yen per share in FY2024 and plans to raise it to 14 yen in FY2025. The expected dividend yield of around 2.5% reflects a stable, progressive dividend policy. With a strong cash position, the possibility of share buybacks is becoming increasingly realistic, adding further appeal for shareholders.
In addition, the expansion of free cash flow and the accumulation of net cash have contributed to a decline in the company’s financial risk premium, serving as a factor for upward valuation adjustment. Considering the widening spread between ROIC and WACC, the current situation provides a strong basis to justify a higher valuation.
The current share price reflects a discount relative to the company’s performance. There remains considerable potential for revaluation by investors through enhanced shareholder returns, accelerated growth, and strategic transformation of the business portfolio.
10. Investment Conclusion Based on Performance and Valuation
Reaffirmed as an Undervalued Growth Stock: Progress on Mid-Term Plan, Rising ROIC, and Strong Financial Health
Kyodo PR has steadily transitioned from its traditional PR services base into growth domains such as influencer marketing and AI solutions. The company has achieved record operating profits for three consecutive years, and its FY2024 profitability metrics—14.7% operating margin and 16.5% ROE—clearly surpass those of its industry peers.
Under its mid-term management plan, Kyodo PR aims for 10 billion yen in net sales and 1.6 billion yen in operating profit by FY2026. Notably, operating profit already exceeded the target pace in the first year, underscoring the company’s execution capability.
Financially, the company is extremely sound, with a 58.8% equity ratio and ample cash and deposits totaling 3.22 billion yen. This enhances resilience to external shocks and enables future investments. ROIC is trending upward and remains well above WACC, driving robust Economic Value Added (EVA). With a near-debt-free balance sheet and positive free cash flow for three consecutive years, the company enjoys increasing capital allocation flexibility.
Despite these strengths, valuation remains modest with a forecast PER of 9.0x and a PBR of 1.9x. This likely reflects continued market underestimation of its new business potential. However, accelerated growth in its owned media properties in the influencer segment and expanding SaaS-based offerings in AI solutions signal significant potential for future valuation re-rating.
Shareholder return policy is also favorable. A dividend increase to 14 yen per share is planned for 2025, with a projected dividend yield of around 2%. In the medium term, there is potential for further enhancement of total shareholder return, including share buybacks.
That said, Kyodo PR must also address challenges arising from external changes such as the evolution of generative AI and stricter SNS regulations. Diversification and risk management will be key to navigating such shifts. The company is already strengthening its organization through regional expansion, personnel investments, and strategic partnerships.
In conclusion, Kyodo PR stands out as a company with stable earnings, a strategic position in growth markets, and a robust financial foundation. Its undervalued stock price, sound performance, and improving shareholder returns position it as a core holding candidate for long-term portfolios.
11. ROE Trends and Current Assessment
ROE Reaches 16.5%—Improvements in Capital Efficiency Amid Rising Equity Base
Kyodo PR’s Return on Equity (ROE) rose sharply from 5.6% in FY2020 to 16.5% in FY2024, significantly outperforming the 8–10% average of listed companies in Japan. Since FY2022, growth in influencer and AI-related businesses has led to steady gains in operating and net income, contributing to the increase in ROE.
A DuPont analysis reveals the following drivers:
- Net Profit Margin Expansion: Operating margin improved from 9.2% in FY2021 to 14.7% in FY2024, supported by optimized SG&A and a shift to higher-margin businesses.
- Stable Asset Turnover: Sales-to-total-asset ratio remained around 1.3x, indicating efficient asset utilization alongside revenue growth.
- Low Financial Leverage: With minimal interest-bearing debt and a continued net cash position, the company achieved higher ROE without increasing financial risk, indicating high-quality capital efficiency.
At the end of FY2024, the equity ratio stood at 58.8%, up approximately eight percentage points over three years. While this could lead to a gradual slowdown in ROE due to equity growth, it also signifies further improvements in financial soundness and the company’s capacity to grow without external funding.
Even if ROE temporarily peaks, it would reflect stronger financial health. Going forward, strategies that focus on efficient capital allocation and enhanced shareholder returns will be critical to sustaining ROE levels above the cost of equity.
12. ROIC and WACC: Stable Value Creation and Outstanding Capital Productivity
ROIC Outpaces WACC by Over 10 Points—A Consistent Generator of EVA
Kyodo PR’s ability to generate Economic Value Added (EVA) has shown a clear upward trend since 2023. The company’s Return on Invested Capital (ROIC) reached approximately 17–18% in FY2024, up from the mid-10% range in FY2022, significantly exceeding its estimated Weighted Average Cost of Capital (WACC).
WACC is estimated to be around 6–7%, based on the company’s capital structure—an equity ratio of 58.8%, no credit rating, a net cash position, and an assumed cost of capital of 7–8%. With ROIC exceeding WACC by over 10 points, EVA (NOPAT – Invested Capital × WACC) remains firmly positive, positioning Kyodo PR as a highly capital-productive enterprise.
Several structural factors support the company’s elevated ROIC:
- Asset-Light Revenue Model: Both the PR and influencer marketing businesses require minimal fixed assets or inventory, keeping invested capital low.
- High Profit Margins: As discussed previously, the company posted an operating margin of 14.7%, resulting in a robust NOPAT.
- Efficient Asset Turnover: With limited fixed and non-operating assets outside of cash and accounts receivable, Kyodo PR displays strong capital efficiency, even by non-manufacturing standards.
Looking ahead, if free cash flow continues to accumulate and invested capital remains constrained while NOPAT increases, ROIC could rise further. As long as growth investments are subject to strict profitability evaluation, expanding EVA will continue to enhance long-term shareholder value, further boosting the company’s appeal to long-term investors.
13. Free Cash Flow and Capital Allocation: Evaluating the Drivers of Corporate Value
FCF of 860 Million Yen and 55% Cash-to-Asset Ratio—A Balanced Approach to Capital Allocation
Kyodo PR’s free cash flow (FCF) has improved sharply since 2023, becoming a key indicator of the company’s strong profitability and capital efficiency. In FY2024, operating cash flow remained high at 900 million yen (up 130 million yen YoY), while investment cash flow was held to just -40 million yen, resulting in more than 860 million yen in positive FCF. This marks the second consecutive year of significant free cash flow generation, underscoring the company’s strengthened ability to create cash.
Several key factors underpin this performance:
- The company’s core PR and marketing businesses are both high-margin and asset-light.
- Capital expenditures and M&A activity are conservative, with emphasis placed on maximizing the use of existing assets.
- Working capital efficiency has improved, particularly through better management of receivables and payables.
On the financing side, the company repaid long-term borrowings (230 million yen) and paid dividends (90 million yen), yet still generated internal funds that exceeded these outflows. As a result, its cash position has become even stronger. As of the end of FY2024, cash and equivalents stood at 3.22 billion yen, accounting for nearly 55% of total assets. This represents an excellent financial base even by industry standards.
Regarding capital allocation of surplus FCF, the company has outlined the following priorities:
- Selective and cautious growth investments, particularly in AI, media, and DX domains
- Progressive dividend enhancement, with plans to increase the annual dividend from 12 yen in FY2024 to 14 yen in FY2025
- Reinforcement of equity capital without increasing financial leverage
- Retaining the flexibility to pursue share buybacks in the future
Therefore, the company’s capital allocation model reflects a well-balanced approach that emphasizes growth, sustainability, and financial soundness—a balance between offense and defense.
If the company continues to generate robust free cash flow, it will have greater flexibility to pursue more proactive shareholder return policies and non-linear growth strategies such as M&A, thereby increasing the potential for revaluating its corporate value.
14. Shareholder Returns: Outlook and Evaluation
Progressive Dividends and the Rising Likelihood of Share Buybacks—Upside Potential from Increasing Payout Capacity
Kyodo PR has historically maintained a conservative yet stable stance toward shareholder returns. However, recent developments suggest a gradual shift in policy. In FY2024, the company raised its dividend to 12 yen per share (+2 yen YoY), and a further increase to 14 yen is projected for FY2025. Kyodo PR compares favorably with industry averages with an estimated dividend yield of 2.5–2.7%.
Past performance confirms a progressive dividend policy in line with profit growth. However, the payout ratio remains modest at approximately 25–30%, leaving ample room for enhancement given the company’s robust cash reserves.
Key factors to watch in future shareholder returns include:
1. Share Buyback Potential
With a strengthened balance sheet and cash and equivalents accounting for nearly 50% of total assets, Kyodo PR can consider buybacks as a flexible method of capital return. From the standpoint of capital efficiency, such actions would be justified.
2. Disclosure of Total Shareholder Return Targets
The company does not publish a formal shareholder return policy with quantitative targets. However, as progress on the mid-term plan continues, a benchmark of 30–40% total shareholder return may be established.
3. Enhanced IR Communications
By articulating its shareholder return policy more explicitly, Kyodo PR can transition from being seen as a conservative, defensive enterprise to one recognized as a growth company with proactive capital allocation.
In conclusion, Kyodo PR should be viewed as a company with considerable room for enhancing shareholder returns. From the perspectives of profitability, free cash flow, and net cash reserves, the company is well-positioned to increase shareholder payouts. Realizing this potential could act as a catalyst for a meaningful re-rating of its stock.
15. Corporate Valuation (DCF, PER, PBR Analysis)
DCF Indicates 30% Upside—Gap Between Qualitative Strengths and Market Valuation Offers Investment Appeal
Kyodo PR’s current valuation remains inexpensive from quantitative and forward-looking perspectives.
Key valuation metrics as of FY2024 are as follows:
- PER: 9.0x
- PBR: 1.9x
- Forecast Dividend Yield: 1.86%
- ROE (FY12/2024): 16.5%
These numbers suggest that the market maintains a conservative stance toward the company’s valuation despite its high ROE and strong profitability. Compared to peer averages—PER of 15–18x and PBR of 1.5–2.0x—the data suggests undervaluation and unrecognized growth potential.
When estimating valuation using the DCF method, the following assumptions, though conservative, clearly support the case for undervaluation:
- Revenue growth rate: average 10% annually (2025–2028)
- Operating margin: 14–15% (stable level)
- WACC: 6.0% •Terminal growth rate: 2.0%
The valuation gap, evidenced by a DCF-based fair value of approximately 980 yen per share (based on 10–12% sales growth, 14–15% margins, WACC of 6.0%, and terminal growth of 2.0%), indicates more than 30% upside versus its current trading level (~750 yen as of April 2025).
This mispricing appears rooted in structural factors such as:
- A lack of full market recognition of the influencer and AI/DX businesses
- Defensive investor perceptions of the traditional PR industry
- Insufficient external communication of the company’s growth story and capital policy
However, as earnings continue to beat expectations, and shareholder returns and IR communications improve, a revaluation of the stock becomes increasingly likely. The mismatch between quantitative valuation and qualitative positioning presents a compelling opportunity, making Kyodo PR an attractive candidate for long-term portfolios.
16. Peer Comparison and Valuation Multiples
Industry-Leading Operating Margin and ROE—A Rare Case of Undervalued High-Quality Stock
The following table shows Kyodo PR’s relative valuation and profitability positioning compared to its industry peers.
| Company name | Securities code | PER (X) | PBR (X) | ROE (X) | Operating profit ratio (%) | Equity ratio (%) |
| KYODO PUBLIC RELATIONS | 2436 | 9.0 | 1.9 | 16.5 | 14.7 | 58.8 |
| SUNNY SIDE UP | 2180 | 7.9 | 16.9 | 21.1 | 8.2 | 41.2 |
| VECTOR | 6058 | 8.3 | 2.4 | 32.2 | 13.5 | 37.0 |
| FreakOut Holdings | 6094 | na | 0.69 | -22.0 | 0,0 | 30.6 |
This comparison shows that Kyodo Public Relations is a rare example of a valuation dislocation—combining high profitability and high ROE with a low valuation. Its operating margin exceeding 14% is notably high within the advertising and PR industry, indicating a structural competitive advantage.
Furthermore, the company maintains the highest level of financial soundness in the peer group, with a strong equity ratio and low debt risk, making it particularly attractive to long-term investors. In the influencer segment, the company leverages its subsidiary VAZ, while in the AI and digital transformation space, it continues to differentiate itself from competitors by developing its own proprietary products.
17. Final Investment View
The Investment Case: High Profitability × Growth Potential × Ample Return Capacity
In conclusion, Kyodo PR should be viewed as a highly profitable yet undervalued stock with significant potential for re-rating. With continued progress on the mid-term plan and further monetization of growth segments, PER could reasonably rise to the 15–18x range.
As the broader equity market resumes interest in growth names, Kyodo PR—with its rare combination of capital efficiency, financial soundness, and future growth potential—is well positioned to attract institutional and long-term investor capital.
Key stock price data
Key financial data
| Unit: million yen | 2020/12 | 2021/12 | 2022/12 | 2023/12 | 2024/12 | 2025/12 CE |
| Sales | 4,990 | 5,610 | 5,265 | 6,896 | 7,324 | 8,500 |
| EBIT (Operating Income) | 157 | 381 | 720 | 841 | 1,075 | 1,280 |
| Pretax Income | 70 | 288 | 768 | 862 | 1,034 | |
| Net Profit Attributable to Owner of Parent | 13 | 132 | 520 | 488 | 526 | 730 |
| Cash & Short-Term Investments | 1,531 | 1,943 | 2,318 | 2,691 | 3,260 | |
| Total assets | 3,068 | 3,572 | 5,044 | 5,428 | 5,810 | |
| Total Debt | 531 | 591 | 967 | 767 | 539 | |
| Net Debt | -1,000 | -1,352 | -1,351 | -1,925 | -2,721 | |
| Total liabilities | 1,254 | 1,630 | 2,267 | 2,097 | 1,921 | |
| Total Shareholders’ Equity | 1,814 | 1,942 | 2,595 | 3,090 | 3,553 | |
| Net Operating Cash Flow | 384 | 442 | 546 | 771 | 911 | |
| Capital Expenditure | 30 | 155 | 67 | 54 | 33 | |
| Net Investing Cash Flow | -102 | -26 | -397 | -35 | -37 | |
| Net Financing Cash Flow | 242 | 16 | 220 | -375 | -311 | |
| Free Cash Flow | 355 | 286 | 479 | 717 | 878 | |
| ROA (%) | 0.43 | 3.97 | 12.08 | 9.31 | 9.36 | |
| ROE (%) | 0.68 | 7.03 | 22.94 | 17.15 | 15.84 | |
| EPS (Yen) | 1.6 | 16.3 | 61.2 | 56.6 | 60.6 | 84.1 |
| BPS (Yen) | 229.8 | 236.1 | 299.5 | 356.7 | 408.2 | |
| Dividend per Share (Yen) | 6.00 | 7.00 | 8.00 | 10.00 | 12.00 | 14.00 |
| Shares Outstanding (Million shrs) | 8.18 | 8.64 | 8.74 | 8.78 | 8.79 |
Source: Omega Investment from company data, rounded to the nearest whole number.
Share price
Financial data (quarterly basis)
| Unit: million yen | 2023/12 | 2024/12 | ||||||
| 1Q | 2Q | 3Q | 4Q | 1Q | 2Q | 3Q | 4Q | |
| (Income Statement) | ||||||||
| Sales | 1,649 | 1,615 | 1,689 | 1,943 | 1,788 | 1,779 | 1,716 | 2,041 |
| Year-on-year | 52.4% | 43.3% | 21.3% | 16.8% | 8.4% | 10.2% | 1.6% | 5.0% |
| Cost of Goods Sold (COGS) | 907 | 903 | 956 | 1,128 | 972 | 966 | 925 | 1,147 |
| Gross Income | 742 | 712 | 734 | 815 | 816 | 814 | 791 | 894 |
| Gross Income Margin | 45.0% | 44.1% | 43.4% | 42.0% | 45.6% | 45.7% | 46.1% | 43.8% |
| SG&A Expense | 474 | 532 | 540 | 616 | 519 | 545 | 530 | 646 |
| EBIT (Operating Income) | 267 | 180 | 194 | 200 | 297 | 269 | 261 | 248 |
| Year-on-year | 13.2% | -7.1% | 26.6% | 45.6% | 11.2% | 49.2% | 34.4% | 24.4% |
| Operating Income Margin | 16.2% | 11.2% | 11.5% | 10.3% | 16.6% | 15.1% | 15.2% | 12.2% |
| EBITDA | 318 | 235 | 251 | 254 | 349 | 319 | 312 | 298 |
| Pretax Income | 265 | 189 | 202 | 206 | 277 | 271 | 230 | 256 |
| Consolidated Net Income | 160 | 108 | 126 | 152 | 147 | 177 | 147 | 150 |
| Minority Interest | 16 | 9 | 19 | 15 | 31 | 28 | 26 | 10 |
| Net Income ATOP | 144 | 99 | 106 | 137 | 116 | 148 | 121 | 141 |
| Year-on-year | -6.0% | -45.5% | 24.1% | 39.3% | -19.5% | 49.1% | 13.6% | 2.5% |
| Net Income Margin | 8.8% | 6.2% | 6.3% | 7.1% | 6.5% | 8.3% | 7.0% | 6.9% |
| (Balance Sheet) | ||||||||
| Cash & Short-Term Investments | 2,113 | 2,310 | 2,327 | 2,691 | 2,657 | 2,980 | 2,946 | 3,260 |
| Total assets | 4,786 | 4,940 | 4,905 | 5,428 | 5,286 | 5,448 | 5,342 | 5,810 |
| Total Debt | 886 | 885 | 826 | 767 | 707 | 647 | 586 | 539 |
| Net Debt | -1,226 | -1,426 | -1,500 | -1,925 | -1,950 | -2,333 | -2,360 | -2,721 |
| Total liabilities | 1,944 | 1,945 | 1,771 | 2,097 | 1,885 | 1,855 | 1,615 | 1,921 |
| Total Sharehjolders’ Equity | 2,644 | 2,788 | 2,908 | 3,090 | 3,129 | 3,293 | 3,401 | 3,553 |
| (Profitability %) | ||||||||
| ROA | 12.02 | 8.53 | 9.03 | 9.31 | 9.12 | 9.79 | 10.20 | 9.36 |
| ROE | 21.74 | 16.43 | 16.52 | 17.15 | 15.92 | 16.72 | 16.57 | 15.84 |
| (Per-share) Unit: JPY | ||||||||
| EPS | 16.8 | 11.5 | 12.3 | 15.9 | 13.4 | 17.1 | 13.9 | 16.2 |
| BPS | 307.8 | 323.6 | 337.0 | 356.7 | 361.1 | 379.0 | 391.4 | 408.2 |
| Dividend per Share | 0.00 | 0.00 | 0.00 | 10.00 | 0.00 | 0.00 | 0.00 | 12.00 |
| Shares Outstanding(million shrs) | 8.74 | 8.75 | 8.75 | 8.78 | 8.79 | 8.79 | 8.79 | 8.79 |
Financial data (full-year basis)
| Unit: million yen | 2014 | 2015 | 2016 | 2017 | 2018 | 2019 | 2020 | 2021 | 2022 | 2023 | 2024 |
| (Income Statement) | |||||||||||
| Sales | 4,063 | 3,705 | 4,100 | 4,379 | 5,318 | 5,758 | 4,990 | 5,610 | 5,265 | 6,896 | 7,324 |
| Year-on-year | 1.1% | -8.8% | 10.7% | 6.8% | 21.4% | 8.3% | -13.3% | 12.4% | -6.1% | 31.0% | 6.2% |
| Cost of Goods Sold | 2,223 | 1,385 | 1,703 | 1,822 | 2,546 | 2,879 | 2,367 | 2,614 | 2,843 | 3,894 | 4,010 |
| Gross Income | 1,840 | 2,320 | 2,396 | 2,558 | 2,772 | 2,879 | 2,623 | 2,996 | 2,422 | 3,002 | 3,314 |
| Gross Income Margin | 45.3% | 62.6% | 58.5% | 58.4% | 52.1% | 50.0% | 52.6% | 53.4% | 46.0% | 43.5% | 45.3% |
| SG&A Expense | 569 | 597 | 2,216 | 2,293 | 2,324 | 2,374 | 2,456 | 2,597 | 1,685 | 2,147 | 2,225 |
| EBIT (Operating Income) | 1,271 | 1,723 | 180 | 265 | 444 | 502 | 157 | 381 | 720 | 841 | 1,075 |
| Year-on-year | -34.0% | 35.5% | -89.5% | 46.7% | 68.0% | 12.9% | -68.8% | 143.8% | 88.7% | 16.8% | 27.8% |
| Operating Income Margin | 31.3% | 46.5% | 4.4% | 6.0% | 8.4% | 8.7% | 3.1% | 6.8% | 13.7% | 12.2% | 14.7% |
| EBITDA | 1,282 | 1,733 | 195 | 284 | 468 | 534 | 202 | 447 | 857 | 1,059 | 1,279 |
| Pretax Income | -386 | 132 | 181 | 257 | 432 | 502 | 70 | 288 | 768 | 862 | 1,034 |
| Consolidated Net Income | -515 | 108 | 163 | 221 | 366 | 372 | 13 | 132 | 539 | 546 | 621 |
| Minority Interest | 0 | 0 | 0 | 0 | 0 | 0 | 0 | 0 | 18 | 58 | 95 |
| Net Income ATOP | -515 | 108 | 163 | 221 | 366 | 372 | 13 | 132 | 520 | 488 | 526 |
| Year-on-year | 803.1% | -121.0% | 51.2% | 35.3% | 65.8% | 1.5% | -96.6% | 943.0% | 294.4% | -6.3% | 7.9% |
| Net Income Margin | -12.7% | 2.9% | 4.0% | 5.0% | 6.9% | 6.5% | 0.3% | 2.4% | 9.9% | 7.1% | 7.2% |
| (Balance Sheet) | |||||||||||
| Cash & Short-Term Investments | 851 | 473 | 611 | 659 | 1,012 | 1,032 | 1,531 | 1,943 | 2,318 | 2,691 | 3,260 |
| Total assets | 2,408 | 2,247 | 1,784 | 2,113 | 2,637 | 2,831 | 3,068 | 3,572 | 5,044 | 5,428 | 5,810 |
| Total Debt | 478 | 402 | 462 | 390 | 280 | 163 | 531 | 591 | 967 | 767 | 539 |
| Net Debt | -373 | -71 | -149 | -269 | -732 | -869 | -1,000 | -1,352 | -1,351 | -1,925 | -2,721 |
| Total liabilities | 1,910 | 1,622 | 1,003 | 1,105 | 1,109 | 930 | 1,254 | 1,630 | 2,267 | 2,097 | 1,921 |
| Total Sharehjolders’ Equity | 498 | 625 | 782 | 1,008 | 1,528 | 1,901 | 1,814 | 1,942 | 2,595 | 3,090 | 3,553 |
| (Cash Flow) | |||||||||||
| Net Operating Cash Flow | 76 | -260 | 125 | 152 | 437 | 274 | 384 | 442 | 546 | 771 | 911 |
| Capital Expenditure | 9 | 8 | 13 | 9 | 15 | 36 | 30 | 155 | 67 | 54 | 33 |
| Net Investing Cash Flow | 8 | -68 | -16 | -15 | -131 | -123 | -102 | -26 | -397 | -35 | -37 |
| Net Financing Cash Flow | 68 | -79 | 31 | -89 | 47 | -132 | 242 | 16 | 220 | -375 | -311 |
| Free Cash Flow | 67 | -264 | 112 | 144 | 422 | 238 | 355 | 286 | 479 | 717 | 878 |
| (Profitability %) | |||||||||||
| ROA | -22.91 | 4.64 | 8.11 | 11.34 | 15.43 | 13.60 | 0.43 | 3.97 | 12.08 | 9.31 | 9.36 |
| ROE | -69.43 | 19.25 | 23.24 | 24.69 | 28.89 | 21.69 | 0.68 | 7.03 | 22.94 | 17.15 | 15.84 |
| Net Margin | -12.68 | 2.92 | 3.99 | 5.05 | 6.89 | 6.46 | 0.25 | 2.35 | 9.89 | 7.07 | 7.18 |
| Asset Turn | 1.81 | 1.59 | 2.03 | 2.25 | 2.24 | 2.11 | 1.69 | 1.69 | 1.22 | 1.32 | 1.30 |
| Assets/Equity | 3.03 | 4.15 | 2.87 | 2.18 | 1.87 | 1.59 | 1.59 | 1.77 | 1.90 | 1.84 | 1.69 |
| (Per-share) Unit: JPY | |||||||||||
| EPS | -69.9 | 14.7 | 22.2 | 30.0 | 46.6 | 46.6 | 1.6 | 16.3 | 61.2 | 56.6 | 60.6 |
| BPS | 67.5 | 84.7 | 106.0 | 136.7 | 191.9 | 237.9 | 229.8 | 236.1 | 299.5 | 356.7 | 408.2 |
| Dividend per Share | 0.00 | 0.00 | 0.00 | 0.00 | 2.50 | 5.00 | 6.00 | 7.00 | 8.00 | 10.00 | 12.00 |
| Shares Outstanding(million shrs) | 7.56 | 7.56 | 7.56 | 7.56 | 8.15 | 8.17 | 8.18 | 8.64 | 8.74 | 8.78 | 8.79 |
Source: Omega Investment from company materials