2026-06-19
Home
Japanese

Omega Investment Co., Ltd.
Ricksoft (Investment Report – 4Q update)
| Share price (6/23) | ¥811 | Dividend Yield (26/2 CE) | 0.0 % |
| 52weeks high/low | ¥738/2,144 | ROE(25/2 act) | 12.3% |
| Avg Vol (3 month) | 6.8 thou shrs | Operating margin (TTM) | 5.1 % |
| Market Cap | ¥3.69 bn | Beta (5Y Monthly) | -0.01 |
| Enterprise Value | ¥0.35 bn | Shares Outstanding | 4.550 mn shrs |
| PER (26/2 CE) | 11.5 X | Listed market | TSE Growth |
| PBR (25/2 act) | 1.2 X |
| Click here for the PDF version of this page |
| PDF version |
Cloud Migration and in-house development reignite growth – Strengthening profitability structure through structural reforms and strategic alliances now in focus
◇ FY2/2025 Financial highlights: Profit declined YoY, but in-house development and SI recovery led to outperformance
Ricksoft Co., Ltd. (hereinafter, “the Company”) recorded revenue of 9.043 billion yen in FY2/2025 (+20.7% YoY), marking double-digit growth. However, operating profit declined to 458.67 million yen (–31.1% YoY) and ordinary profit to 461.80 million yen (–31.8% YoY). This decline was mainly due to intensified competition that lowered margins and increased selling expenses caused by changes in the support service composition.
That said, from 3Q onward, improved utilization rates, SI margin recovery, and a higher share of In-house-developed Software led to actual operating profit outperforming the Company’s January forecast of 345 million yen by 32.8%. As a result, net income reached 355 million yen (+32.2% YoY).
The operating margin declined to 5.1% (from 8.9% the previous year), and gross margin dropped to 26.3% (from 29.9%). These declines were driven by reduced gross margins on licenses and a shift in the sales mix caused by a sharp decline in Managed Services. On the cost side, SG&A was held to 21.2%, showing some success in organizational streamlining.
It is also positive that the special loss recorded in the previous year for stock option expenses was resolved, contributing to increased net profit.
The temporary decline in operating margin should be considered an unavoidable structural transformation cost. On the contrary, the fact that high-margin proprietary software supported results, culminating in upside earnings at fiscal year-end, is a favorable outcome.
◇ Segment analysis: Conservative plan incorporating temporary profit decline : Structural reform effects expected in 2H and beyond
The Company operates a single business segment—Tool Solutions—but revenue is effectively classified into four categories:
- License Sales: 7.405 billion yen in FY2/2025 (+22.1% YoY), achieving double-digit growth for a second consecutive year. Strong demand driven by continued migration to Atlassian Cloud.
- SI Services (including paid training): 745 million yen (+24.7% YoY). Utilization improved and project execution accelerated, particularly from 3Q onward.
- In-House Software Development: 723 million yen (+27.9% YoY). The high-margin business led by WBS Gantt-Chart appeals due to its strong compatibility with Jira.
- Managed Services: 168 million yen (–36.0% YoY). Temporary decline due to changes in the sales model.
By composition, License Sales account for a dominant 81.9%, followed by In-house Development (8.0%), SI (8.2%), and Managed Services (1.9%). Licenses and In-house Development drove revenue growth, while the drop in Managed Services caused margin pressure. Enhancing proprietary features and stabilizing through subscription-based revenue will be key mid-term themes.
Due to the shift to cloud-based Atlassian products, the Company is transitioning from lump-sum to amortized revenue recognition. End of February 2025, deferred revenue (contract liabilities) had accumulated to 2.35 billion yen. This structure is expected to serve as a source of future revenue accumulation.
◇ Earnings forecast: Conservative plan incorporating temporary profit decline : Reform results expected to materialize in 2H
The Company’s FY2/2026 forecast calls for revenue of 10.168 billion yen (+12.4% YoY), operating profit of 411 million yen (–10.3% YoY), ordinary profit of 411 million yen (–10.9% YoY), and net income of 315 million yen (–11.1% YoY). While top-line growth continues in double digits, a decline in profit is projected.
The backdrop to this is a structural change in profitability driven by the cloud migration of Atlassian products. On-premises products traditionally featured immediate revenue recognition and high gross margins. In contrast, cloud-based models typically involve monthly amortized revenue and reseller fees payable to Atlassian, generally resulting in lower gross margins.
However, the Company has begun to close the profitability gap between cloud and on-premises products by transitioning to a sales model in which support services, previously bundled with on-premises licenses, are now provided separately. There is currently no significant difference in gross margins between on-premises and cloud versions, indicating that differences in sales format have a limited impact on profitability. Therefore, cloud migration is not the primary cause of margin decline; instead, profitability is increasingly determined by optimizing the sales model and associated services.
Moreover, since comprehensive value propositions often rely on bundling support services and SI, the profitability of individual offerings may temporarily decline.
Meanwhile, structural reforms are already underway, including organizational restructuring and personnel reallocation. These measures, such as rebuilding the sales structure, strengthening coordination with the consulting division, and reallocating resources to In-house Software development, have been phased in since the second half of FY2/2025. The Company is now positioned for an operating margin recovery beginning in the second half and beyond. In particular, the SI division, which previously suffered from low utilization rates, has already shown improvement in 4Q, and further gains are expected in early FY2026 with the resumption of high-value project wins.
In-house Software Products are also gaining traction internationally. With full English UI support and distribution now underway via overseas partners, the revenue contribution from proprietary software is expected to grow. Overseas sales, which accounted for just over 8% of total revenue in FY2025, are projected to exceed 15% in FY2026, potentially helping to boost the operating margin.
Although revenue for Managed Services declined sharply last fiscal year, a transition is underway from a passive support model to a more proactive billing structure featuring managed operations and automated system tuning. Developing a new integrated management service centered on “D-Accel” is progressing. The timing of this service’s launch and its user adoption rate will be key to achieving the Company’s earnings forecast.
Although the Company is in a temporary adjustment phase regarding profitability, a visible recovery in operating margin, especially if articulated in the mid-term plan, could offer substantial potential for share price rerating. The ability to “visualize” progress and results of structural reforms will be critical.
◇ Stock price trends and key catalysts : Potential entry into rerating phase on structural reform progress and In-house Product expansion
As of June 2025, the Company’s stock price is hovering in the low 800-yen range, reflecting a modest decline from last year (around 870 yen). After hitting a year-to-date high of 1,075 yen in January 2025, the stock dipped to 738 yen in April. This drop was a temporary market reaction to the FY2/2025 operating profit, which declined 31.1% YoY, and was attributed to deteriorating margins and structural changes in cloud license sales.
Since then, however, the stock has rebounded on the back of progress in structural reform and the announcement of new partnerships. The current forward PER stands at 11.35x, and the actual PBR is 1.18x, placing the stock at a discounted valuation even compared to peers on the Tokyo Stock Exchange Growth Market.
The market is entering a phase of evaluating when reform outcomes will be reflected in earnings. In particular, progress in overseas expansion of in-house products and improved revenue composition are leading to a more credible margin recovery story, which is drawing attention from medium- to long-term investors. Factors contributing to this include enhanced English UI functionality, cross-selling collaboration with Miro, and concrete product portfolio expansion.
Historically, the stock has shown sensitivity to corporate developments. For example, on March 25, 2025, the Company was named a finalist in the “Atlassian Partner of the Year 2025” award (Co-Selling Excellence category), as announced on its official website and Atlassian’s blog. However, primary domestic media coverage was limited, and there was little visibility on social media. Nevertheless, the share price rose the following trading day, suggesting that the market may have interpreted the news as a positive catalyst.
To sustain an upward trend, the Company must make visible progress in increasing the revenue share of In-house Software products and demonstrating results from its Professional Services restructuring. Key triggers may include the launch of upgraded features for “D-Accel” or new global add-ons, particularly if such developments lead to upward earnings revisions or guidance. These milestones could emerge in the upcoming FY2/2026 1Q or interim earnings announcements, expected in July and October, respectively—both warrant close investor attention.
On the technical side, the 25-day and 75-day moving averages have turned upward since bottoming in April, forming a golden cross. The RSI stood at around 58 at the end of May, indicating a neutral zone with no signs of overheating. Meanwhile, the upper Bollinger Band (+1σ) is acting as a resistance level, and a decisive breakout above 850 yen could signal a new mid-term uptrend.
The Company’s stock remains conservatively valued due to its ongoing structural reform phase. However, if visibility around margin recovery and high-value service expansion improves, PER and PBR could be rerated. For institutional investors, the ability to reasonably project a return of the operating margin to the 7% level may serve as the basis for an overweight position.
With the downside proving resilient and valuation appearing modest, the stock is poised to respond to “the next move.” Quantitative, rather than qualitative, visibility into growth progress will be essential for any meaningful valuation uplift.
Company profile
A B2B company centered on Atlassian License Sales, implementation support, and profit margin enhancement through In-house Software
Ricksoft Co., Ltd. is a Tokyo-based IT solutions company established in January 2005. It is recognized as one of the leading domestic partners for Atlassian products such as Jira and Confluence. The Company was listed on the Tokyo Stock Exchange Mothers market in 2019 and had 145 employees as of the end of FY2/2025.
The Company’s business is primarily composed of three revenue streams: (1) the Technology Solutions segment, centered on Atlassian license sales; (2) the Professional Services segment, which provides system implementation and training support; and (3) the In-house Products segment, which delivers internally developed applications. These services are offered in an integrated, end-to-end B2B model, with the core client base consisting of large enterprises and mid-sized companies with in-house development divisions.
In recent years, the Company has focused on supporting migration to Atlassian Cloud products. In 2024, it revamped its dedicated support service “Support Plus” and expanded the functionality of “D-Accel,” its platform for DX promotion. In February 2025, it also entered into a reseller agreement with Miro, signaling an intention to strengthen integrations with platforms beyond Atlassian. Organizationally, the Company is supported by a three-pillar sales, engineering, and development structure. Additionally, in March 2025, it announced a business alliance with Growth xPartners, further advancing the sophistication of its service delivery framework.
Key financial data
| Unit: million yen | 2021/2 | 2022/2 | 2023/2 | 2024/2 | 2025/2 | 2026/2 CE |
| Sales | 4,431 | 4,308 | 5,623 | 7,491 | 9,044 | 10,168 |
| EBIT (Operating Income) | 602 | 437 | 547 | 666 | 459 | 411 |
| Pretax Income | 601 | 450 | 567 | 350 | 462 | 411 |
| Net Profit Attributable to Owner of Parent | 446 | 327 | 424 | 269 | 356 | 315 |
| Cash & Short-Term Investments | 1,944 | 2,089 | 3,071 | 3,158 | 3,297 | |
| Total assets | 3,180 | 2,939 | 4,577 | 5,971 | 6,687 | |
| Total Debt | 0 | 0 | 0 | 0 | 0 | |
| Net Debt | -1,944 | -2,089 | -3,071 | -3,158 | -3,297 | |
| Total liabilities | 1,279 | 684 | 2,103 | 3,203 | 3,658 | |
| Total Shareholders’ Equity | 1,901 | 2,255 | 2,474 | 2,768 | 3,029 | |
| Net Operating Cash Flow | 478 | 161 | 978 | 100 | 377 | |
| Capital Expenditure | 9 | 61 | 25 | 30 | 95 | |
| Net Investing Cash Flow | -8 | -47 | -27 | -37 | -140 | |
| Net Financing Cash Flow | 19 | 23 | 18 | 7 | -91 | |
| Free Cash Flow | 469 | 110 | 968 | 86 | 298 | |
| ROA (%) | 17.47 | 10.69 | 11.28 | 5.10 | 5.62 | |
| ROE (%) | 26.70 | 15.73 | 17.92 | 10.26 | 12.27 | |
| EPS (Yen) | 103.6 | 74.5 | 94.4 | 59.2 | 78.6 | 70.5 |
| BPS (Yen) | 436.6 | 507.2 | 547.4 | 608.3 | 676.1 | |
| Dividend per Share (Yen) | 0.00 | 0.00 | 0.00 | 0.00 | 0.00 | 0.00 |
| Shares Outstanding (Million shares) | 4.29 | 4.37 | 4.51 | 4.55 | 4.55 |
Source: Omega Investment from company data, rounded to the nearest whole number.
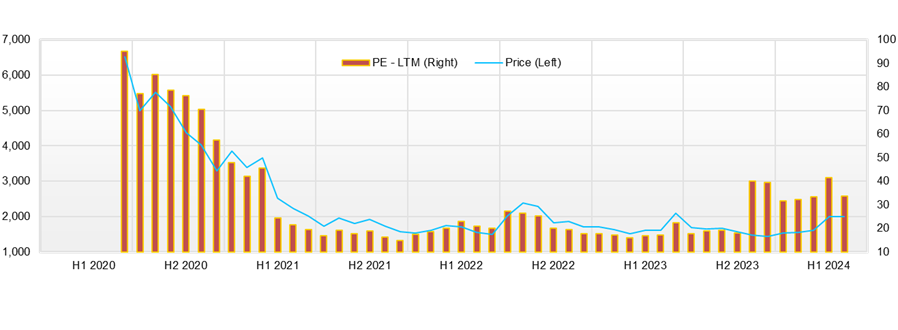
Share price
Financial data (quarterly basis)
| Unit: million yen | 2024/2 | 2025/2 | ||||||
| 1Q | 2Q | 3Q | 4Q | 1Q | 2Q | 3Q | 4Q | |
| (Income Statement) | ||||||||
| Sales | 1,572 | 1,907 | 1,819 | 2,193 | 2,047 | 2,263 | 2,289 | 2,445 |
| Year-on-year | 0.6% | 62.5% | 50.3% | 30.8% | 30.2% | 18.7% | 25.8% | 11.5% |
| Cost of Goods Sold (COGS) | 1,056 | 1,383 | 1,258 | 1,553 | 1,429 | 1,703 | 1,711 | 1,826 |
| Gross Income | 515 | 525 | 561 | 641 | 617 | 560 | 577 | 619 |
| Gross Income Margin | 32.8% | 27.5% | 30.9% | 29.2% | 30.2% | 24.7% | 25.2% | 25.3% |
| SG&A Expense | 369 | 379 | 415 | 413 | 470 | 485 | 493 | 468 |
| EBIT (Operating Income) | 146 | 145 | 146 | 228 | 148 | 76 | 84 | 151 |
| Year-on-year | -13.2% | 30.7% | 37.0% | 42.0% | 0.7% | -48.0% | -42.3% | -33.5% |
| Operating Income Margin | 9.3% | 7.6% | 8.0% | 10.4% | 7.2% | 3.3% | 3.7% | 6.2% |
| EBITDA | 152 | 151 | 153 | 235 | 155 | 83 | 97 | 167 |
| Pretax Income | 145 | -209 | 179 | 236 | 155 | 77 | 85 | 145 |
| Consolidated Net Income | 103 | -142 | 131 | 177 | 115 | 62 | 68 | 111 |
| Minority Interest | 0 | 0 | 0 | 0 | 0 | 0 | 0 | 0 |
| Net Income ATOP | 103 | -142 | 131 | 177 | 115 | 62 | 68 | 111 |
| Year-on-year | -22.7% | -262.0% | 69.3% | 40.8% | 11.9% | -143.6% | -48.5% | -37.3% |
| Net Income Margin | 6.5% | -7.4% | 7.2% | 8.1% | 5.6% | 2.7% | 3.0% | 4.5% |
| (Balance Sheet) | ||||||||
| Cash & Short-Term Investments | 2,821 | 2,838 | 3,047 | 3,158 | 3,375 | 3,442 | 3,192 | 3,297 |
| Total assets | 4,983 | 4,788 | 5,830 | 5,971 | 6,291 | 6,588 | 6,004 | 6,687 |
| Total Debt | 0 | 0 | 0 | 0 | 0 | 0 | 0 | 0 |
| Net Debt | -2,821 | -2,838 | -3,047 | -3,158 | -3,375 | -3,442 | -3,192 | -3,297 |
| Total liabilities | 2,396 | 2,336 | 3,246 | 3,203 | 3,398 | 3,661 | 3,083 | 3,658 |
| Total Shareholders’ Equity | 2,588 | 2,452 | 2,585 | 2,768 | 2,893 | 2,927 | 2,921 | 3,029 |
| (Profitability %) | ||||||||
| ROA | 9.20 | 3.88 | 4.47 | 5.10 | 4.99 | 8.53 | 7.12 | 5.62 |
| ROE | 16.57 | 6.96 | 8.83 | 10.26 | 10.26 | 18.03 | 15.31 | 12.27 |
| (Per-share) Unit: JPY | ||||||||
| EPS | 22.7 | -31.2 | 28.8 | 38.9 | 25.3 | 13.6 | 15.1 | 24.8 |
| BPS | 568.7 | 538.9 | 568.0 | 608.3 | 635.7 | 643.9 | 652.0 | 676.1 |
| Dividend per Share | 0.00 | 0.00 | 0.00 | 0.00 | 0.00 | 0.00 | 0.00 | 0.00 |
| Shares Outstanding (million shrs) |
4.54 | 4.55 | 4.55 | 4.55 | 4.55 | 4.55 | 4.55 | 4.55 |
Source: Omega Investment from company materials
Financial data (full-year basis)
| Unit: million yen | 2020/2 | 2021/2 | 2022/2 | 2023/2 | 2024/2 | 2025/2 |
| (Income Statement) | ||||||
| Sales | 3,089 | 4,431 | 4,308 | 5,623 | 7,491 | 9,044 |
| Year-on-year | 24.4% | 43.5% | -2.8% | 30.5% | 33.2% | 20.7% |
| Cost of Goods Sold | 1,904 | 2,868 | 2,779 | 3,759 | 5,249 | 6,670 |
| Gross Income | 1,184 | 1,563 | 1,529 | 1,864 | 2,242 | 2,374 |
| Gross Income Margin | 38.3% | 35.3% | 35.5% | 33.1% | 29.9% | 26.2% |
| SG&A Expense | 782 | 961 | 1,091 | 1,317 | 1,576 | 1,915 |
| EBIT (Operating Income) | 402 | 602 | 437 | 547 | 666 | 459 |
| Year-on-year | 8.3% | 49.6% | -27.3% | 25.0% | 21.7% | -31.1% |
| Operating Income Margin | 13.0% | 13.6% | 10.2% | 9.7% | 8.9% | 5.1% |
| EBITDA | 416 | 617 | 467 | 566 | 691 | 502 |
| Pretax Income | 403 | 601 | 450 | 567 | 350 | 462 |
| Consolidated Net Income | 289 | 446 | 327 | 424 | 269 | 356 |
| Minority Interest | 0 | 0 | 0 | 0 | 0 | 0 |
| Net Income ATOP | 289 | 446 | 327 | 424 | 269 | 356 |
| Year-on-year | 13.0% | 54.3% | -26.7% | 29.7% | -36.5% | 32.2% |
| Net Income Margin | 9.4% | 10.1% | 7.6% | 7.5% | 3.6% | 3.9% |
| (Balance Sheet) | ||||||
| Cash & Short-Term Investments | 1,458 | 1,944 | 2,089 | 3,071 | 3,158 | 3,297 |
| Total assets | 1,922 | 3,180 | 2,939 | 4,577 | 5,971 | 6,687 |
| Total Debt | 0 | 0 | 0 | 0 | 0 | 0 |
| Net Debt | -1,458 | -1,944 | -2,089 | -3,071 | -3,158 | -3,297 |
| Total liabilities | 484 | 1,279 | 684 | 2,103 | 3,203 | 3,658 |
| Total Shareholders’ Equity | 1,437 | 1,901 | 2,255 | 2,474 | 2,768 | 3,029 |
| (Cash Flow) | ||||||
| Net Operating Cash Flow | 316 | 478 | 161 | 978 | 100 | 377 |
| Capital Expenditure | 13 | 9 | 61 | 25 | 30 | 95 |
| Net Investing Cash Flow | -43 | -8 | -47 | -27 | -37 | -140 |
| Net Financing Cash Flow | 152 | 19 | 23 | 18 | 7 | -91 |
| Free Cash Flow | 303 | 469 | 110 | 968 | 86 | 298 |
| (Profitability %) | ||||||
| ROA | 16.97 | 17.47 | 10.69 | 11.28 | 5.10 | 5.62 |
| ROE | 23.80 | 26.70 | 15.73 | 17.92 | 10.26 | 12.27 |
| Net profit margin | 9.35 | 10.06 | 7.59 | 7.54 | 3.59 | 3.93 |
| Asset turnover ratio | 1.81 | 1.74 | 1.41 | 1.50 | 1.42 | 1.43 |
| Financial leverage | 1.40 | 1.53 | 1.47 | 1.59 | 2.01 | 2.18 |
| (Per-share) Unit: JPY | ||||||
| EPS | 68.5 | 103.6 | 74.5 | 94.4 | 59.2 | 78.6 |
| BPS | 336.0 | 436.6 | 507.2 | 547.4 | 608.3 | 676.1 |
| Dividend per Share | 0.00 | 0.00 | 0.00 | 0.00 | 0.00 | 0.00 |
| Shares Outstanding (million shrs) | 4.20 | 4.29 | 4.37 | 4.51 | 4.55 | 4.55 |
Source: Omega Investment from company materials