2026-06-25
Home
Japanese

Omega Investment Co., Ltd.
Kidswell Bio (Company note – 4Q update)

| Share price (6/27) | ¥286 | Dividend Yield (26/3 CE) | – % |
| 52weeks high/low | ¥88/417 | ROE(25/3 act) | -1.5 % |
| Avg Vol (3 month) | 5,332 thou shrs | Operating margin (25/3 act) | 0.5 % |
| Market Cap | ¥13.6 bn | Beta (5Y Monthly) | 0.94 |
| Enterprise Value | ¥12.8 bn | Shares Outstanding | 47.627 mn shrs |
| PER (26/3 CE) | – X | Listed market | TSE Growth |
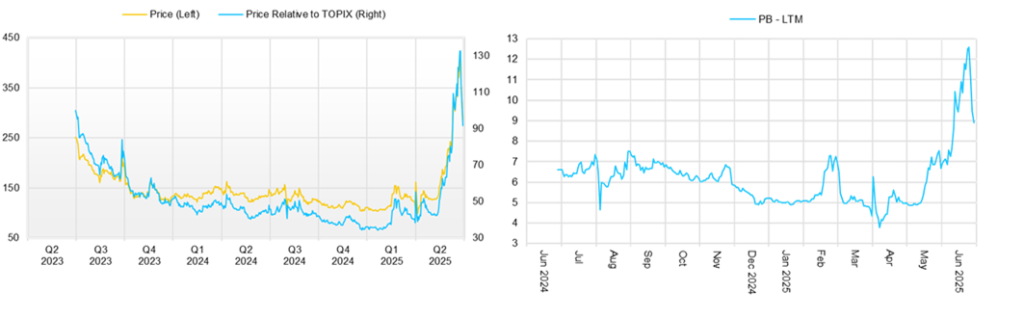
| PBR (25/3 act) | 9.3 X |
| Click here for the PDF version of this page |
| PDF version |
First-ever operating and ordinary profit since listing; despite forecasting a loss for FY2026/3, the Company lays the groundwork for sustained profitability and strengthening of drug discovery capabilities
◇ FY2025/3 full-year earnings highlights: Outperformed final company forecast; achieved first-ever operating and ordinary profit since listing
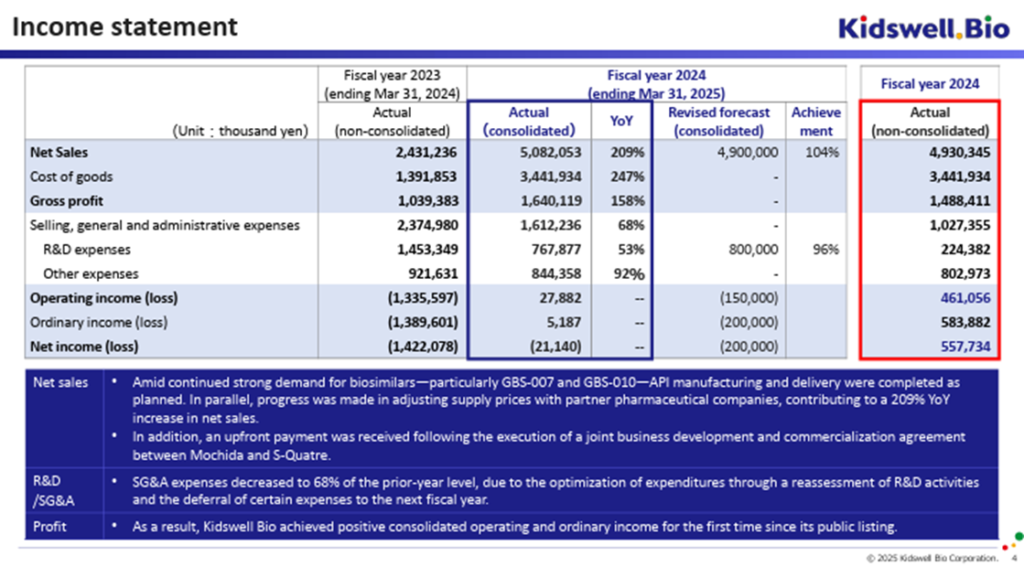
On May 13, 2025, the company announced its consolidated financial results for the fiscal year ended March 2025. On a cumulative basis, net sales were 5.08 billion yen, operating profit was 27 million yen, ordinary profit was 5 million yen, and net loss attributable to owners of the parent was 21 million yen, marking the company’s first-ever operating and ordinary profit since its listing. These results also exceeded the company’s forecast announced on March 31, 2025 (which projected sales of 4.90 billion yen, an operating loss of 150 million yen, an ordinary loss of 200 million yen, and a net loss of 200 million yen).
Compared to the previous fiscal year, revenue from the Biosimilar business nearly doubled. This was driven by strong demand for the company’s products, especially GBS-007 and GBS-010, the successful completion of API manufacturing and delivery as scheduled, and progress in adjusting supply prices with partner pharmaceutical companies. Furthermore, the company received an upfront payment from Mochida Pharmaceutical under a co-development agreement for GCT-103, a regenerative medicine product for cerebral palsy currently under development by its subsidiary, S-Quatre. In addition to these revenue drivers, the optimization of R&D expenses and the deferral of certain cost to the next fiscal year contributed to the achievement of operating and ordinary profitability. However, the bottom-line net income remained negative due to increased tax expenses associated with the expansion of biosimilar business profitability. The outperformance versus the prior forecast was mainly attributable to more favorable-than-expected adjustments in supply prices with partner pharmaceutical companies.
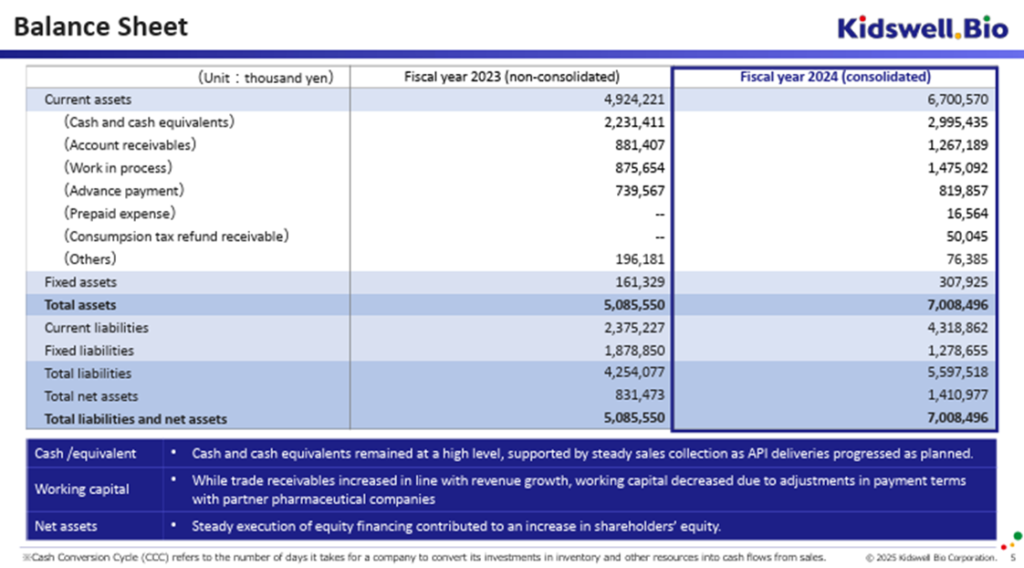
There was also progress on the balance sheet. Although revenue increased, the company significantly compressed working capital (by over 1.9 billion yen, according to the company), and the exercise of stock acquisition rights progressed smoothly, resulting in net cash of 1.15 billion yen as of the end of March 2025. Concerns about the overhang of potential shares have also eased (as of the end of May 2025, the number of shares outstanding stood at 47.6 million, with approximately 4.2 million potential shares estimated to remain).
Progress in each business segment will be detailed in the following sections.
◇ FY2026/3 full-year forecast: operating loss expected again, but improved from previous forecast
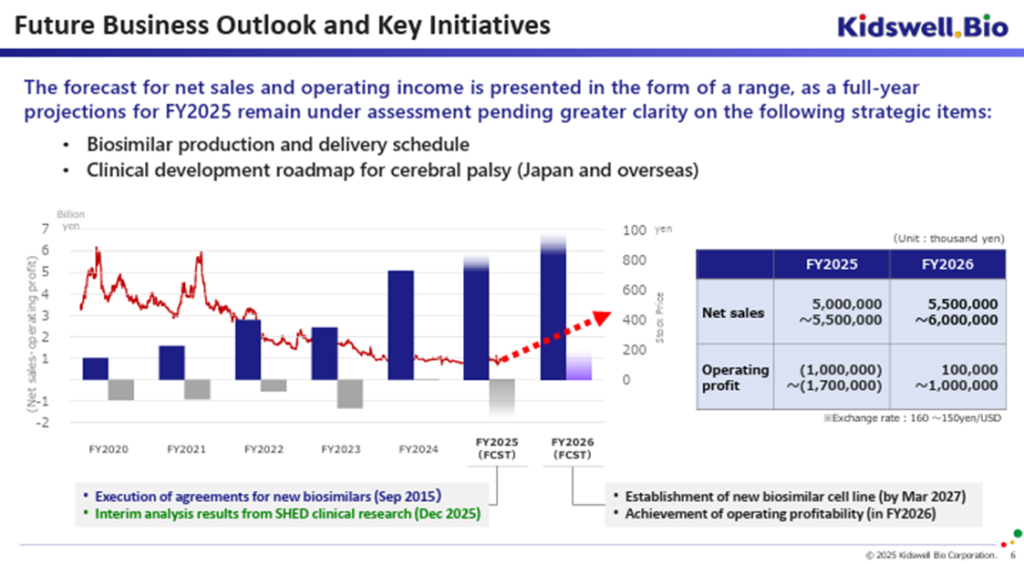
The full-year earnings forecast for FY2026/3 assumes an exchange rate of 160–150 yen per USD and includes only the contributions from existing biosimilar products. Based on this, the company projects net sales of 5.0–5.5 billion yen and an operating loss of 1.0–1.7 billion yen. Compared to the forecast announced on February 12, 2025 (which projected net sales of 4.5–5.0 billion yen and an operating loss of 1.0–2.0 billion yen), the sales projection has been raised, and the upper bound of the projected operating loss has improved.
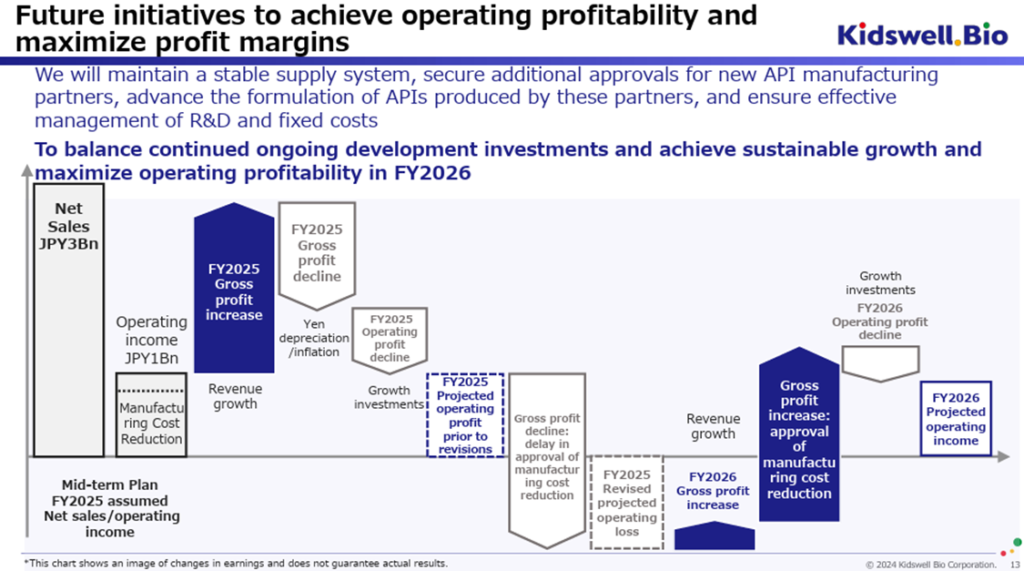
Compared to FY2025/3, revenue from biosimilars – primarily GBS-007 and GBS-010 – will continue expanding steadily. However, in terms of profit, the company anticipates an operating loss due to several factors: the prioritization of stable procurement from existing contract manufacturers in the current fiscal year; continued investments in cost-reduction initiatives in the biosimilar business; ongoing investment in clinical development for cerebral palsy in the cell therapy business; and increased expenses overall due to the breadth of these initiatives. In addition, further depreciation of the yen or rising overseas inflation beyond expectations could increase foreign-denominated payments when converted to yen.
Thus, although profitability is expected to decline again in FY2026/3, the forecast reflects a firm management intention to advance essential initiatives without allowing profits to fall below a certain threshold. It is worth noting that new license agreements could provide upside, and that yen appreciation would be a positive factor for earnings.
◇ FY2027/3 full-year forecast: Outlook for operating profitability remains unchanged
The full-year earnings forecast for FY2027/3 assumes an exchange rate of 160–150 yen per USD, with projected sales based on the continued growth of the biosimilar business. Net sales are forecast to be 5.5–6.0 billion yen, and operating profit is expected to be 100 million yen to 1.0 billion yen. This is consistent with the previously disclosed figures and reflects the expectation that the company will return to operating profitability primarily through improved cost of sales enabled by transitioning to a new contract development and manufacturing organization (CDMO) for biosimilars.
Since the new CDMO has already received approval from the Pharmaceuticals and Medical Devices Agency (PMDA), the company expects that the benefits of stable biosimilar supply and lower production costs will materialize during FY2027/3.
◇ Biosimilar Business: Laying the groundwork for growth following sustained profitability
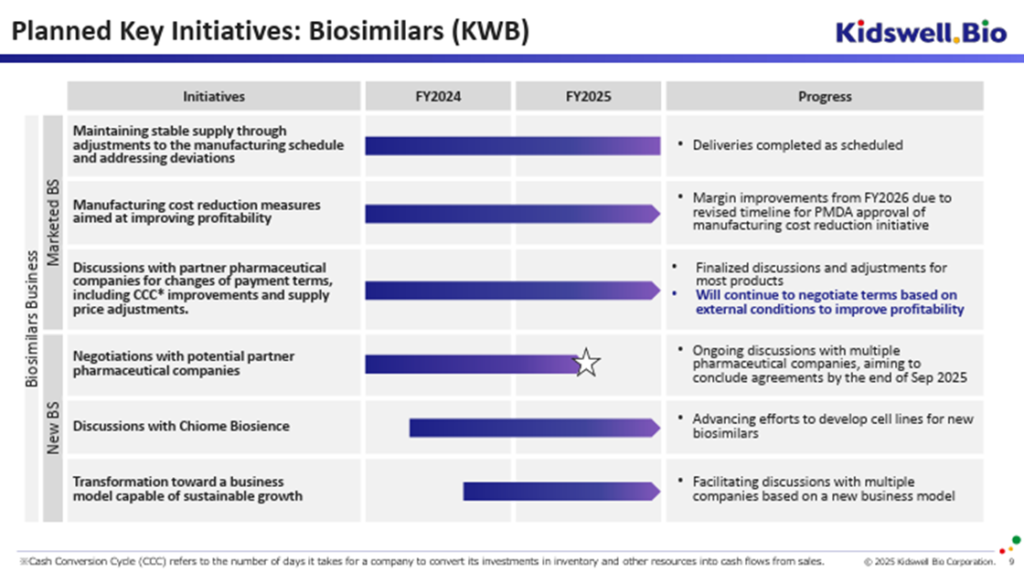
The biosimilar business is a key pillar of its future stable growth, as it leverages its strengths in an expanding market. Despite facing headwinds such as yen depreciation and overseas inflation, the company continues to post operating profit. It has delivered tangible results in supply chain management, working capital management, and profitability improvement, and these initiatives are expected to continue going forward. The company is also engaging in discussions with pharmaceutical companies, including overseas partners, to establish joint development agreements for new biosimilar products and to sign contracts by the end of September 2025, consistent with its previous announcements.
Recent developments in this area are as follows:
First, as mentioned earlier, the company has received PMDA approval for adding a new contract development and manufacturing organization (CDMO) that will contribute to cost reduction in FY2027/3.
Second, the company, in partnership with Alfresa Holdings and Chiome Bioscience, applied for and was selected as a grant recipient under the Ministry of Health, Labour and Welfare’s “Subsidy Program for the Development of Domestic Biosimilar Manufacturing Facilities.” As a result, the company will take an active role in a domestic supply chain to ensure the stable supply of biosimilars in Japan. Construction of the domestic manufacturing facility is scheduled to begin by the end of March 2026.
Third, the company entered into a Master Service Agreement with Taiwan-based Mycenax, a highly experienced CDMO for biopharmaceuticals, and with Chiome Bioscience, to initiate the development of cell lines for new biosimilar products. After the domestic manufacturing facility is completed, the manufacturing processes developed by Mycenax will be transferred to the facility to bring it into operation, thereby establishing a stable domestic supply system. The Company has also hinted at the potential for future overseas exports.
◇ Status of Cell Therapy Business development: Steady progress
The latest updates on the cell therapy business (regenerative medicine) are as follows:
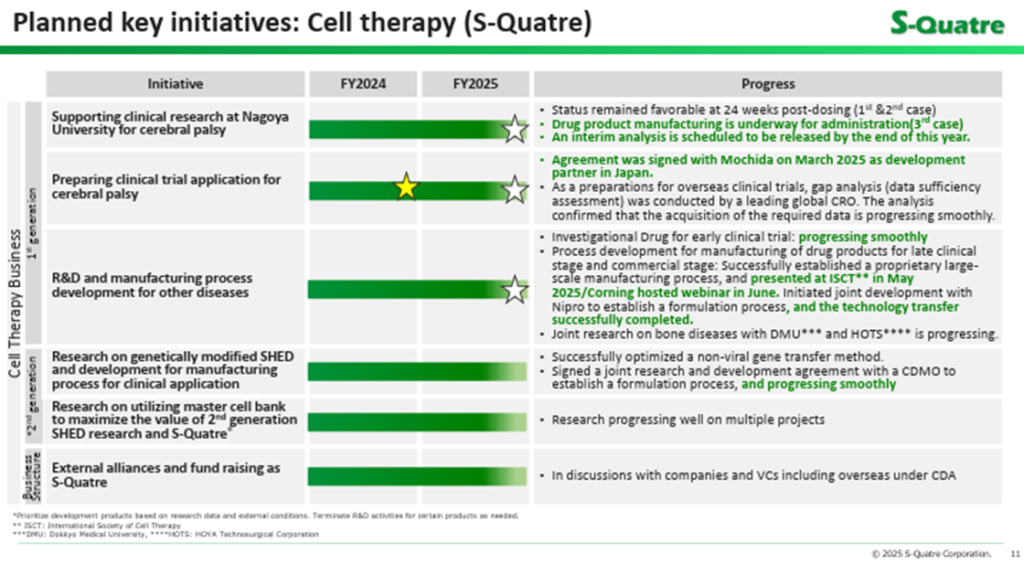
First, the clinical research on autologous SQ-SHED for pediatric cerebral palsy, led by Nagoya University, has been progressing smoothly, despite a slight delay. The administration of SQ-SHED and subsequent observation for the first and second patients are ongoing, while the investigational product for the third patient is being manufactured. The interim analysis results, expected initially around September 2025, are now projected to be announced by Nagoya University within year 2025.
Second, preparations are underway for corporate clinical trials in Japan targeting pediatric cerebral palsy using the company’s established master cell bank (MCB) for allogeneic (non-autologous) SQ-SHED. The company signed a co-development agreement with Mochida Pharmaceutical in FY2025/3 and reiterated its intention to submit a clinical trial plan through Mochida at an early stage. In addition, efforts toward overseas clinical development for pediatric cerebral palsy are ongoing. The company has commissioned an overseas contract research organization (CRO) to evaluate the adequacy of its preclinical data, its formulation and manufacturing process under development, and its future trial plans. The CRO has confirmed that the necessary data acquisition and process development are proceeding smoothly.
Third, there have been updates on manufacturing technology. The company has conducted pilot manufacturing of early-stage investigational formulations, successfully developed a proprietary large-scale culture method for use in late-stage clinical trials and commercialization, and presented these achievements at the International Society for Cell & Gene Therapy (ISCT) held in the U.S. in May 2025. Furthermore, the company is scheduled to present the technology in a June webinar hosted by its collaborator, Corning. A joint development agreement for applying this technology to late-stage clinical trials and commercial manufacturing has also been signed with NIPRO Corporation, and the technology transfer from S-Quatre Corporation has been completed.
◇ Stock price trends and key points to watch
The company’s stock price had been on a prolonged downward trend but began to rebound in February 2025. Following the earnings announcement, the stock surged from around 130 yen to 242 yen and has generally remained at that level.
This performance can be attributed to several factors: the company recorded operating and ordinary profit in FY2025/3 for the first time; although a return to operating loss is expected in the FY2026/3 forecast, the projected loss is smaller than previously anticipated; approval was obtained from the PMDA for the addition of a new contract development and manufacturing organization (CDMO) in the biosimilar business, raising expectations for a return to profitability in FY2027/3; multidimensional enhancements in the biosimilar business strengthened expectations for stable, profitable growth; the conclusion of a partnership agreement with Mochida Pharmaceutical in the cell therapy business increased confidence in the company’s drug discovery potential; and the smooth exercise of stock acquisition rights and conversion of convertible bonds alleviated concerns over future stock dilution.
Overall, the capital market’s perception of the company appears to be shifting toward the following: a transition of the biosimilar business into a stable growth and cash-cow phase; increasing recognition of the drug discovery potential in the cell therapy business; and a reduction in dilution-related concerns. Based on this view, the near-term key focus points are:
- Operational status of the current biosimilar supply chain
- Trends in exchange rates and overseas inflation
- Concrete cost improvements from switching to the new CDMO for biosimilars
- Signing of co-development agreements for new biosimilars (by the end of September 2025, including with overseas pharma companies)
- Announcement of interim analysis results from the Nagoya University-led clinical research on SQ-SHED (within year 2025)
- Start of construction of domestic biosimilar manufacturing facilities (by the end of March 2026)
- Submission of clinical trial plan for domestic trials targeting pediatric cerebral palsy, in collaboration with Mochida Pharmaceutical
- Completion of equity dilution events
- Evidence regarding the business value of S-Quatre Corporation
Company profile
Kidswell Bio Corporation (hereinafter, “the company”) is a drug discovery venture company originating from Hokkaido University. In FY2025/3, the company restructured its operations: the standalone entity now focuses primarily on the biosimilar business, while the newly established wholly owned subsidiary, S-Quatre Corporation, has taken charge of the cell therapy (regenerative medicine) business, specifically the development of SHED (Stem cells from Human Exfoliated Deciduous teeth). This restructuring allows the company to visualize the value of the two business segments and to implement optimal financial strategies tailored to each.
In the Biosimilar business, the company has obtained approval for four products currently being supplied. The company plans to switch to a new contract development and manufacturing organization (CDMO) to enhance supply stability and reduce production costs. Additionally, the company is actively pursuing the development of new biosimilars, the acquisition of new partner agreements, and the establishment of domestic manufacturing facilities to grow the business into a stable revenue generator.
In the Cell therapy business using SHED (Stem cells from Human Exfoliated Deciduous teeth), clinical research on autologous SQ-SHED targeting pediatric cerebral palsy, led by Nagoya University, has already commenced. The company is also preparing for corporate clinical trials using allogeneic (non-autologous) SQ-SHED for the same indication in Japan, including manufacturing preparations and consultations with the PMDA. A development partnership agreement with Mochida Pharmaceutical was signed in March 2025. At the same time, the company is advancing research on manufacturing process development, other disease indications, and next-generation SQ-SHED technologies.
Although the company recorded operating and ordinary profit in FY2025/3, it aims to achieve consolidated operating profitability again in FY2027/3.
Key financial data
| Unit: million yen | 2021/3 | 2022/3 | 2023/3 | 2024/3 | 2025/3 | 2026/3CE |
| Sales | 997 | 1,569 | 2,776 | 2,431 | 5,082 | 5,000 ~5,500 |
| EBIT (Operating Income) | -970 | -976 | -551 | -1,336 | 28 | -1,000 ~-1,700 |
| Pretax Income | -1,000 | -550 | -656 | -1,421 | 73 | |
| Net Profit Attributable to Owner of Parent | -1,001 | -551 | -657 | -1,422 | -21 | |
| Cash & Short-Term Investments | 1,461 | 1,161 | 1,067 | 2,231 | 2,995 | |
| Total assets | 3,934 | 3,470 | 3,895 | 5,086 | 7,008 | |
| Total Debt | 1,100 | 700 | 1,950 | 2,575 | 1,838 | |
| Net Debt | -361 | -461 | 883 | 344 | -1,157 | |
| Total liabilities | 2,324 | 1,767 | 2,661 | 4,254 | 5,598 | |
| Total Shareholders’ Equity | 1,610 | 1,703 | 1,234 | 831 | 1,411 | |
| Net Operating Cash Flow | -1,267 | -1,170 | -1,421 | -454 | 937 | |
| Net Investing Cash Flow | -22 | 527 | -29 | 0 | 65 | |
| Net Financing Cash Flow | 718 | 369 | 1,356 | 1,618 | -240 | |
| Unit: million yen | -26.61 | -14.88 | -17.85 | -31.67 | -0.35 | |
| Sales | -64.66 | -33.25 | -44.78 | -137.73 | -1.89 | |
| EBIT (Operating Income) | -34.8 | -17.9 | -20.8 | -40.2 | -0.5 | |
| Pretax Income | 54.4 | 54.2 | 38.5 | 21.4 | 32.2 | |
| Net Profit Attributable to Owner of Parent | 0.00 | 0.00 | 0.00 | 0.00 | 0.00 | 0.00 |
| Cash & Short-Term Investments | 29.06 | 31.44 | 31.90 | 37.31 | 40.66 |
Source: Omega Investment from company data, rounded to the nearest whole number.
Share price
Quarterly topics
Full year earnings results
Source: Company materials
Balance sheet
Source: Company materials
Business progress topics
Progress of the Biosimilar business
Source: Company materials
Progress of the Cell Therapy business
Source: Company materials
Outlook through FY2026 and anticipated business milestones
Outlook for FY2026/3 and FY2027/3
Source: Company materials
Projected changes in operating profit
Source: Company materials
Financial data (quarterly basis)
| Unit: million yen | 2023/3 | 2024/3 | 2025/3 | ||||||
| 4Q | 1Q | 2Q | 3Q | 4Q | 1Q | 2Q | 3Q | 4Q | |
| (Income Statement) | |||||||||
| Sales | 1,049 | 46 | 536 | 985 | 864 | 483 | 1,267 | 1,286 | 2,046 |
| Year-on-year | 464.2% | -92.5% | 6.1% | 61.3% | -17.6% | 950.4% | 136.4% | 30.6% | 136.6% |
| Cost of Goods Sold (COGS) | 597 | 1 | 351 | 352 | 688 | 259 | 998 | 748 | 1,436 |
| Gross Income | 453 | 45 | 185 | 633 | 176 | 224 | 269 | 538 | 610 |
| Gross Income Margin | 43.2% | 98.1% | 34.5% | 64.3% | 20.4% | 46.3% | 21.2% | 41.8% | 29.8% |
| SG&A Expense | 868 | 500 | 449 | 580 | 845 | 383 | 372 | 414 | 444 |
| EBIT (Operating Income) | -415 | -455 | -265 | 53 | -669 | -159 | -104 | 125 | 166 |
| Year-on-year | 90.4% | 1097.7% | -638.6% | -135.9% | 60.9% | -65.1% | -60.9% | 136.8% | -124.8% |
| Operating Income Margin | -39.6% | -989.7% | -49.4% | 5.3% | -77.3% | -32.9% | -8.2% | 9.7% | 8.1% |
| EBITDA | -415 | -455 | -264 | 53 | -668 | -159 | -103 | 125 | 166 |
| Pretax Income | -462 | -470 | -309 | 35 | -676 | -176 | -65 | 107 | 207 |
| Consolidated Net Income | -463 | -471 | -310 | 33 | -675 | -177 | -65 | 54 | 167 |
| Minority Interest | 0 | 0 | 0 | 0 | 0 | 0 | 0 | 0 | 0 |
| Net Income ATOP | -463 | -471 | -310 | 33 | -675 | -177 | -65 | 54 | 167 |
| Year-on-year | 1.3% | 481.4% | -909.1% | -121.6% | 45.9% | -62.5% | -79.0% | 64.4% | -124.7% |
| Net Income Margin | -44.1% | -1023.6% | -57.8% | 3.3% | -78.0% | -36.6% | -5.1% | 4.2% | 8.1% |
| (Balance Sheet) | |||||||||
| Cash & Short-Term Investments | 1,067 | 625 | 622 | 2,187 | 2,231 | 1,167 | 1,695 | 1,318 | 2,995 |
| Total assets | 3,895 | 3,044 | 3,194 | 5,199 | 5,086 | 4,609 | 4,646 | 4,575 | 7,008 |
| Total Debt | 1,950 | 1,850 | 1,775 | 2,275 | 2,575 | 2,402 | 2,131 | 2,034 | 1,838 |
| Net Debt | 883 | 1,225 | 1,153 | 88 | 344 | 1,235 | 436 | 715 | -1,157 |
| Total liabilities | 2,661 | 2,276 | 2,119 | 3,755 | 4,254 | 3,895 | 3,789 | 3,523 | 5,598 |
| Total Shareholders’ Equity | 1,234 | 769 | 1,075 | 1,444 | 831 | 714 | 857 | 1,052 | 1,411 |
| (Profitability %) | |||||||||
| ROA | -17.85 | -28.50 | -37.43 | -25.82 | -31.67 | -29.48 | -22.54 | -17.65 | -0.35 |
| ROE | -44.78 | -86.81 | -100.55 | -77.27 | -137.73 | -152.15 | -91.46 | -69.11 | -1.89 |
| (Per-share) Unit: JPY | |||||||||
| EPS | -14.4 | -14.7 | -9.3 | 0.9 | -17.5 | -4.5 | -1.6 | 1.3 | 4.2 |
| BPS | 38.5 | 24.0 | 30.0 | 37.6 | 21.4 | 18.1 | 21.1 | 25.9 | 32.2 |
| Dividend per Share | 0.00 | 0.00 | 0.00 | 0.00 | 0.00 | 0.00 | 0.00 | 0.00 | 0.00 |
| Shares Outstanding(million shares) | 32.06 | 32.06 | 37.09 | 37.31 | 38.43 | 39.41 | 40.66 | 40.66 | 43.88 |
Source: Omega Investment from company materials
Financial data (full-year basis)
| Unit: million yen | 2015/3 | 2016/3 | 2017/3 | 2018/3 | 2019/3 | 2020/3 | 2021/3 | 2022/3 | 2023/3 | 2024/3 | 2025/3 |
| (Income Statement) | |||||||||||
| Sales | 61 | 1,161 | 1,089 | 1,060 | 1,022 | 1,078 | 997 | 1,569 | 2,776 | 2,431 | 5,082 |
| Year-on-year | -79.9% | 1817.7% | -6.2% | -2.7% | -3.6% | 5.5% | -7.5% | 57.5% | 76.9% | -12.4% | 109.0% |
| Cost of Goods Sold | 15 | 501 | 398 | 423 | 413 | 653 | 120 | 553 | 1,251 | 1,393 | 3,443 |
| Gross Income | 45 | 660 | 692 | 637 | 609 | 425 | 877 | 1,017 | 1,525 | 1,038 | 1,639 |
| Gross Income Margin | 74.5% | 56.9% | 63.5% | 60.1% | 59.6% | 39.4% | 88.0% | 64.8% | 54.9% | 42.7% | 32.3% |
| SG&A Expense | 403 | 1,480 | 1,876 | 1,551 | 1,414 | 1,586 | 1,847 | 1,992 | 2,076 | 2,374 | 1,611 |
| EBIT (Operating Income) | -358 | -820 | -1,184 | -913 | -806 | -1,161 | -970 | -976 | -551 | -1,336 | 28 |
| Year-on-year | -30.1% | 129.1% | 44.4% | -22.9% | -11.8% | 44.2% | -16.5% | 0.6% | -43.5% | 142.4% | -102.1% |
| Operating Income Margin | -591.6% | -70.7% | -108.7% | -86.2% | -78.8% | -107.8% | -97.3% | -62.2% | -19.8% | -54.9% | 0.5% |
| EBITDA | -358 | -820 | -1,184 | -913 | -805 | -1,161 | -969 | -973 | -550 | -1,335 | 29 |
| Pretax Income | -374 | -786 | -1,222 | -903 | -854 | -7,314 | -1,000 | -550 | -656 | -1,421 | 73 |
| Consolidated Net Income | -377 | -788 | -1,225 | -905 | -856 | -7,316 | -1,001 | -551 | -657 | -1,422 | -21 |
| Minority Interest | 0 | 0 | 0 | 0 | 0 | 0 | 0 | 0 | 0 | 0 | 0 |
| Net Income ATOP | -377 | -788 | -1,225 | -905 | -856 | -7,316 | -1,001 | -551 | -657 | -1,422 | -21 |
| Year-on-year | -27.4% | 108.9% | 55.5% | -26.1% | -5.3% | 754.4% | -86.3% | -45.0% | 19.3% | 116.3% | -98.5% |
| Net Income Margin | -622.9% | -67.9% | -112.4% | -85.4% | -83.8% | -678.9% | -100.5% | -35.1% | -23.7% | -58.5% | -0.4% |
| (Balance Sheet) | |||||||||||
| Cash & Short-Term Investments | 887 | 817 | 2,380 | 1,891 | 2,009 | 2,033 | 1,461 | 1,161 | 1,067 | 2,231 | 2,995 |
| Total assets | 922 | 1,694 | 3,706 | 3,025 | 3,151 | 3,592 | 3,934 | 3,470 | 3,895 | 5,086 | 7,008 |
| Total Debt | 0 | 810 | 0 | 0 | 0 | 1,225 | 1,100 | 700 | 1,950 | 2,575 | 1,838 |
| Net Debt | -887 | -7 | -2,380 | -1,891 | -2,009 | -808 | -361 | -461 | 883 | 344 | -1,157 |
| Total liabilities | 34 | 1,291 | 206 | 421 | 420 | 2,105 | 2,324 | 1,767 | 2,661 | 4,254 | 5,598 |
| Total Shareholders’ Equity | 888 | 403 | 3,500 | 2,604 | 2,731 | 1,487 | 1,610 | 1,703 | 1,234 | 831 | 1,411 |
| (Cash Flow) | |||||||||||
| Net Operating Cash Flow | -305 | -607 | -1,759 | -438 | -860 | -1,325 | -1,267 | -1,170 | -1,421 | -454 | 937 |
| Capital Expenditure | 0 | 2 | 0 | 0 | 0 | 2 | 3 | 0 | 0 | 0 | 6 |
| Net Investing Cash Flow | -0 | -122 | -150 | -50 | -0 | -137 | -22 | 527 | -29 | 0 | 65 |
| Net Financing Cash Flow | 907 | 947 | 3,472 | 0 | 978 | 1,222 | 718 | 369 | 1,356 | 1,618 | -240 |
| (Profitability %) | |||||||||||
| ROA | -26.84 | -60.21 | -45.35 | -26.88 | -27.73 | -216.99 | -26.61 | -14.88 | -17.85 | -31.67 | -0.35 |
| ROE | -38.85 | -122.00 | -62.74 | -29.64 | -32.10 | -346.86 | -64.66 | -33.25 | -44.78 | -137.73 | -1.89 |
| Net profit margin | -622.87 | -67.85 | -112.41 | -85.36 | -83.81 | -678.87 | -100.49 | -35.10 | -23.68 | -58.49 | -0.42 |
| Asset turnover ratio | 0.04 | 0.89 | 0.40 | 0.31 | 0.33 | 0.32 | 0.26 | 0.42 | 0.75 | 0.54 | 0.84 |
| Financial leverage | 1.45 | 2.03 | 1.38 | 1.10 | 1.16 | 1.60 | 2.43 | 2.23 | 2.51 | 4.35 | 5.39 |
| (Per-share) Unit: JPY | |||||||||||
| EPS | -59.6 | -75.7 | -68.5 | -47.3 | -43.8 | -264.7 | -34.8 | -17.9 | -20.8 | -40.2 | -0.5 |
| BPS | 106.7 | 34.9 | 182.9 | 136.1 | 134.3 | 53.8 | 54.4 | 54.2 | 38.5 | 21.4 | 32.2 |
| Dividend per Share | 0.00 | 0.00 | 0.00 | 0.00 | 0.00 | 0.00 | 0.00 | 0.00 | 0.00 | 0.00 | 0.00 |
| Shares Outstanding (million shrs) | 9.54 | 10.85 | 18.74 | 19.14 | 19.68 | 27.65 | 29.06 | 31.44 | 31.90 | 37.31 | 40.66 |
Source: Omega Investment from company materials