2026-06-19
Home
Japanese

Omega Investment Co., Ltd.
Sansei Landic (Company note – 1Q update)

| Share price (6/30) | ¥1,096 | Dividend Yield (25/12 CE) | 3.8 % |
| 52weeks high/low | ¥834/1,180 | ROE(24/12 act) | 8.5 % |
| Avg Vol (3 month) | 18.8 thou shrs | Operating margin (24/12 act) | 7.3 % |
| Market Cap | ¥9.41 bn | Beta (5Y Monthly) | 0.18 |
| Enterprise Value | ¥22.43 bn | Shares Outstanding | 8.584 mn shrs |
| PER (25/12 CE) | 8.5 X | Listed market | TSE Standard |
| PBR (24/12 act) | 0.7 X |
| Click here for the PDF version of this page |
| PDF version |
Solid start in 1Q FY12/2025 with higher revenue and profit
◇ Highlights of 1Q FY12/2025 results: Smooth start with increased revenue and profits, mainly in terms of profits
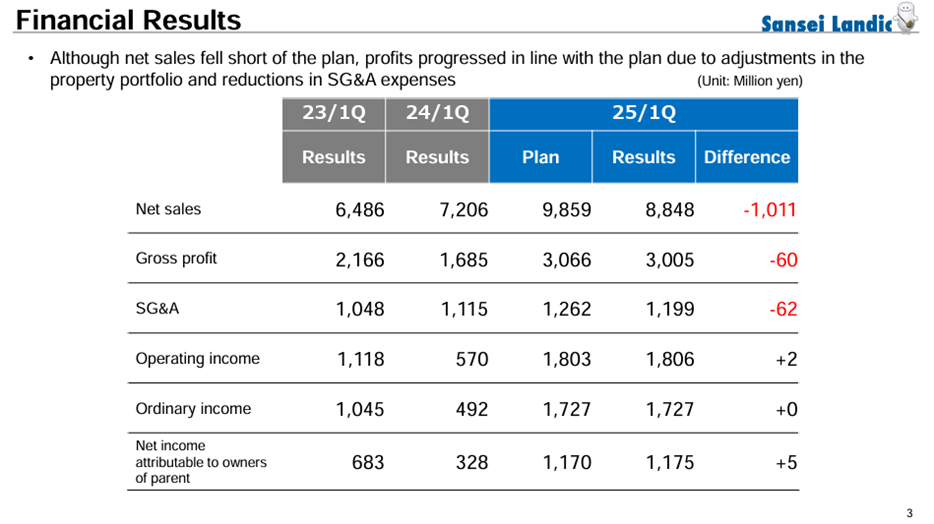
Sansei Landic (hereinafter, “the Company”) announced its financial results for 1Q FY12/2025 on May 15, 2025, posting year-on-year increases in both revenue and profit. Specifically, net sales were 8.84 billion yen (+22% YoY), operating income was 1.80 billion yen (+216% YoY), ordinary income was 1.72 billion yen (+250% YoY), and net profit attributable to owners of parent was 1.17 billion yen (+258% YoY).
This set of results is viewed positively as it increases confidence in achieving the Company’s full-year forecast. While the Company’s full-year forecast calls for modest increases in revenue and profit, earnings are expected to be concentrated in the first half (as detailed below). Compared to the 1Q forecast, sales came in approximately 1 billion yen short; however, all profit levels exceeded forecasts, indicating a solid start to the fiscal year.
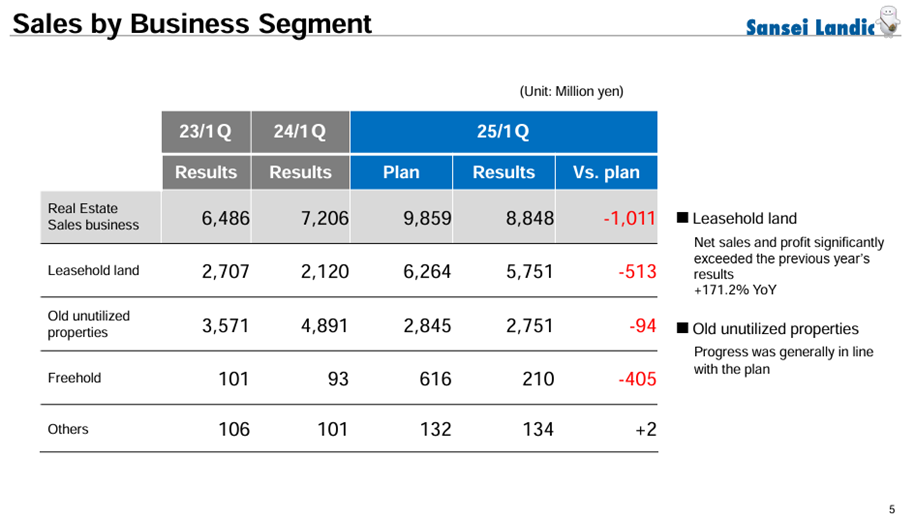
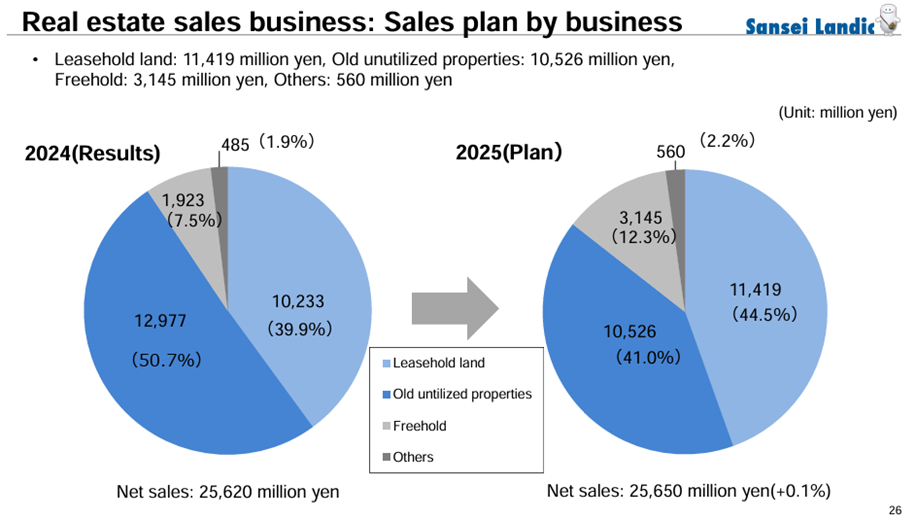
Breaking down sales by segment: Leasehold land was 5.75 billion yen (+171% YoY), Old unutilized properties were 2.75 billion yen (-43% YoY), and Freehold was 210 million yen (+125% YoY). While total sales fell short of the 1Q plan, this was not due to any change in business conditions, and no revisions have been made to the full-year forecast announced at the start of the period. It is reasonable to assume that the variance was due to timing differences in revenue recognition.
Due to the increased proportion of sales from Leasehold land, the gross profit margin rose to 34%. This indicates the Company’s strength in rights adjustment and sales capabilities for Leasehold land.
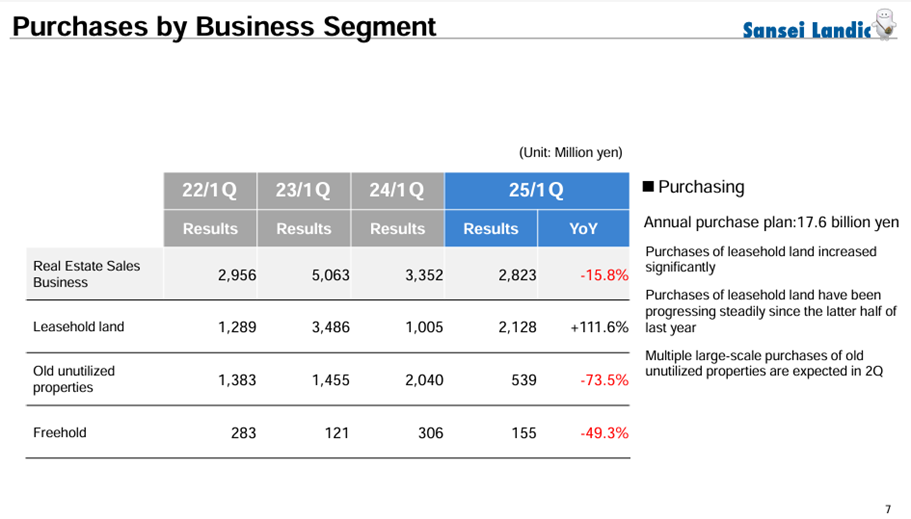
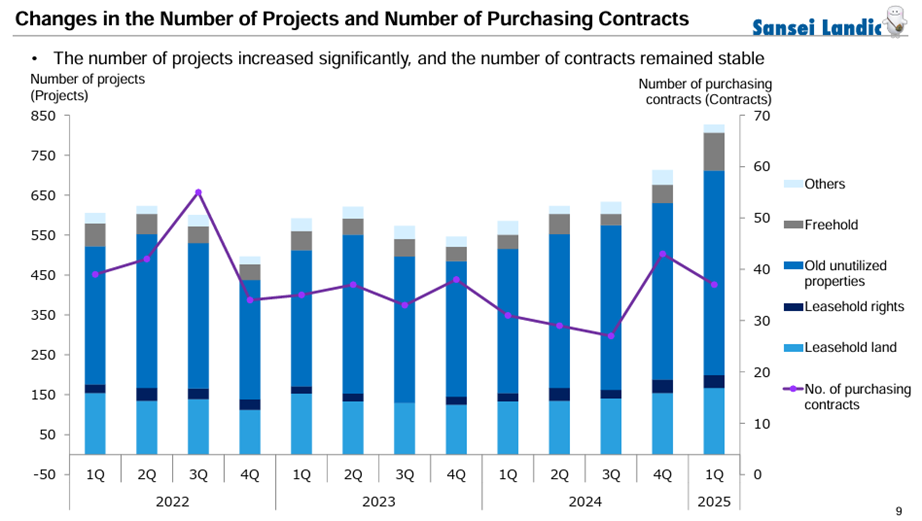
Purchases during the quarter totaled 2.82 billion yen (-15% YoY), consisting of 2.12 billion yen for Leasehold land (+111% YoY), 530 million yen for Old unutilized properties (-73% YoY), and 150 million yen for Freehold (-49% YoY). The progress rate toward the full-year purchase plan of 17.6 billion yen was 16%. However, given that the number of deals is steadily increasing, the number of purchase contracts rose to 151 (+155% YoY), Leasehold land purchases are progressing well, and multiple large Old unutilized property acquisitions are expected in 2Q, there is currently little cause for concern.
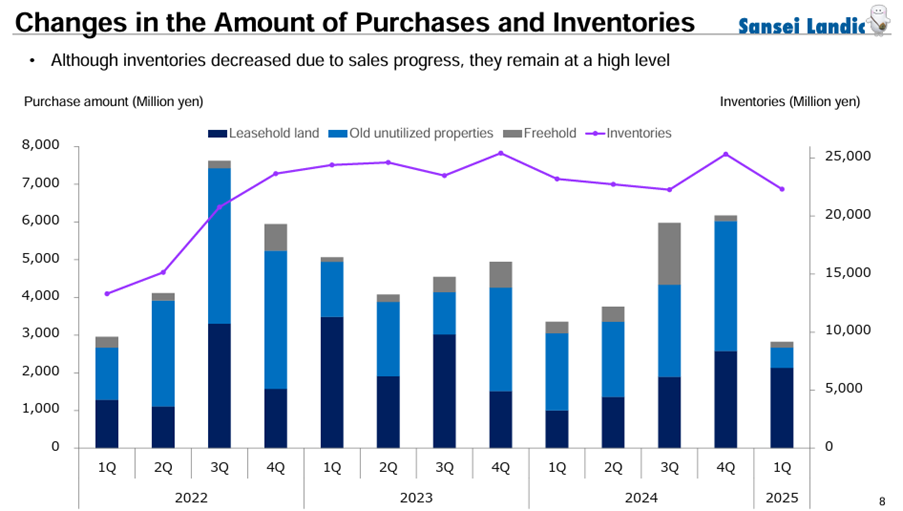
On the balance sheet, the balance of property for sale decreased by 3 billion yen from the end of the previous fiscal year to 22.3 billion yen due to steady sales. Cash and deposits increased by 700 million yen to 5.7 billion yen, and interest-bearing debt decreased by 2.7 billion yen to 15.7 billion yen. These are all regarded as normal developments.
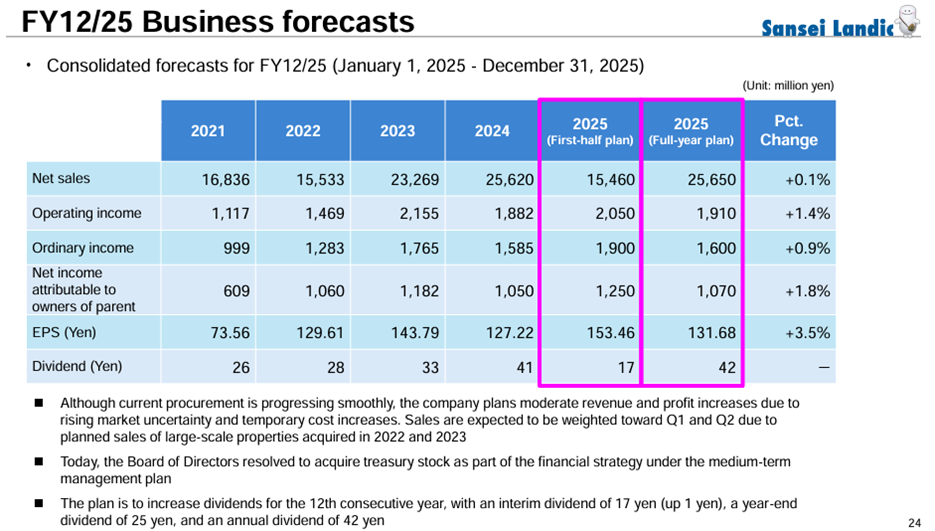
◇ FY12/2025 earnings forecast: Unchanged; revenue and profit expected to show slight full-year increases with 1H-weighted performance
There are no changes to the Company’s FY12/2025 earnings forecast.
Specifically, the 1H forecast includes sales of 15.46 billion yen (+19% YoY), operating income of 2.05 billion yen (+99% YoY), ordinary income of 1.90 billion yen (+120% YoY), and net profit attributable to owners of parent of 1.25 billion yen (+118% YoY).
The full-year forecast includes sales of 25.65 billion yen (+0.1% YoY), operating income of 1.91 billion yen (+1.4% YoY), ordinary income of 1.60 billion yen (+0.9% YoY), and net profit attributable to owners of parent of 1.07 billion yen (+1.8% YoY).
◇ Strengthened shareholder returns
The dividend forecast has not been changed. The annual dividend per share is projected at 42 yen (17 yen for the first half and 25 yen for the year-end), representing a 1 yen increase from the previous year’s interim dividend. The dividend payout ratio is forecast at 31.9%, remaining nearly unchanged, and this would mark the twelfth consecutive year of dividend increases.
Regarding the share buyback, the Company completed the repurchase of 194,900 shares at a total cost of 200 million yen between February 17 and May 14, 2025.
◇ Update on regional revitalization business
In conjunction with announcing the financial results, updates were provided on the regional revitalization business. A RIDER’S VILLA targeting female riders will open in Izu Inatori on July 1, 2025. In addition, two facilities related to renovating traditional houses and the effective use of vacant homes will open in Hirado City, Nagasaki Prefecture, in June and July 2025.
Furthermore, to revitalize and utilize lodging facilities and vacation homes, the second facility in Hachimantai City is scheduled for a pre-opening in June 2025 and a grand opening in August. Also, registration for motorcycle storage services began in April 2025.
These initiatives are drawing significant attention as potential long-term drivers of earnings.
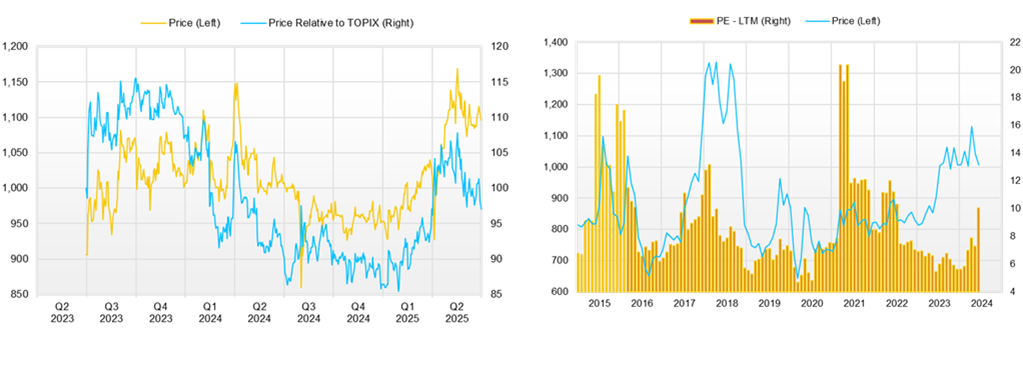
◇Share price trend and future highlights
Following the financial results announcement on February 14, 2025, the Company’s share price generally rose, reflecting the FY12/2025 forecast for higher revenue and profit, the twelfth consecutive year of dividend increases, and the execution of a share buyback. The favorable 1Q results announced on May 15 were also well received, and on May 19, the share price reached a year-to-date high of 1,180 yen. As of now, it remains around the 1,090 yen level.
The stock shows no signs of overheating with a valuation of 8 times forecast earnings (PER), 0.7 times book value (PBR), and a projected dividend yield of 3.85%. This suggests that the market recognizes the Company’s steady growth trajectory and proactive shareholder return policy.
From this perspective, key points to watch going forward include: trends in the real estate market; progress in full-year purchases and earnings for FY12/2025 (including any potential upward revisions); updates on the new medium-term management plan – particularly the effectiveness of measures to strengthen the core Leasehold land and Old unutilized properties businesses, results of feasibility studies for derivative businesses such as Co-ownership, ownership period, and Leasehold rights, and the initial progress of the regional revitalization business; and any announcement of an additional share buyback.
The real estate market is concerned about rising interest rates, construction costs, and labor shortages. However, the Company’s core businesses in Leasehold land and Old unutilized properties appear largely unaffected by these issues. If the Company successfully strengthens its existing core businesses and demonstrates the potential of its derivative businesses, there remains significant room for a valuation re-rating. Notably, the Company will celebrate its 50th anniversary in February 2026, and expectations for shareholder returns will likely increase accordingly.
Company profile
Sansei Landic Co., Ltd. operates a real estate rights adjustment business. The Company makes a profit by adjusting the rights to properties it has purchased, mainly leasehold land and old unutilized properties, and then reselling them. It has captured stable profit opportunities in niche markets. In August 2024, the Company announced a new medium-term plan covering the period from August 2024 to fiscal 2027. ROE and PBR are expected to improve due to the growth strategy and improved capital efficiency.
Key financial data
| Unit: million yen | 2020/12 | 2021/12 | 2022/12 | 2023/12 | 2024/12 | 2025/12 CE |
| Sales | 17,775 | 16,836 | 15,533 | 23,269 | 25,620 | 25,650 |
| EBIT (Operating Income) | 847 | 1,118 | 1,469 | 2,155 | 1,883 | 1,910 |
| Pretax Income | 712 | 1,004 | 1,270 | 1,756 | 1,585 | 1,600 |
| Net Profit Attributable to Owner of Parent | 358 | 609 | 1,060 | 1,183 | 1,051 | 1,070 |
| Cash & Short-Term Investments | 4,330 | 5,361 | 3,837 | 3,770 | 5,013 | |
| Total assets | 20,071 | 20,051 | 28,977 | 30,976 | 33,107 | |
| Total Debt | 16,879 | 16,879 | 16,879 | 16,879 | 18,506 | |
| Net Debt | 13,109 | 13,109 | 13,109 | 13,109 | 13,493 | |
| Total liabilities | 10,004 | 9,749 | 17,921 | 18,899 | 20,349 | |
| Total Shareholders’ Equity | 12,077 | 12,077 | 12,077 | 12,077 | 12,759 | |
| Net Operating Cash Flow | -917 | 1,705 | -9,268 | -12 | 1,143 | |
| Capital Expenditure | 21 | 40 | 28 | 304 | 138 | |
| Net Investing Cash Flow | -288 | -51 | -267 | -766 | -715 | |
| Net Financing Cash Flow | 953 | -608 | 7,971 | 303 | 1,223 | |
| Free Cash Flow | -291 | -291 | -291 | -291 | 1,049 | |
| ROA (%) | 1.82 | 3.04 | 4.32 | 3.95 | 3.28 | |
| ROE (%) | 3.58 | 5.98 | 9.93 | 10.23 | 8.46 | |
| EPS (Yen) | 42.3 | 73.6 | 129.6 | 143.8 | 127.2 | 131.6 |
| BPS (Yen) | 1,192.9 | 1,249.5 | 1,356.8 | 1,465.5 | 1,541.8 | |
| Dividend per Share (Yen) | 25.00 | 26.00 | 28.00 | 33.00 | 41.00 | 42.00 |
| Shares Outstanding (Million Shares) | 8.47 | 8.47 | 8.49 | 8.58 | 8.58 |
Source: Omega Investment from company data, rounded to the nearest whole number.
Share price
FY12/25 1Q financial result
Source: Company materials
Source: Company materials
Source: Company materials
Source: Company materials
Source: Company materials
Source: Company materials
Full-year forecast for FY12/2025 (Reposted from FY12/2024 financial results materials)
Source: Company materials
Source: Company materials
Financial data (quarterly basis)
| Unit: million yen | 2023/12 | 2024/12 | 2025/12 | ||||||
| 1Q | 2Q | 3Q | 4Q | 1Q | 2Q | 3Q | 4Q | 1Q | |
| (Income Statement) | |||||||||
| Sales | 6,486 | 5,494 | 7,485 | 3,804 | 7,207 | 5,785 | 8,358 | 4,270 | 8,848 |
| Year-on-year | 45.9% | 47.6% | 141.8% | -11.0% | 11.1% | 5.3% | 11.7% | 12.3% | 22.8% |
| Cost of Goods Sold (COGS) | 4,320 | 3,858 | 5,681 | 3,067 | 5,521 | 4,228 | 6,448 | 3,122 | 5,842 |
| Gross Income | 2,166 | 1,635 | 1,803 | 737 | 1,686 | 1,558 | 1,910 | 1,149 | 3,006 |
| Gross Income Margin | 33.4% | 29.8% | 24.1% | 19.4% | 23.4% | 26.9% | 22.9% | 26.9% | 34.0% |
| SG&A Expense | 1,048 | 1,097 | 1,128 | 914 | 1,115 | 1,102 | 1,125 | 1,077 | 1,200 |
| EBIT (Operating Income) | 1,118 | 539 | 676 | -177 | 571 | 455 | 785 | 72 | 1,806 |
| Year-on-year | 150.0% | 15.6% | 135.5% | -165.8% | -49.0% | -15.5% | 16.2% | -140.5% | 216.6% |
| Operating Income Margin | 17.2% | 9.8% | 9.0% | -4.7% | 7.9% | 7.9% | 9.4% | 1.7% | 20.4% |
| EBITDA | 1,145 | 559 | 692 | -161 | 587 | 476 | 806 | 92 | 1,827 |
| Pretax Income | 1,046 | 378 | 587 | -254 | 493 | 369 | 728 | -4 | 1,728 |
| Consolidated Net Income | 684 | 256 | 387 | -144 | 328 | 245 | 485 | -7 | 1,175 |
| Minority Interest | 0 | 0 | 0 | 0 | 0 | 0 | 0 | 0 | 0 |
| Net Income ATOP | 684 | 256 | 387 | -144 | 328 | 245 | 485 | -7 | 1,175 |
| Year-on-year | 82.2% | -24.4% | 97.9% | -195.1% | -52.0% | -4.0% | 25.2% | -94.9% | 258.2% |
| Net Income Margin | 10.5% | 4.7% | 5.2% | -3.8% | 4.6% | 4.2% | 5.8% | -0.2% | 13.3% |
| (Balance Sheet) | |||||||||
| Cash & Short-Term Investments | 3,569 | 4,266 | 5,388 | 3,770 | 4,479 | 4,988 | 4,728 | 5,013 | 5,788 |
| Total assets | 29,627 | 30,777 | 30,632 | 30,976 | 30,487 | 30,561 | 29,940 | 33,107 | 31,353 |
| Total Debt | 16,061 | 16,520 | 16,262 | 16,879 | 16,787 | 16,211 | 15,595 | 18,506 | 15,747 |
| Net Debt | 12,493 | 12,254 | 10,874 | 13,109 | 12,308 | 11,223 | 10,867 | 13,493 | 9,959 |
| Total liabilities | 18,064 | 18,944 | 18,412 | 18,899 | 18,354 | 18,163 | 17,173 | 20,349 | 17,712 |
| Total Shareholders’ Equity | 11,563 | 11,833 | 12,220 | 12,077 | 12,133 | 12,398 | 12,768 | 12,759 | 13,641 |
| (Profitability %) | |||||||||
| ROA | 5.50 | 4.81 | 5.08 | 3.95 | 2.75 | 2.66 | 3.02 | 3.28 | 6.14 |
| ROE | 12.43 | 11.42 | 12.79 | 10.23 | 6.98 | 6.74 | 7.32 | 8.46 | 14.73 |
| (Per-share) Unit: JPY | |||||||||
| EPS | 83.5 | 31.0 | 47.0 | -17.4 | 39.8 | 29.7 | 58.6 | -0.9 | 142.4 |
| BPS | 1,406.1 | 1,435.9 | 1,482.9 | 1,465.5 | 1,472.3 | 1,501.2 | 1,542.9 | 1,541.8 | 1,665.9 |
| Dividend per Share | 0.00 | 0.00 | 0.00 | 33.00 | 0.00 | 16.00 | 0.00 | 25.00 | 0.00 |
| Shares Outstanding(Million shares) | 8.58 | 8.58 | 8.58 | 8.58 | 8.58 | 8.58 | 8.58 | 8.58 | 8.58 |
Source: Omega Investment from company materials
Financial data (full-year basis)
| Unit: million yen | 2014/12 | 2015/12 | 2016/12 | 2017/12 | 2018/12 | 2019/12 | 2020/12 | 2021/12 | 2022/12 | 2023/12 | 2024/12 |
| (Income Statement) | |||||||||||
| Sales | 10,446 | 11,569 | 12,300 | 13,099 | 16,833 | 18,020 | 17,775 | 16,836 | 15,533 | 23,269 | 25,620 |
| Year-on-year | 13.7% | 10.8% | 6.3% | 6.5% | 28.5% | 7.1% | -1.4% | -5.3% | -7.7% | 49.8% | 10.1% |
| Cost of Goods Sold | 7,055 | 7,798 | 8,344 | 8,566 | 12,028 | 12,902 | 13,788 | 12,468 | 10,486 | 16,927 | 19,318 |
| Gross Income | 3,391 | 3,770 | 3,957 | 4,532 | 4,805 | 5,119 | 3,986 | 4,368 | 5,047 | 6,342 | 6,302 |
| Gross Income Margin | 32.5% | 32.6% | 32.2% | 34.6% | 28.5% | 28.4% | 22.4% | 25.9% | 32.5% | 27.3% | 24.6% |
| SG&A Expense | 2,204 | 2,216 | 2,295 | 2,434 | 2,702 | 2,891 | 2,750 | 2,877 | 3,031 | 3,569 | 4,420 |
| EBIT (Operating Income) | 1,187 | 1,300 | 1,446 | 1,762 | 1,766 | 1,861 | 847 | 1,118 | 1,469 | 2,155 | 1,883 |
| Year-on-year | 31.6% | 9.6% | 11.2% | 21.9% | 0.2% | 5.4% | -54.5% | 31.9% | 31.5% | 46.7% | -12.6% |
| Operating Income Margin | 11.4% | 11.2% | 11.8% | 13.5% | 10.5% | 10.3% | 4.8% | 6.6% | 9.5% | 9.3% | 7.3% |
| EBITDA | 1,260 | 1,406 | 1,532 | 1,833 | 1,822 | 1,912 | 896 | 1,161 | 1,517 | 2,236 | 1,962 |
| Pretax Income | 1,044 | 1,196 | 1,329 | 1,672 | 1,539 | 1,759 | 712 | 1,004 | 1,270 | 1,756 | 1,585 |
| Consolidated Net Income | 626 | 724 | 854 | 1,111 | 1,007 | 1,159 | 358 | 609 | 1,060 | 1,183 | 1,051 |
| Minority Interest | 0 | 0 | 0 | 0 | 0 | 0 | 0 | 0 | 0 | 0 | 0 |
| Net Income ATOP | 626 | 724 | 854 | 1,111 | 1,007 | 1,159 | 358 | 609 | 1,060 | 1,183 | 1,051 |
| Year-on-year | 37.5% | 15.6% | 17.9% | 30.2% | -9.4% | 15.1% | -69.1% | 70.5% | 73.9% | 11.6% | -11.2% |
| Net Income Margin | 6.0% | 6.3% | 6.9% | 8.5% | 6.0% | 6.4% | 2.0% | 3.6% | 6.8% | 5.1% | 4.1% |
| (Balance Sheet) | |||||||||||
| Cash & Short-Term Investments | 2,276 | 2,254 | 2,435 | 3,558 | 3,594 | 4,134 | 4,330 | 5,361 | 3,837 | 3,770 | 5,013 |
| Total assets | 8,793 | 11,398 | 10,833 | 16,916 | 16,777 | 19,294 | 20,071 | 20,051 | 28,977 | 30,976 | 33,107 |
| Total Debt | 2,414 | 3,958 | 2,712 | 7,439 | 6,048 | 7,203 | 8,342 | 8,108 | 16,399 | 16,879 | 18,506 |
| Net Debt | 139 | 1,704 | 277 | 3,881 | 2,454 | 3,069 | 4,012 | 2,747 | 12,562 | 13,109 | 13,493 |
| Total liabilities | 3,531 | 5,363 | 3,977 | 8,909 | 7,869 | 9,399 | 10,004 | 9,749 | 17,921 | 18,899 | 20,349 |
| Total Shareholders’ Equity | 5,262 | 6,034 | 6,856 | 8,006 | 8,908 | 9,895 | 10,067 | 10,302 | 11,056 | 12,077 | 12,759 |
| (Cash Flow) | |||||||||||
| Net Operating Cash Flow | 1,761 | -1,451 | 1,611 | -3,666 | 1,617 | -420 | -917 | 1,705 | -9,268 | -12 | 1,143 |
| Capital Expenditure | 91 | 58 | 111 | 57 | 66 | 61 | 21 | 40 | 28 | 304 | 138 |
| Net Investing Cash Flow | -111 | -116 | -184 | 107 | -64 | -71 | -288 | -51 | -267 | -766 | -715 |
| Net Financing Cash Flow | -612 | 1,588 | -1,278 | 4,667 | -1,495 | 984 | 953 | -608 | 7,971 | 303 | 1,223 |
| Free Cash Flow | 1,697 | -1,491 | 1,536 | -3,692 | 1,572 | -446 | -923 | 1,682 | -9,282 | -291 | 1,049 |
| (Profitability %) | |||||||||||
| ROA | 7.07 | 7.17 | 7.68 | 8.01 | 5.98 | 6.42 | 1.82 | 3.04 | 4.32 | 3.95 | 3.28 |
| ROE | 13.72 | 12.82 | 13.24 | 14.96 | 11.90 | 12.32 | 3.58 | 5.98 | 9.93 | 10.23 | 8.46 |
| (Per-share) Unit: JPY | |||||||||||
| EPS | 90.2 | 90.1 | 104.9 | 134.4 | 119.6 | 137.1 | 42.3 | 73.6 | 129.6 | 143.8 | 127.2 |
| BPS | 664.8 | 744.2 | 841.3 | 958.0 | 1,054.5 | 1,170.2 | 1,192.9 | 1,249.5 | 1,356.8 | 1,465.5 | 1,541.8 |
| Dividend per Share | 6.00 | 10.00 | 12.00 | 18.00 | 21.00 | 23.00 | 25.00 | 26.00 | 28.00 | 33.00 | 41.00 |
| Shares Outstanding (Million shares) | 7.91 | 8.11 | 8.15 | 8.35 | 8.45 | 8.46 | 8.47 | 8.47 | 8.49 | 8.58 | 8.58 |
Source: Omega Investment from company materials