2026-06-25
Home
Japanese

Omega Investment Co., Ltd.
Human Creation Holdings (Investment report – 3Q update)
| Share price (8/29) | ¥1,195 | Dividend Yield (25/9 CE) | 2.3 % |
| 52weeks high/low | ¥915/1,420 | ROE(24/9) | 33.9 % |
| Avg Vol (3 month) | 8.5 thou shrs | Operating margin (24/9) | 8.8 % |
| Market Cap | ¥4.27 bn | Beta (5Y Monthly) | 0.45 |
| Enterprise Value | ¥3.18 bn | Shares Outstanding | 3.573 mn shrs |
| PER (25/9 CE) | 11.6 X | Listed market | TSE Growth |
| PBR (24/9 act) | 2.7 X |
| Click here for the PDF version of this page |
| PDF version |
Strategic domains are driving the earnings; recovery in gross margin and high ROE bring the stock price close to a re-rating. The catalyst for a stock price breakout will be a marked improvement in KPIs.
◇ FY9/2025 Q3 earnings highlights: strategic domains surged and the progress rate exceeded 80%, with gross margin also trending toward recovery
For FY9/2025 Q3 year-to-date (October 2024–June 2025), Human Creation Holdings, Inc. (hereinafter “HCH”) posted consolidated results of net sales of 6,298 million yen (+19.7% YoY), operating profit of 547 million yen (+20.1% YoY), and ordinary profit of 541 million yen (+18.9% YoY), securing double-digit increases in both sales and profits. The progress rate toward the full-year forecast for operating profit reached 86.1%, and visibility for achieving results in Q4 is favorable.
In Q3 standalone (April–June 2025), net sales were 2,226 million yen (+20.7% YoY), operating profit was 168 million yen (−6.4% YoY), and quarterly net income attributable to owners of the parent was 91 million yen (−16.5% YoY). While profits appeared to hit a brief plateau relative to sales growth, this was due to PMI-related costs accompanying the new consolidation of HC Financial Advisor (hereinafter “HCFA”) and one-off expenses associated with the construction of the solution platform (approximately 25 million yen).
The strategic domains drove sales growth. In addition to the consolidation effect of HCFA, order expansion at existing subsidiaries progressed, and Q3 standalone sales in the strategic domains reached 904 million yen (+62.0% YoY), with a composition ratio of 40.6% of the total. Meanwhile, sales in the SES domain were 1,322 million yen (+2.8% YoY), and the contribution to overall sales growth was limited.
On the profit side, the trend in gross margin warrants attention. It had temporarily declined due to regular salary increases and sales-linked performance bonuses implemented in Q2. Nevertheless, in Q3 it recovered to 29.7%, returning to the same level as the same period a year earlier (29.8%). This was due to the increase in the composition ratio of the strategic domains and the rise of SES contract unit prices (+3.5% YoY), indicating that structural improvement is progressing, similar to sales growth.
Net income attributable to owners of the parent declined YoY, due to valuation losses on investment securities (77 million yen for the nine months). Excluding this factor, based on the progress in operating profit and the structural improvement, the stability of the earnings base can instead be interpreted as increasing.
On the financial front, the equity ratio decreased by 12.0 percentage points from the end of the previous fiscal year to 31.8%. This was due to an expansion of total assets associated with M&A, and an excessive increase in borrowings as a funding means has not been observed. ROE was 33.9%, ROA was 13.6%, and ROIC was 15.0%, all remaining at high levels, and capital efficiency continues to be an indicator supporting the company’s competitive advantage.
In the SES domain, headcount was 688 (−1.4% YoY), a slight decrease. Still, the review of the personnel mix with an emphasis on profitability is progressing, and sales are being maintained through higher contract unit prices. Overall, the company secured an adequate landing level in the three areas of sales growth, recovery in gross margin, and profit progress, and no breakdown in earnings momentum is observed.
◇ Segment analysis: composition is shifting markedly toward the strategic domains, a structural change accelerating a qualitative transformation in earnings
HCH is rapidly advancing a structural shift from the conventional SES model to higher value-added consulting and contracted development businesses, with the strategic domains exceeding 40% in the sales mix. In FY9/2025 Q3 standalone, the strategic domains accounted for 904 million yen out of total net sales of 2,226 million yen, marking a high growth of +62.0% YoY. By contrast, net sales in the SES domain were 1,322 million yen, a slight increase of +2.8% YoY.
The strategic domains are composed through the group’s Asset Consulting Force, Sailing, Human Base, Cosmopia, TARA, and HCFA, which was newly consolidated in April 2025. These subsidiaries handle IT and business consulting, contracted development, operations, M&A advisory, and business BPO, and they adopt a high-value-added model centered on project-based contracts. Their customer base consists mainly of medium-sized to large companies, including listed companies, and they play a significant role in lifting the company’s profitability. In particular, the new consolidation effect of HCFA contributed to the increase in Q3 sales, while order accumulation progressed steadily at existing group companies; even excluding HCFA, sales increased +21.4% YoY.
Meanwhile, the SES domain consists of Brain Knowledge Systems (hereinafter “BKS”) and the former CLS (hereinafter “CLS”), and its principal service is the provision of engineers’ technical services while resident at client sites. Contracts are on a per-person-month unit price basis, and utilization rate and unit price are directly linked to profitability. As of the end of June 2025, SES headcount was 688 (−1.4% YoY), but by focusing the hiring strategy on higher-priced personnel at the middle layer and above, the contract unit price rose to 675 thousand yen per month (+3.5% YoY). Although there were temporary departures at CLS—absorbed by BKS in October 2024—due to the introduction of a sales-linked pay system and changes to assignment rules, the company is working to maintain and expand profitability through higher unit prices.
Furthermore, within the group, an engineer shift from the SES domain to the strategic domains is being promoted, and the overall business structure is moving from a simple staffing model to a project-based model grounded in outcomes and added value. Notably, the one-off expense of 25 million yen incurred in Q3 FY2025 for building a solution platform is positioned as a stepping stone for in-house development and the horizontal rollout of services in the strategic domains, and earnings growth centered on this area is expected going forward.
Thus, not only in changes to the sales mix, but through companywide structural reforms extending to service formats, revenue models, and personnel allocation, the company is in the process of achieving both improved margins and sustained growth.
◇ Earnings forecast: plans for higher sales and profits driven by expansion in the strategic domains and M&A effects; Q4 to absorb upfront investments and land the plan
HCH maintains its FY9/2025 full-year forecast unchanged at net sales of 8,906 million yen (+24.3% YoY), operating profit of 635 million yen (+0.7% YoY), ordinary profit of 635 million yen (+0.9% YoY), and net income attributable to owners of the parent of 327 million yen (−19.0% YoY). For the nine months, the progress rates are 70.7% for net sales and 86.1% for operating profit, and particularly on the profit side, results have been tracking above assumptions, so the risk of shortfall in Q4 is limited.
The growth drivers are the expansion of the strategic domains and the consolidation effect of HCFA. In Q3 standalone, sales in the strategic domains expanded to 904 million yen (+62.0% YoY), and the composition ratio rose to 40.6% of the total. In Q4, progress in orders, including HCFA, is expected; in the SES domain, although headcount is 688 (−1.4% YoY), profitability is expected to be maintained by the increase in the contract unit price to 675 thousand yen per month (+3.5% YoY).
In addition, the rising ratio of the strategic domains is contributing to improvement in gross margin. The decline in gross margin caused by regular salary increases and the introduction of a performance-linked compensation system that occurred in Q2 was temporary; in Q3, it recovered to 29.7%, almost the same level as a year earlier (29.8%). That said, as upfront investments such as building the solution platform base and PMI-related costs at HCFA may continue in Q4, there remains room for temporary pressure on the operating margin.
The financial base is sound; the equity ratio fell to 31.8% (down 12.0 percentage points from the end of the previous fiscal year) due to an increase in assets associated with M&A. Still, capital efficiency remains at a high level with ROE at 33.9% and ROIC at 15.0%. A year-end dividend of 27 yen is planned, and the company continues a capital policy that balances growth investment and shareholder returns.
Even while absorbing upfront investments in Q4, the high growth in the strategic domains and the contribution from HCFA put the achievement of the company’s plan within sight. The keys to achieving the plan lie in the timing of closing HCFA projects and the progress of recouping the platform development investments.
Given the high progress rate in profits and the recovery in gross margin, the upfront investments in Q4 are likely to remain within the scope of the plan. Assessing the effects of PMI after M&A and the timing of monetization of the new platform will be the focus of the medium-term stock price evaluation.
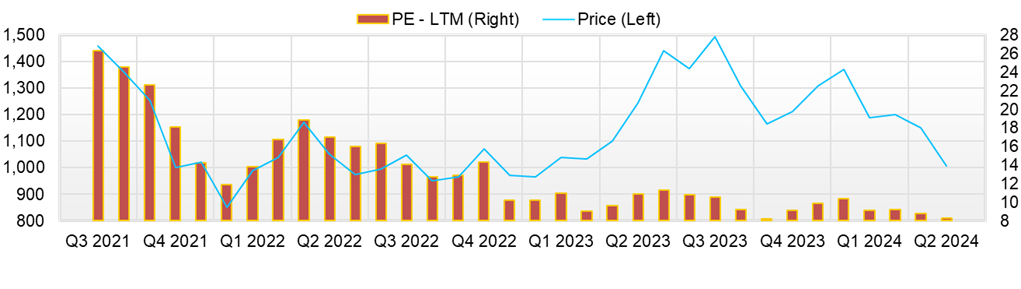
◇ Stock price trends and points of focus: groundwork for an upside breakout of the stock price is progressing within a trading range; negative factors are likely to turn on “trading volume and quantitative KPIs”
Over the past three months, the stock price has generally continued to trade in a range of 1,116–1,189 yen. Still, given the growth of the strategic domains and high capital efficiency (forecast PER of 12.42x, PBR of 2.56x, ROE of 33.9%, and ROIC of 15.0%), we judge that, when quantitative KPIs are clarified at the next earnings release/IR, the probability of an upside breakout will increase. In the short term, the “quality of catalysts” and the “persistence of trading volume” are the keys; when both are present, the valuation range tends to shift upward.
Looking at the past three months, after the Q2 earnings announcement in May, downward pressure dominated, whereas after the Q3 announcement in August, the price temporarily rose to 1,189 yen. That said, the price did not settle at higher levels; the main reason the price failed to break out was that trading volume remained one-off. This appears to be a weak factor, but conversely, it means the company has reached a stage where “which information will be the market trigger” is clear; presenting quantitative KPIs such as sales in the strategic domains, gross margin, the ratio of contracted development, unit prices, and the ratio of recurring revenue will be the shortest route to reflecting the company’s strengths (high ROE and a neutral PER) in the multiples.
Technically, the 25-day moving average is gently rising, and the 75-day moving average is shifting from flat to rising, with more instances of the price moving above both lines. The Bollinger Bands (20-day, ±2σ) are undergoing a squeeze, and if the closing price breaks above the upper band, it may indicate a potential trend reversal. At the same time, trading volume simultaneously rises to nearly twice the recent 20-day average, a transition to expansion is likely. RSI (14) is mainly moving back and forth in the neutral zone typical of a trading range; holding above 60 will be a run-up toward an upside breakout, while falling below 40 will be a cautionary signal for a downside run. The current “trend not yet determined” looks negative, but conversely, the energy accumulation indicated by the squeeze suggests the stage is being set for the next move.
Reactions to news are selective. Items such as front-loaded expenses or valuation losses tend to cause short-term downward pressure, but in the sense that “what is lacking is clear,” this is also positive. Specifically, if (i) quarterly disclosure of quantitative KPIs in the strategic domains is strengthened, (ii) the timing of recording closings at HCFA and the scale of fees are made visible, and (iii) the recovery curve for platform investments and commercial milestones are presented, the phase is likely to shift from a pattern of temporary spikes at events followed by loss of momentum to sustained increases in trading volume and price.
We infer that the current trading range is not “weak price action” but a stage of energy accumulation accompanying the “clarification of breakout conditions.” The company has a combination of high ROE and a neutral PER, and factors that appeared negative, front-loaded expenses and one-off items, will turn to a valuation re-rating if accompanied by quantitative KPI disclosure and the realization of recordings at HCFA. Therefore, investors should avoid being swayed by short-term noise and, focusing on the quality of trading volume and whether quantitative KPIs are presented accurately, identify whether the move is the initial stage of an upside breakout or a reversal on dips.
In sum, the stock is currently range-bound. If the closing price breaks through 1,190 yen and trading volume is twice the 20-day average, and in addition, the visibility of strategic KPIs and the recording of HCFA are in place, the stance tilts toward overweight. Conversely, −2σ together with RSI around 35 and a lower shadow on the 25-day moving average is viewed as a good opportunity to buy on dips.
Company profile
An IT and consulting company that combines organizational growth with a highly profitable structure, entering a takeoff phase through M&A and strengthening of solutions
Human Creation Holdings, Inc. was established in 2016 and is headquartered in Chiyoda-ku, Tokyo. The company operates management consulting, contracted development, and SES businesses with strengths in the IT domain. It was listed on the Tokyo Stock Exchange Mothers Market (currently the Growth Market) in March 2021. Its customer base consists mainly of medium-sized to large companies.
The businesses are broadly divided into the “strategic domains” and the “SES domain.” In the strategic domains, the company engages in IT and management consulting and contracted development/operations, with multiple subsidiaries that joined the group through M&A or establishment contributing to earnings. In the SES business, the company deploys a model in which engineers are stationed at client sites; as of Q3 FY9/2025, the sales mix was 59.4% for SES and 40.6% for the strategic domains, indicating progress in the shift from the conventional model to higher value-added domains.
In recent years, the company has advanced the sophistication of solution provision in the strategic domains and the development of its platform. In April 2025, the company made HC Financial Advisor, which engages in M&A intermediation, a consolidated subsidiary, and entered the M&A business domain, thereby proactively expanding its business portfolio.
The company is also focusing on compensation systems that appropriately reflect employee performance and on creating a middle layer of personnel (appointment of mid-level personnel), fostering an organizational culture that combines engagement and profitability. Going forward, the company aims to transform into a core mid-tier company on the Growth Market through further expansion of the strategic domains and discontinuous growth while maintaining capital efficiency.
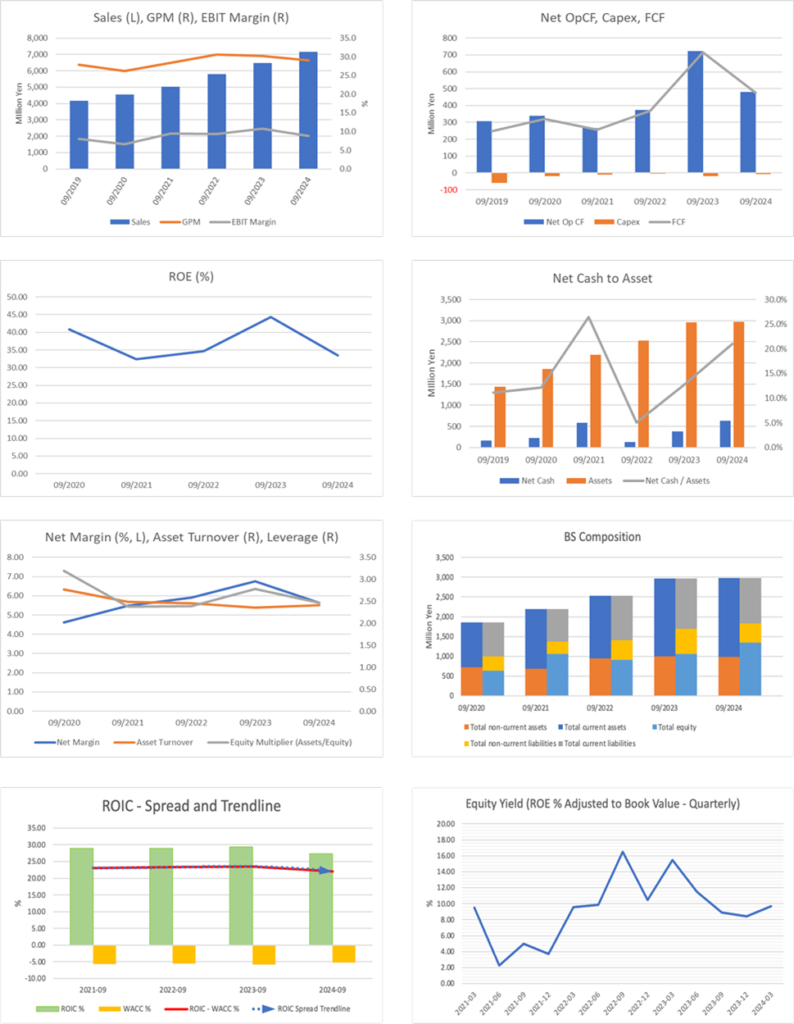
Key financial data
| Unit: million yen | 2021 | 2022 | 2023 | 2024 | 2025 CE |
| Sales | 5,035 | 5,803 | 6,487 | 7,166 | 8,906 |
| EBIT (Operating Income) | 478 | 545 | 698 | 631 | 635 |
| Pretax Income | 464 | 546 | 701 | 630 | |
| Net Profit Attributable to Owner of Parent | 276 | 343 | 438 | 404 | 327 |
| Cash & Short-Term Investments | 846 | 673 | 1,020 | 1,003 | |
| Total assets | 2,192 | 2,536 | 2,963 | 2,978 | |
| Total Debt | 266 | 546 | 641 | 376 | |
| Net Debt | -580 | -127 | -379 | -627 | |
| Total liabilities | 1,128 | 1,620 | 1,901 | 1,625 | |
| Total Shareholders’ Equity | 1,064 | 916 | 1,062 | 1,353 | |
| Net Operating Cash Flow | 268 | 373 | 723 | 481 | |
| Capital Expenditure | 11 | 3 | 17 | 7 | |
| Net Investing Cash Flow | -52 | -335 | -169 | -3 | |
| Net Financing Cash Flow | 44 | -212 | -206 | -496 | |
| Free Cash Flow | 257 | 370 | 717 | 475 | |
| ROA (%) | 13.63 | 14.51 | 15.95 | 13.60 | |
| ROE (%) | 32.43 | 34.65 | 44.34 | 33.47 | |
| EPS (Yen) | 71.6 | 94.6 | 132.4 | 123.1 | 103.48* |
| BPS (Yen) | 276.2 | 265.6 | 324.1 | 415.9 | |
| Dividend per Share (Yen) | 24.49 | 25.00 | 25.50 | 26.00 | 27.00 |
| Shares Outstanding (Million shares) | 3.85 | 3.85 | 3.85 | 3.57 |
*Adjusted EPS excluding the impact of loss on valuation of investment securities was ¥127.84.
Source: Omega Investment from company data, rounded to the nearest whole number.
Share price
Key stock price data
Financial data (quarterly basis)
| Unit: million yen | 2023/9 | 2024/9 | 2025/9 | ||||||
| 3Q | 4Q | 1Q | 2Q | 3Q | 4Q | 1Q | 2Q | 3Q | |
| (Income Statement) | |||||||||
| Sales | 1,671 | 1,632 | 1,649 | 1,770 | 1,845 | 1,902 | 2,013 | 2,058 | 2,227 |
| Year-on-year | 11.0% | 5.6% | 5.4% | 9.3% | 10.4% | 16.6% | 22.1% | 16.3% | 20.7% |
| Cost of Goods Sold (COGS) | 1,158 | 1,127 | 1,184 | 1,262 | 1,295 | 1,346 | 1,421 | 1,473 | 1,566 |
| Gross Income | 513 | 505 | 465 | 508 | 550 | 557 | 592 | 585 | 661 |
| Gross Income Margin | 30.7% | 30.9% | 28.2% | 28.7% | 29.8% | 29.3% | 29.4% | 28.4% | 29.7% |
| SG&A Expense | 324 | 329 | 325 | 373 | 369 | 381 | 380 | 419 | 492 |
| EBIT (Operating Income) | 189 | 176 | 140 | 135 | 180 | 176 | 212 | 166 | 169 |
| Year-on-year | 39.5% | -1.7% | -3.7% | -27.9% | -4.5% | -0.4% | 51.7% | 22.7% | -6.4% |
| Operating Income Margin | 11.3% | 10.8% | 8.5% | 7.6% | 9.8% | 9.2% | 10.6% | 8.1% | 7.6% |
| EBITDA | 218 | 205 | 169 | 166 | 212 | 207 | 243 | 199 | 221 |
| Pretax Income | 190 | 175 | 139 | 135 | 182 | 174 | 212 | 87 | 166 |
| Consolidated Net Income | 126 | 92 | 89 | 92 | 110 | 113 | 132 | 42 | 92 |
| Minority Interest | 0 | 0 | 0 | 0 | 0 | 0 | 0 | 0 | 0 |
| Net Income ATOP | 126 | 92 | 89 | 92 | 110 | 113 | 132 | 42 | 92 |
| Year-on-year | 47.9% | -29.4% | -10.9% | -23.4% | -12.9% | 22.4% | 48.3% | -54.4% | -16.6% |
| Net Income Margin | 7.6% | 5.7% | 5.4% | 5.2% | 6.0% | 6.0% | 6.6% | 2.0% | 4.1% |
| (Balance Sheet) | |||||||||
| Cash & Short-Term Investments | 782 | 1,020 | 952 | 995 | 1,122 | 1,003 | 938 | 1,200 | 1,159 |
| Total assets | 2,999 | 2,963 | 2,791 | 2,997 | 3,035 | 2,978 | 3,004 | 3,365 | 4,355 |
| Total Debt | 845 | 641 | 587 | 574 | 425 | 376 | 326 | 702 | 1,322 |
| Net Debt | 63 | -379 | -365 | -420 | -697 | -627 | -612 | -499 | 163 |
| Total liabilities | 1,999 | 1,901 | 1,695 | 1,788 | 1,764 | 1,625 | 1,602 | 2,013 | 2,948 |
| Total Shareholders’ Equity | 999 | 1,062 | 1,096 | 1,209 | 1,271 | 1,353 | 1,402 | 1,352 | 1,408 |
| (Profitability %) | |||||||||
| ROA | 17.34 | 15.95 | 15.54 | 13.80 | 12.70 | 13.60 | 15.43 | 12.48 | 10.25 |
| ROE | 51.25 | 44.34 | 47.24 | 38.60 | 33.76 | 33.47 | 35.80 | 31.01 | 28.29 |
| (Per-share) Unit: JPY | |||||||||
| EPS | 38.5 | 28.2 | 27.2 | 27.9 | 33.4 | 34.7 | 40.6 | 13.2 | 29.6 |
| BPS | 305.0 | 324.1 | 334.4 | 366.4 | 387.1 | 415.9 | 431.0 | 429.8 | 455.1 |
| Dividend per Share | 0.00 | 25.50 | 0.00 | 0.00 | 0.00 | 26.00 | 0.00 | 0.00 | 0.00 |
| Shares Outstanding(million shares) | 3.85 | 3.85 | 3.85 | 3.85 | 3.85 | 3.85 | 3.57 | 3.57 | 3.57 |
Source: Omega Investment
Financial data (full-year basis)
| Unit: million yen | 2021 | 2022 | 2023 | 2024 |
| (Income Statement) | ||||
| Sales | 5,035 | 5,803 | 6,487 | 7,166 |
| Year-on-year | 10.3% | 15.3% | 11.8% | 10.5% |
| Cost of Goods Sold | 3,607 | 4,030 | 4,522 | 5,087 |
| Gross Income | 1,428 | 1,773 | 1,965 | 2,079 |
| Gross Income Margin | 28.4% | 30.6% | 30.3% | 29.0% |
| SG&A Expense | 950 | 1,228 | 1,267 | 1,448 |
| EBIT (Operating Income) | 478 | 545 | 698 | 631 |
| Year-on-year | 57.5% | 14.0% | 28.0% | -9.6% |
| Operating Income Margin | 9.5% | 9.4% | 10.8% | 8.8% |
| EBITDA | 558 | 659 | 813 | 754 |
| Pretax Income | 464 | 546 | 701 | 630 |
| Consolidated Net Income | 276 | 343 | 438 | 404 |
| Minority Interest | 0 | 0 | 0 | 0 |
| Net Income ATOP | 276 | 343 | 438 | 404 |
| Year-on-year | 31.2% | 24.3% | 27.8% | -7.8% |
| Net Income Margin | 5.5% | 5.9% | 6.8% | 5.6% |
| (Balance Sheet) | ||||
| Cash & Short-Term Investments | 846 | 673 | 1,020 | 1,003 |
| Total assets | 2,192 | 2,536 | 2,963 | 2,978 |
| Total Debt | 266 | 546 | 641 | 376 |
| Net Debt | -580 | -127 | -379 | -627 |
| Total liabilities | 1,128 | 1,620 | 1,901 | 1,625 |
| Total Shareholders’ Equity | 1,064 | 916 | 1,062 | 1,353 |
| (Cash Flow) | ||||
| Net Operating Cash Flow | 268 | 373 | 723 | 481 |
| Capital Expenditure | 11 | 3 | 17 | 7 |
| Net Investing Cash Flow | -52 | -335 | -169 | -3 |
| Net Financing Cash Flow | 44 | -212 | -206 | -496 |
| Free Cash Flow | 257 | 370 | 717 | 475 |
| (Profitability ) | ||||
| ROA (%) | 13.63 | 14.51 | 15.95 | 13.60 |
| ROE (%) | 32.43 | 34.65 | 44.34 | 33.47 |
| Net Margin (%) | 5.48 | 5.91 | 6.76 | 5.64 |
| Asset Turn | 2.49 | 2.45 | 2.36 | 2.41 |
| Assets/Equity | 2.38 | 2.39 | 2.78 | 2.46 |
| (Per-share) Unit: JPY | ||||
| EPS | 71.6 | 94.6 | 132.4 | 123.1 |
| BPS | 276.2 | 265.6 | 324.1 | 415.9 |
| Dividend per Share | 24.49 | 25.00 | 25.50 | 26.00 |
| Shares Outstanding (million shares) | 3.85 | 3.85 | 3.85 | 3.57 |
Source: Omega Investment