2026-06-26
Home
Japanese

Omega Investment Co., Ltd.
Kidswell Bio (Investment report – Basic)
| Share price (9/24) | ¥271 | Dividend Yield (26/3 CE) | – % |
| 52weeks high/low | ¥93/417 | ROE(25/3 act) | -1.6 % |
| Avg Vol (3 month) | 2,700 thou shrs | Operating margin (25/3 act) | 0.5 % |
| Market Cap | ¥13.3 bn | Beta (5Y Monthly) | – |
| Enterprise Value | ¥11.9 bn | Shares Outstanding | 49.086 mn shrs |
| PER (26/3 CE) | – X | Listed market | TSE Growth |
| PBR (25/3 act) | 6.5 X |
| Click here for the PDF version of this page |
| PDF version |
Strengthening earnings is the prologue. Generate cash with biosimilars and add future value with SQ-SHED
Conclusion
Kidswell Bio Corporation (hereinafter,“the Company”) has a two-layer model, generating cash through biosimilars (BS), while creating future value with SQ-SHED, a cell therapy based on SHED (stem cells from human exfoliated deciduous teeth), independently developed by its wholly owned subsidiary S-Quatre. In 1Q FY2026/3, the Company achieved a clear return to profitability, with net sales of 1.72 billion yen, an operating profit of 184 million yen, and quarterly profit attributable to the owners of the parent of 157 million yen. The backdrop is recovery in gross profit due to on-schedule delivery of active pharmaceutical ingredient(API) and other materials and the revision of supply terms; in working capital, a reduction in accounts receivable and work-in-process, and a healthier cash conversion cycle (CCC) are also confirmed. The fact is a single point: expanding supply to meet robust demand, along with various measures, is strengthening earnings power toward a return to consolidated profit in FY2026.
For the full year, guidance is presented as a range: net sales of 5.0–5.5 billion yen and an operating loss of 1.0–1.7 billion yen; however, the initial turn to profitability remains intact. In BS, profitability is designed to be increased from three angles—volume × unit price × turnover—through the expansion of supply for the four existing products and the optimization of supply terms. The company explicitly indicates consolidated operating profit in FY2026 (April 2026–March 2027), and structural improvements could accelerate. In the next phase, the conclusion of agreements for new BS (scheduled by the end of September 2025), expansion of the pipeline, and also the development of domestic manufacturing facilities will strengthen medium-term earnings resilience on both the cost and stable-supply fronts.
There are three near-term catalysts: (1) the conclusion of agreements for new BS; (2) the interim analysis for SQ-SHED in pediatric cerebral palsy (scheduled for December 2025); and (3) the start of construction of domestic BS manufacturing facilities (planned for March 2026). Each directly impacts one of the following: “demand expansion,” “gross margin,” or “supply stability.” Additionally, stable shareholdings by core shareholders underpin confidence in the capital policy.
From a valuation perspective, figures are: market capitalization of 12.9 billion yen; price-to-book ratio (PBR) of 6.35x; ROE of −2.1%; ROA of −0.3%; and beta of 1.45. Conditions for sustaining the premium come down to three key factors: (1) sequential improvement in quarterly gross margin; (2) adherence to manufacturing and delivery schedules, as well as the speed of cash collection; and (3) the ability to execute on key events. The stance is slightly bullish. A phased increase in exposure linked to the accumulation of actual KPIs is preferred. While responding nimbly to overheating ahead of events, as long as profit-turn momentum and operational improvements in BS do not falter, there is an advantage in capturing a mid-term re-rating.
1. Company overview
The base of “hybrid drug discovery.” A small, elite team bringing together biosimilars and cell therapy
The Company originated from a biotech venture based at Hokkaido University and, under the corporate philosophy of “Biotech Striving for value creation,” aims to implement medicine for pediatric, rare, and intractable diseases. The vision is “KIDS WELL, ALL WELL.” With the goal of providing care that encompasses children and their families, the basic approach is to run in parallel the biosimilar business, which serves as the earnings base, and cell therapy (regenerative medicine) utilizing SHED.
Founded in 2001 and listed on the TSE in 2012. In April 2024, the Company transferred its Cell therapy business to its subsidiary, S-Quatre, through a corporate split. The parent Company then concentrates on the development of biosimilars and the supply of API. This has increased agility in R&D and capital allocation, enabling optimal operations across two areas with distinct business characteristics.
The headquarters are located in Nihonbashi-Honcho, Chuo-ku, Tokyo. Research bases are the Sapporo Research Institute (within Hokkaido University) and the Tokyo Lab (ShinKiba). The Company has 37 employees (as of March 2025). To compensate for limited headcount, it adopts a “virtual R&D” model that collaborates with external academia and contract development and manufacturing organization (CDMO), building a structure that balances quality and speed. Capital stock is 53 million yen (as of August 1, 2025).
On the business side, four biosimilar products (GBS-001, GBS-010, GBS-011, and GBS-007) that capture patent expirations of reference biologics have already been launched in collaboration with partners. In addition to supplying API and drug product, the Company monetizes through royalties and milestones tied to sales performance. In cell therapy, with SQ-SHED as the core, the strategy is to advance practical applications in stages for pediatric and rare diseases, such as pediatric cerebral palsy.
Management is led by President Shinya Kurebayashi, who has a background in investment banking and the cell therapy business. Securing funds and know-how through biosimilars, which generate stable earnings, and reinvesting the fruits into cell therapy with high growth potential, this “balancing stability and growth” is the Company’s characteristic. From an investor’s perspective, the room to improve capital efficiency, premised on synergies between the two businesses and the ability to generate the next catalysts, is central to corporate value.
2. Business characteristics and content
A two-layer structure of an earnings engine and growth options through “stable BS and challenging SQ-SHED.”
In the BS business, four products have already been launched. While supplying API, etc. to partner pharmaceutical companies, the Company has built a revenue model that also earns royalties tied to sales performance in some cases. For GBS-007, after its launch in December 2021, an additional indication was approved, and demand expanded; GBS-010, launched in November 2023, is also new, and the two are positioned as growth drivers. In neutrophil-related and renal areas, there are precedents, including other companies’ products, where substitution rates to biosimilars spread to over 80%, which increases the predictability of this business.
The development of BS proceeds stepwise, from the establishment of expression cell lines, optimization of the API production process, verification of equivalence with the reference product, and application for approval. Success factors are the importance of first-to-market launch calculated back from the expiry of patents and the re-examination period for the reference product, process design in light of the drug pricing system, and design-around of patents, and early collaboration with partner companies. The Company’s basic model is to build business value through ongoing revenue from API supply in addition to upfront payments and development milestones.
Cell therapy is handled by the subsidiary S-Quatre, which aims to achieve clinical implementation for pediatric and rare diseases, utilizing its proprietary SQ-SHED as the core. The central theme is pediatric cerebral palsy (chronic phase; GCT-103): the final administration in the investigator-initiated clinical research (autologous) was completed in June 2025, and the interim analysis is expected to be announced around December 2025. For the allogeneic product, a co-development agreement with Mochida Pharmaceutical was concluded in March 2025, and preparations for domestic clinical trials are now in progress. For the rare disease congenital isolated hypoganglionosis (GCT-102), the project was selected by AMED (April 2025), and ischemic bone disease is also under research through university–industry collaboration. On the manufacturing side, base building is proceeding in parallel: establishment of a master cell bank (MCB) that conforms to U.S. FDA standards, establishment of a large-scale culture method and technology transfer to a CDMO, and more.
The two-layer structure of continued revenue from BS plus clinical catalysts for SQ-SHED defines the Company’s “earning power” and “future value,” and upgrading partner strategy and the manufacturing system are levers for expanding corporate value.
3. Major shareholders and investment trends
An “stability dome” of core shareholders and a high proportion of individuals. A shareholder base with high event sensitivity
The largest shareholder is Noritsu Koki with a 21.58% stake, followed by Fumishige Ehira 3.22%, NANO MRNA 2.27%, Nomura Trust and Banking (trust account) 1.64%, JSR 1.56%, NINE 1.54%, and Senju Pharmaceutical 1.26%, the top ten account for 36.30% in total.
By holder category, “individuals and others” are high at 61.58%, and the number of shareholders is 11,822 (of whom 519 hold only odd-lot shares). While the breadth of individual investors secures liquidity, the structure also tends to see larger short-term price reactions to news flow.
In recent shareholding trends, the share counts of major shareholders over the past six months have remained relatively stable, and core shareholders’ stakes have been maintained at a steady level. The market value of the largest shareholder, Noritsu Koki’s holdings, is about 2.5 billion yen (based on a share price of 336 yen), which is sizeable.
Regarding capital policy, the number of shares issued increased from 43,881,013 at the end of March 2025 to 47,644,382 in 1Q FY2026/3, indicating steady progress in existing fund-raising. The Company suggests that future capital policy will basically be alliances based on business synergies, and dilution risk can be viewed as limited. The equity ratio rose from 19.1% to 30.1%, improving financial resilience.
Points to note are: (1) continued holdings by some shareholders with business synergies could support practical operations such as co-development, procurement of raw materials, and sales networks; and (2) the high proportion of individuals and the high volatility indicated by a β of 1.45 strengthen stock-price sensitivity to events such as clinical-trial progress and contract announcements. Overall, the two-layer structure of core-shareholder stability and individual-investor liquidity can amplify both the upside potential on positive news and the downside risk in headwinds, such as dilution or a worsening drug-pricing environment. It is practical to adjust exposure in an event-driven manner while monitoring movements of major shareholders (increases/decreases in stakes, deepening of alliances) and the issuer’s capital policy (handling of stock acquisition rights, convertible bonds [CB], etc.).
4. Mid-term management plan
Aiming for “consolidated operating profit in FY2026.” Lifting earning power through BS expansion, cost reduction, and manufacturing-network development
In the Company’s medium-term plan, FY2026/3 is initially positioned at net sales of 5.0–5.5 billion yen, and an operating loss of 1.0–1.7 billion yen. While achieving operating profit in FY2026 as a clear milestone. The former is a year that prioritizes development investment in cell therapy in parallel with the expansion of BS, and the latter is designed as a year in which the effect of switching to a CDMO with lower manufacturing costs comes into full play and margins improve. The numerical range and policy are indicated in financial materials.
The central axis of profit improvement is redesigning the supply system and cost structure. In May 2025, the addition of a new CDMO was approved by the Pharmaceuticals and Medical Devices Agency (PMDA), and the switch-over to the relevant API is expected to proceed from FY2026; this will push up gross margin and be a primary driver of operating profitability. Additionally, the plan is to continue revising payment terms, enhancing the CCC, and adjusting supply prices for certain products, thereby achieving both cash flow stabilization and margin improvement.
To strengthen the supply network, the Company is working with Alfresa Holdings, Chiome Bioscience, and Mycenax Biotech Inc. (MBI) and, having been selected for the “Subsidy Program for the Development of Domestic Biosimilar Manufacturing Facilities” by the MHLW, is promoting the development of manufacturing facilities at domestic candidate sites. This initiative aims to establish the first domestic supply chain, from development through manufacturing to supply, thereby strengthening the competitiveness of the BS business in the medium to long term, both in terms of stable supply and cost control.
For growth investment, based on the conclusion of Master Service Agreement (MSA) for new BS (with Chiome/MBI) and the commencement of cell-line establishment, the Company is preparing the following revenue pillars while setting a target to conclude agreements by the end of September 2025. In cell therapy, the interim analysis for pediatric cerebral palsy in December 2025 serves as a catalyst, and preparations for domestic clinical trials of the allogeneic product (GCT-103) are accelerating under a joint business agreement with Mochida Pharmaceutical. These events are positioned as measures that increase the credibility of the scenario for profitability in FY2026.
For investors, this medium-term plan is a “hybrid operation” that advances the trinity optimization of BS volume, price, and cost together with clinical progress of SQ-SHED. If the achievement of profitability in FY2026 is confirmed, an improvement in capital efficiency is highly likely to result in a valuation re-rating. Conversely, delays in CDMO switching, price negotiations, or event progress are the primary risks to the scenario; therefore, accumulating evidence through quarterly disclosures of progress in manufacturing, contracts, and clinical activities is crucial for assessing the risks.
5. Regarding international business
Optimizing scale and currencies through “domestic integration and overseas diversification.” Expanding BS sales channels and preparing for SQ-SHED’s entry into the United States
The Company’s overseas expansion proceeds on two layers: overseas sales channels for BS and diversification of manufacturing. Domestically, while promoting the development of a domestic supply chain from API through DP and distribution in collaboration with Alfresa Holdings, Chiome Bioscience, and MBI, the Taiwan CDMO (development of manufacturing facilities at domestic candidate sites) based on selection for an MHLW subsidy program, the Company also declares a breakaway from dependence on Japan and clearly states a policy of actively expanding into overseas markets through partnerships. The aims are to grow sales, reduce unit prices through economies of scale, and mitigate exchange-rate fluctuation risk by combining overseas sales with overseas manufacturing. This concept of “domestic integration and overseas diversification” optimizes the currency portfolio while achieving both supply stability and cost control.
Second is preparation for the clinical entry of cell therapy in the United States. S-Quatre has completed MCB manufacturing in accordance with FDA guidelines, and an assessment of the adequacy of overseas CROs confirmed steady progress in obtaining the data and establishing the processes required for trial applications. The Company is currently preparing for a pre-IND meeting with the U.S. FDA. On the manufacturing side as well, results of next-generation large-scale culture developed in collaboration with Corning Incorporated were presented at the International Society for Cell & Gene Therapy (ISCT), and process development is progressing with NIPRO Corporation as a CDMO with a view to late-stage clinical and commercial manufacturing. Furthermore, for GCT-103, the Company is establishing the development setup, including the selection of principal investigators and trial sites overseas, while continuing discussions with overseas partners.
There are three points. First, overseas BS sales and overseas manufacturing could simultaneously produce economies of scale and a natural hedge against exchange rates, potentially lifting medium-term profitability. Second, reaching pre-IND status for SQ-SHED and entering the first U.S. clinical trial could be a trigger for a step-change re-rating of corporate value. At the same time, the start timing is easily affected by the agreement-building process with regulators. Third, overseas collaboration with MBI, Corning, NIPRO, and others presupposes alignment of technology transfer and quality systems; delays in transfer costs or regulatory approval processes pose a risk to the timeline. Accordingly, in the short term, it is practical to monitor whether a pre-IND is conducted and its content. In the medium term, to monitor progress in overseas BS partner agreements and the development of manufacturing sites should be the main checkpoints.
6. Long-term performance
From a loss-making structure to a “monetization phase.” Stepwise expansion of net sales and restoration of the financial base
Looking at the past five fiscal years, non-consolidated net sales expanded from 970 million yen in FY2021/3 to 4.93 billion yen in FY2025/3, a four-year CAGR of about 50%. Behind this were an increased supply of launched BS and recognition of certain milestone income. As front-loaded investments in R&D and manufacturing continued, at the consolidated level, ordinary profit/loss and net profit/loss remained in loss territory (on a non-consolidated basis in FY2025/3, ordinary profit was 583 million yen, and net income was 557 million yen). The equity ratio fell to 13.2% in FY2024/3, then recovered to 25.5% in FY2025/3, effectively improving financial resilience through capital increases and revisions to profit plans.
Most recently, the Company achieved consolidated profitability in 1Q FY2026/3. This was a clear turnaround from an operating loss (159 million yen) in the same quarter of the previous year, to which planned deliveries of BS API, etc., and progress in adjustments to supply prices contributed. The Company forecasts full-year net sales within a conservative range of 5.0–5.5 billion yen and an operating loss of 1.0–1.7 billion yen, while expecting a consolidated operating profit in the following fiscal year by leveraging cost reductions through the additional approval of a new CDMO. Quarterly profit can be interpreted as a signal of strengthened earning power. At the same time, the full-year loss plan indicates continued investment in growth, such as the clinical advancement of SQ-SHED.
As for growth drivers, the expanding demand for GBS-007 (ophthalmology) and GBS-010 (cancer supportive care) is positioned as the earnings pull, and switching to a system with lower manufacturing costs is expected to increase gross margin. Furthermore, under MSA for new BS, cell-line establishment has started, progressing the preparation of future revenue pillars. On the other hand, milestone occurrences, drug price revisions, and exchange rates can lead to quarter-to-quarter volatility. Investors should examine the long-term trajectory in conjunction with the three key metrics: (1) actual trends in BS supply volume and costs; (2) continuity of CCC improvement; and (3) clinical milestones for SQ-SHED.
7. Performance in the most recent earnings results
A clear profitability in the first quarter. Adherence to BS supply and price adjustments led the way, and working capital also became healthier.
In 1Q FY2026/3 (April–June 2025), the Company achieved profitability with net sales of 1.72 billion yen (+256.3%), operating profit of 185 million yen, ordinary profit of 175 million yen, and quarterly profit attributable to owners of the parent of 157 million yen. The Company emphasizes that, in addition to planned manufacturing and deliveries of the BS API, adjustments to supply prices for certain products were also effective. Gross profit expanded to 597 million yen, making the improvement in profitability visible.
On the balance sheet, accounts receivable decreased from 1.267 billion yen to 818 million yen (a decrease of 449 million yen), work-in-process decreased from 1.475 billion yen to 985 million yen (a decrease of 490 million yen), and advances paid increased from 820 million yen to 1.386 billion yen (an increase of 566 million yen). These reflect that the API, etc., which was initiated in the previous fiscal year, was completed and delivered in the current period. The cycle worked whereby inventory was converted into cash through work-in-process, then to net sales, and finally to collections. The increase in advances paid to prepare for expanding demand is an operational choice to secure manufacturing capacity in advance. In this quarter, the decrease in accounts receivable and work-in-process offset this, and the quality of working capital is improving.
The Company revised payment terms with some partners last fiscal year and states that it is maintaining a healthy CCC this fiscal year as well. Cash and deposits were a high 2.840 billion yen, and the equity ratio recovered to 30.1%. The decreases in accounts receivable and work-in-process indicate the fulfillment of delivery plans and steady collections. At the same time, the increase in advances paid can be attributed to an advance arrangement aimed at increasing future supply volume. Investors should verify whether the continued turnover of accounts receivable, management of the level of work-in-process, and the pace of utilization of advances paid persist in subsequent quarters, thereby confirming whether the trinity of price, cost, and supply volume improvement continues.
During the quarter, the addition of a new CDMO was approved by the PMDA, and a full-scale transition to a system with lower manufacturing costs is expected to commence from FY2026. While viewing the quarterly profit as a “signal of strengthened earning power,” the health of working capital and the establishment of cost reductions are directly connected to establishing medium-term operating profitability.
8. Full-year earnings forecast
What lies behind keeping the range unchanged? Seeking upside potential through “sell-through× price adjustments × working capital.”
For FY2026/3, the Company maintains its outlook unchanged, with net sales expected to be between 5.0 and 5.5 billion yen and an operating loss of between 1.0 and 1.7 billion yen. Under its annual management policy, only the full-year results are disclosed. Factoring in the first-quarter profit, the plan remains for a consolidated loss, premised on continued R&D investment. The keys to upside are organized into three points: “volume (manufacturing/sell-through),” “price (adjustments to supply terms),” and “cash management (CCC improvement).” First, from the volume perspective, as planned deliveries progressed in the first quarter and both net sales and gross profit increased significantly, adherence to manufacturing and delivery schedules thereafter is the first condition for approaching the top of the range. Regarding price, the effectiveness of reviews of supply prices and other factors for certain products has been confirmed. The continuation/expansion of similar measures will contribute to improving the gross margin.
In working capital, the first quarter saw a significant decrease in work-in-process and accounts receivable from the previous fiscal year-end, while advances paid increased. This is the consequence of the API, etc., initiatives completed and delivered in the last fiscal year, with inventory circulating into net sales and cash. Together with the review of payment terms, the CCC remains healthy. Toward the second half, whether the speed of the cycle “work-in-process → delivery → collection” can be maintained will determine operating cash generation and the probability of achieving guidance. The Company cites the progress of multiple discussions/adjustments on manufacturing and delivery plans, new development plans, and domestic and overseas clinical plans as conditions for updating the full-year range. Its stance is to disclose a refined outlook once these matters are finalized promptly.
In the assumed environment, exchange rates are taken to be 150–160 yen/US$, where yen depreciation raises yen-based costs for overseas contract manufacturing. However, if future overseas net sales are captured, the room for a natural hedge will also expand. Currently, the domestic net sales weight is high; however, the focus is on whether price adjustments and tight management of working capital can offset headwinds from exchange rates and prices to some extent. For the current fiscal year, by steadily building up certainty of delivery, optimizing supply terms, and continuing to improve CCC, it can be organized as an approach to achieving a finish near the top of the range. Drug price revisions, expansion of competitors, and upside in exchange rates/raw material costs are downside factors. The Company itself also clearly states that the “simultaneous achievement of improved profitability and stable supply” is a structural issue. Investors should examine the quarterly trends in deliveries, prices, and collections and identify changes in positioning within the range.
9. Growth strategy and risks
Expansion on three layers—“volume, margin, and pipeline.” From stable earnings as a starting point to a leap in cell therapy
The Company’s growth strategy consists of three layers: (1) maximizing the supply of launched BS; (2) improving profitability (through price/term adjustments and cost optimization, as well as working capital improvement); and (3) accelerating SQ-SHED (cell therapy) into clinical stages. Under the hybrid business structure, it clearly indicates a cycle of reinvesting BS cash generation and accumulated manufacturing/quality know-how into cell therapy with high growth potential.
First, for BS, on the premise of stable supply and sales expansion for the four products, the Company will raise gross profit and cash generation by reviewing supply prices and payment terms with partners. At the same time, for new BS, cell-line establishment is progressing under MSA with Chiome/MBI, and business discussions with multiple domestic and overseas pharmaceutical companies are advancing, with a target of concluding agreements by the end of September 2025. To mitigate future supply bottlenecks, the Company will collaborate with Alfresa Holdings and others to establish a domestic manufacturing base, adopting a policy of increasing resilience to overseas dependence on stable supply and manufacturing costs, as well as to geopolitical risks and exchange-rate fluctuations.
For SQ-SHED, clinical research in pediatric cerebral palsy has reached final administration, with an interim analysis expected around December 2025. The allogeneic product (GCT-103) is being jointly developed with Mochida Pharmaceutical, with preparations for domestic clinical trials proceeding in parallel. Congenital isolated hypoganglionosis (GCT-102), a rare disease, was selected by AMED (April 2025), and ischemic bone disease is also being developed through university–industry collaboration. In manufacturing, the Company is advancing the establishment of MCB, developing large-scale culture processes, and transferring technology to a CDMO, gradually increasing supply capacity with a view to late-stage clinical and commercial manufacturing.
The principal risks are: (1) downward pressure on BS prices from drug price revisions and competitor entry; (2) delays in quality/supply (outsourcing, technology transfer, responses to authorities); (3) uncertainty in efficacy and regulatory review for cell therapy; (4) upside in manufacturing costs due to exchange rates and rising prices; and (5) potential fund-raising/dilution. The Company itself lists as priority issues the impacts of the pricing environment and yen depreciation on costs and margins, as well as the optimization of the supply system and cash management.
From an investor perspective, in the short term, BS’s earning power should be checked via trends in sell-through, price adjustments, and CCC; in the medium term, the focus should be on contracting for new BS and progress in domestic manufacturing development, and in cell therapy, on the speed of transition from interim analysis to trial entry. The accumulation of these results supports a scenario of sustained profitability from FY2026 onward and a redefinition of valuation (from a biotech venture to an “viable pharmaceutical enterprise”).
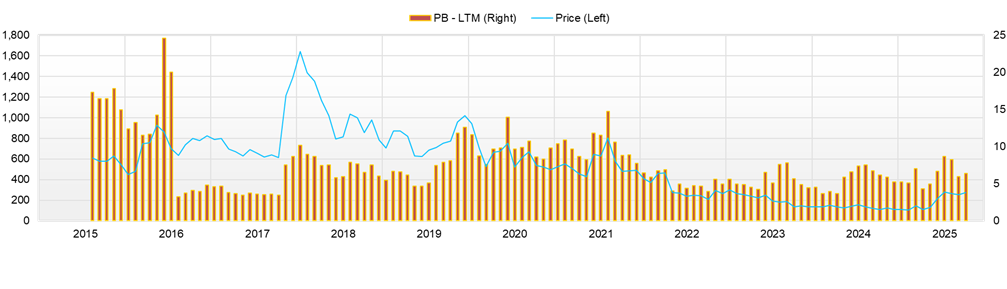
10. Stock price trends and equity valuation
Round-trip in an “event-driven market.” June 25 high of 417 yen → August 21 close of 258 yen; level correction after overheating
From January 1 to August 21, 2025, the stock price began the year in the low 100-yen range (e.g., a closing price of 107 yen on January 6) and remained relatively stable. Thereafter, following the full-year earnings announcement on May 13, the uptrend strengthened with higher volume, and the price reached the 200-yen range in late May (closing price of 129 yen on May 13 → 214 yen on May 30). In June, speculation and news overlapped, and the stock surged, marking a YTD high of 417 yen on June 25. After overheating, however, the stock entered a correction due to profit-taking and the quick turnover of short-term money; the latest close on August 21 is 258 yen (−38% from the high). On August 14, the day after the 1Q results were released on August 13, the closing price jumped from 256 yen to 336 yen (+31%), with volume of 10.348 million shares, reconfirming the high sensitivity to events. Year-to-date, the level remains more than double, and the view is that events such as “earnings/disclosures/agreements” will continue to govern short-term trends.
Valuation is based on a market capitalization of 12.9 billion yen and a PBR of 6.35x; however, profit-based metrics (PER, EV/EBITDA) have limited reference value due to the full-year loss plan. Capital efficiency is low at ROE −2.1% / ROA −0.3%, but if profit-turn momentum and improvements in costs and working capital continue, there is room to verify the realization of the “future-profit-expectation premium” in PBR.
The most significant short-term risk is the volatility that accompanies the forward or backward scheduling of events. While the stock was aggressively bought at one point on August 14 following the first-quarter return to profit, it was pushed back the following week on a reversal in supply and demand, indicating that the price is strongly linked to the freshness of news flow. The negotiations for the new BS are scheduled to conclude around the end of September. The analysis for SQ-SHED cerebral palsy is expected in December, and disclosures of manufacturing/delivery results are “two-sided triggers” that can swing either positively or negatively. If expectations are exceeded, a short-term surge is possible. If timing is delayed or data interpretation falls below market consensus, profit-taking tends to take the lead. In a structure where pre-positioning builds up before events, attention should also be paid to the likelihood of “sell the fact.”
Second is the margin of supply and demand. As of August 15, the margin balance ratio was an extremely skewed 1,453x (minimal short balance and a heavy long balance). While the market favors buyers, in phases where the trend breaks down, there is a tendency for chain reactions of dumping and failed short squeezes. The buildup of margin positions contributes to higher volume. Still, a skewed supply–demand imbalance impairs price elasticity, embedding the risk that negative news or a market-wide risk-off alone will drive a rapid level correction. The observed volume spike (August 14: 10.348 million shares) also suggests inflows and outflows of short-term event-driven money; technical risk management, such as stop orders and phased profit-taking, is practical.
Third is capital policy and the free float. The Company indicates a policy of not raising funds other than capital alliances premised on “business synergy,” using existing financing. Specifically, BS working capital will be addressed mainly through indirect finance. Funding for new BS development will also be structured flexibly in the form of alliances, with a limited cost burden. In addition, while core shareholders are stable, the high ratio of individual investors amplifies price sensitivity to news. Even if core selling is limited, in phases where daily volatility expands due to the turnover of short-term players, both countertrend rises, and countertrend declines can occur.
Fourth are the system and macro environment. Discussions on drug price revisions and potential upside in raw material and outsourcing costs, due to an entrenched weak yen, can shake cost assumptions. While there is some room for offset this fiscal year through the operation of “volume (manufacturing/delivery) × price (supply terms) × working capital (CCC),” when external shocks coincide with the event schedule, it is undeniable that stop-loss selling unrelated to fundamentals can emerge. Overall, for the time being it is realistic to monitor at high frequency: (1) event timelines (agreements/analyses/deliveries); (2) margin supply–demand (balance of margin buying/short sales, volume spikes); (3) capital policy (signs of dilution); and (4) systems/exchange rates (drug pricing, the yen), with a two-layer holding approach—core for the medium term and satellites traded nimbly around events.
11. Investment conclusion based on performance and stock price analysis
“Advance in stages” centered on “actual profit-turn and operational improvements.” Make nimble adjustments around events
Based on strengthened earnings power and operational improvements confirmed in the first quarter, it is worth considering a phased increase in exposure. As for the facts, 1Q FY2026/3 clearly returned to profit, and price adjustments and progress in deliveries pushed up gross profit. Furthermore, the decrease in accounts receivable and work-in-process, along with the buildup of advances paid, has normalized the manufacturing → delivery → collection cycle, contributing to stable cash management in the second half.
The Company expects to maintain a full-year net sales range of 5.0–5.5 billion yen and an operating loss of 1.0–1.7 billion yen, based on continued growth investments centered on cell therapy. Therefore, it should not be forgotten that this is a phase in which short-term “profit results” and full-year “front-loaded investment” coexist. This structure aligns with the Company’s hybrid approach to biosimilars (stable earnings) and SQ-SHED (growth investment), which is rational in the context of maximizing corporate value over the medium term.
As investment actions, monitor as main KPIs (1) the degree of sell-through of manufacturing and deliveries and the trend in gross profit quarterly, (2) the sustainability of optimization of supply terms (price/payment terms), and (3) working-capital turnover (accounts receivable / work-in-process / advances paid), and increase core holdings in stages in line with the accumulation of actual results. Handle events (agreements, analyses, etc.) nimbly with satellites, and in overheated phases, take partial profits to curb risk. As external factors, drug pricing, competition, and exchange rates can compress margins; therefore, when evaluating, prioritize position management.
While “the initial move toward profitability” is being confirmed this fiscal year, this is a phase to build gradually in line with actual results. While accepting volatility, as long as indicators continue to improve, we recommend a “slightly bullish, phased approach” aiming to capture a re-rating over the medium term.
12. Transition and current assessment of ROE (return on equity)
Reverse the “loss-making numerator” and make use of the thickness of the denominator. A phase to connect the actual profit-turn to improvement in ROE
The Company’s equity ratio clearly improved from 19.1% (end of FY2025/3) to 30.1% (end of 1Q FY2026/3), increasing the thickness of net assets and the safety margin. 1Q FY2026/3 returned to profit, and the numerator of ROE (profit for the period) has turned positive quarterly. These can be taken as signs that indicate both the “foundation” and the “initial move” of ROE improvement.
Even so, the Company keeps its plan for a full-year operating loss in a range of 1.0–1.7 billion yen, showing a stance of operating on an annual basis with ROE in negative territory. Accordingly, the current evaluation axis shifts to “while confirming the continuity of quarterly profits, how far the annual loss can be narrowed.” The closer the numerator’s improvement is sustained and the annual result approaches a profit-turn, the more a net improvement (settling in the positive) in ROE from the next fiscal year onward comes into view.
There are three practical points to consider when raising the numerator (profitability) and the denominator (equity/assets turnover) simultaneously. First, continue the recovery in gross profit. In the first quarter, on-schedule manufacturing and deliveries, along with a review of certain supply terms, contributed to an increase in gross profit. Whether this trend can be sustained quarter by quarter is the key. Second, improve working-capital turnover. In the first quarter, accounts receivable and work-in-process decreased from the previous fiscal year-end, offsetting the buildup of advances paid, and the cycle of cash conversion functioned as expected. Improvement in asset turnover is directly linked to lifting ROE. Third, strike a balance between agility in capital policy and control of dilution. The number of shares issued has recently increased, and we should continue to watch the balance between growth investment and dilution.
From an investment perspective, rather than following ROE only as a result indicator, verify quarterly the leading KPIs, (1) sequential improvement in gross margin, (2) turnover of accounts receivable and work-in-process (including the pace of utilization of advances paid), and (3) control of the growth in SG&A, and determine whether sustained profitability in the numerator × efficiency in the denominator are running in parallel. In a phase where these are aligned, expectations for future ROE improvement, embedded in a high PBR, are underpinned by actual results, contributing to the stabilization of evaluation. Intermittent profitability or a rekindling of dilution can impair the ROE trend; therefore, an operation that combines monitoring of actual results and nimble position adjustments around event periods is realistic.
13. Analysis of economic value creation based on ROIC and WACC
Raise ROIC through “gross profit and turnover.” Turn quarterly profitability into tangible capital efficiency
This section examines the dynamics of ROIC (NOPAT / invested capital) and WACC on a consolidated basis. The starting point is the reversal on the numerator side in the latest first quarter, from operating profit to bottom-line profit. In the first quarter, the Company turned a profit with net sales of 1.72 billion yen, an operating profit of 184 million yen, and a quarterly profit attributable to the owners of the parent of 157 million yen. The numerator of ROIC (equivalent to after-tax operating profit) also turned positive. At the same time, the equity ratio improved from 19.1% to 30.1%, indicating a healthier capital structure. These are quantitative signals that indicate “the initial move to improve ROIC.”
On the denominator (invested capital), in the first quarter, accounts receivable decreased from 1.267 billion yen to 818 million yen, work-in-process decreased from 1.475 billion yen to 985 million yen, and advances paid increased from 820 million yen to 1.386 billion yen. Cash and deposits totaled 2.840 billion yen, and fixed assets amounted to 360 million yen. These movements indicate that the API, etc., initiated in the previous fiscal year circulated in the current period from inventory to net sales to collection, thereby improving the quality of working capital. If invested capital is narrowed to “capital required to generate operating cash,” compression of AR/WIP and maintaining turnover speed are directly linked to effective improvement in ROIC.
Regarding WACC, while financial resilience is strengthened by a higher equity ratio and ample on-hand liquidity, given the risk characteristics indicated by a stock β of 1.45, it is realistic for the time being to focus on raising ROIC rather than significantly lowering the cost of capital. That is, in the short term, stack up in a trinity (1) sequential improvement in gross profit, (2) management of working-capital turnover (controlling the levels of AR/WIP and the planned utilization of advances paid), and (3) restraint in the growth of SG&A, and operate to raise both numerator and denominator at the same time.
The practical monitoring indicators are clear. Track quarterly the trend in gross margin, net working capital / net sales, and invested capital turnover, and verify whether sustained profitability and improvement in turnover efficiency are proceeding in parallel. In addition, for this Company, with small fixed assets and substantial cash, using “effective ROIC” that deducts excess cash from invested capital, together with regular ROIC, makes the actual capital efficiency of the business clearer. In a phase where these KPIs accumulate, a crossover of ROIC greater than WACC comes into view, and actual results underpin the expectations embedded in PBR. On the other hand, re-expansion of AR/WIP, a slowing of turnover, or a leading rise in SG&A hinders the extension of ROIC; therefore, adherence to supply plans and discipline in collection are prerequisites for economic value creation.
14. Corporate value creation capability as seen from free cash flow and capital allocation
The ability to execute “FCF = gross profit − changes in working capital − investment.” The design for the utilization of advances paid is the key
The Company’s FCF is relatively less affected by CAPEX because it does not carry heavy manufacturing assets; in practice, the determining factors are maintenance of gross profit and the turnover of working capital (particularly advances paid, work-in-process, and accounts receivable). In the first quarter, accounts receivable and work-in-process decreased. At the same time, advances paid increased in preparation for the expected rise in demand, reflecting the cycle whereby API, etc., initiated in the previous fiscal year was moved to delivery and collection in the current period. Cash and deposits are also at a high level, and stable cash management can be confirmed. From the next quarter onward, whether sell-through proceeds according to the “schedule” of advances paid → manufacturing → delivery → collection will be the swing factor for FCF.
The priorities in capital allocation can be interpreted as follows: (1) normalization of working capital and stable supply, (2) reinvestment in R&D (including clinical/CMC), and (3) development of future production/supply infrastructure. Optimization of working capital, including a review of payment terms, is a continuing policy designed to facilitate growth investments without impairing short-term cash generation. Returns to shareholders are currently zero, as dividends; cash will be allocated to business expansion and securing financial headroom for the time being.
The KPIs to follow are three: (a) FCF / net sales (conversion), (b) net working capital / net sales (the pace of utilization of advances paid and management of the levels of accounts receivable and work-in-process), and (c) seasonality and concentration in operating cash flow. Among these, (b) can quantify the Company-specific “expansion/contraction,” where if the concentration of advances paid persists for a long time, FCF can be temporarily pressured. At the same time, if deliveries and collections proceed, there is a quick reversal through the compression of inventory/receivables, resulting in cash generation. Given the light structure of fixed assets, if effectively invested capital after deducting excess cash is utilized, and read in conjunction with ROIC, a clearer picture of cash-generation power emerges. Overall, FCF is more sensitive to the skill of turnover design than to “price × cost.” As long as discipline in processes and collection is maintained, high on-hand liquidity serves as a buffer against downside risks.
15. Future possibilities of shareholder return policy and evaluation of past results
An “earn first” policy under continued zero dividends. A phase to connect the establishment of profitability and stabilization of FCF to the start of returns
Shareholder returns are currently zero dividends. Both the previous fiscal year’s result and the current fiscal year’s forecast are 0.00 yen, and no interim dividend is set. A stance that prioritizes business growth and financial stability over returns is confirmed. In capital policy, the number of shares issued increased from 43,881,013 (as of the end of FY2025/3) to 47,644,382 (as of the end of 1Q FY2026/3). In the background, stock acquisition rights were exercised, and some convertible bonds were converted, increasing net assets. While these involve short-term dilution, they are positioned as measures that contribute to strengthening financial resilience.
By interpretation, the Company gives top priority for the time being to normalizing working capital and strengthening its earning power. In fact, in the first quarter, gross profit grew through on-schedule manufacturing and deliveries, as well as a review of supply terms and improvements in the inventory cycle, including compression of accounts receivable and work-in-process. It also clearly states that it will continue to review payment terms and maintain a healthy CCC, indicating a tilt toward “cash-generating operations” that directly lead to stabilization of FCF. The source of capacity for returns lies precisely in this simultaneous improvement in gross profit and turnover.
As for future possibilities, the keys are first the continuity of profitability and stabilization of positive FCF. The Company sets “achievement of operating profit (FY2026)” as a milestone; it is reasonable to view the realistic timing for examining a return policy as after this milestone is established. The equity ratio has improved from 19.1% to a higher level, thereby increasing the financial cushion. Accordingly, in a phase where (1) quarterly profitability is sustained, (2) net working capital is tightened. CCC is shortened, and (3) dilution events subside, the room to consider resuming dividends and implementing flexible capital measures increases. The official guidance at present is zero dividends, but the value remains as a future “option.”
The critical point is not to price in returns ahead of time, but to adjust expectations in line with the accumulation of actual KPIs. Specifically, monitor whether dividend forecasts are updated, the trajectory of quarterly operating CF / net sales and net working capital / net sales, and trends in capital policy (stock acquisition rights, CB, etc.), and it is realistic to raise evaluation at the timing when the shift from a “earn first” policy to “distribution after earning” becomes visible.
16. Corporate value assessment (DCF, PER/PBR analysis)
Support the premium with actual results. Lift corporate value through improved gross profit and more substantial turnover.
The key metrics of the Company’s evaluation are a PBR of 6.35x and a market capitalization of 12.9 billion yen. The PBR > 1 condition holds while the ROE is negative, assuming continued momentum toward profitability and the embodiment of profit. In fact, the first quarter returned to profit, primarily due to the recovery in gross profit through planned deliveries and a review of supply terms. How investors discount this “initial move” will determine the durability of the current premium.
Until profitability is established, it is effective to confirm footing with the relatively stable yardstick of PSR (market capitalization / net sales). Against the Company’s full-year range of net sales of 5.0–5.5 billion yen, PSR is approximately 2.35–2.58 times that amount. This multiple gain persuasiveness is achieved through sequential improvements in quarterly gross margin, effective management of inventory turnover receivables/advances paid, as well as adherence to manufacturing and delivery schedules. On the other hand, if there is a re-expansion of working capital or delays in deliveries, pressure to lower the multiple is likely to be strong. As of the first quarter, accounts receivable and work-in-process are shrinking, and signs of improvement in the cycle can be confirmed.
DCF has extremely high sensitivity before profitability is established. For the time being, keep it to “confirming direction,” and determine whether (i) sequential improvement in gross profit, (ii) maintenance/shortening of turnover, and (iii) control of the growth in SG&A are realized for two to three consecutive quarters. If these align, the range of future FCF narrows, and only then does the explanatory power of DCF rise. Conversely, if “implementation” is stalled by shifts in event timing or headwinds from drug pricing and exchange rates, the unwind of the PBR premium is quick.
In conclusion, the current evaluation is “expectations ahead, waiting for embodiment of results,” but in the first quarter, the starting signs of recovery in gross profit and improvement in turnover are present; assuming maintenance of the PSR range, increase exposure in stages when gross profit, turnover, and deliveries come together. What supports the premium is not “words” but the accumulation of quarterly KPIs.
17. Comparative multiple analysis with peers
PBR reflects “the quality of expectations.” Maturity at JCR, loss tolerance at NANO and SymBio, and the Company’s event premium
For comparison, three peers are JCR Pharmaceuticals, NANO MRNA, and SymBio Pharmaceuticals. JCR Pharmaceuticals, with a market capitalization of approximately 82.2 billion yen and a PBR of 1.67x, is in a relatively calm range within the industry, characterized as a “mature stock” due to its record of dividend payments and established profit plans. NANO MRNA has a market capitalization of about 10.9 billion yen and a PBR of 4.04x, and SymBio Pharmaceuticals has about 7.5 billion yen and a PBR of 3.69x; for both, PER has a low reference value because loss plans are assumed, and the main point of evaluation is how much to price in future improvement in capital efficiency.
Based on the Company’s evaluation—market capitalization of 12.9 billion yen, PBR of 6.35x, ROE of −2.1%, ROA of −0.3%, and β of 1.45—it is positioned in the highest PBR range among its three peers. This can be interpreted as a premium that reflects “the quality of expectations,” namely, in addition to sales results and operational improvements in biosimilars, eventful catalysts such as the pipeline and agreements lining up in the near future. On the other hand, the point that ROE is currently negative also suggests that monetization of expectations and embodiment of profit are conditions for sustaining evaluation.
We should also note structural differences. JCR Pharmaceuticals has in-house manufacturing and sales functions, as well as a relatively high level of profit reproducibility. At the same time, the speed of expanding its business portfolio is easily affected by systems and drug pricing. NANO MRNA and SymBio Pharmaceuticals generate stock-price elasticity through development and alliance strategies despite incurring losses, and exhibit high sensitivity to news flow. By contrast, the Company has a “two-layer structure,” which raises current gross profit and improves the cash cycle through volume and price operations in biosimilars, while building data and negotiating business development in cell therapy —a relative strength, as it diversifies the sources of its premium.
As investment implications, rather than starting evaluation with the level of PBR in a side-by-side comparison, an approach of fixed-point observation of “conditions for sustaining the premium”, (1) quarterly gross margin and turnover (trends in inventory, receivables, and advances paid), (2) profit landing after events (whether guidance is updated), and (3) stability of shareholder base and capital policy—is effective. Given JCR Pharmaceuticals’ stable range and the event elasticity of NANO MRNA / SymBio Pharmaceuticals, the Company’s current premium is reasonable as long as the accumulation of actual results continues. Still, a verification-first approach at the branch points of data, agreements, and deliveries is indispensable for risk management.
| Company name | Securities code | Market capitalization (billion yen) |
PBR (X) |
ROE (actual) |
Equity ratio (actual) |
| Kidswell Bio | 4584 | 12.9 | 6.35 | −2.1% | 30.1% |
| JCR Pharmaceuticals | 4552 | 81.57 | 1.66 | −9.30% | 44.8% |
| NANO MRNA | 4571 | 10.87 | 4.04 | −27.24% | 68.2% |
| SymBio Pharmaceuticals | 4582 | 7.47 | 3.69 | −70.90% | 78.1% |
18. Competitive advantages and strategy of the pipeline and market size
Attack on two layers of “mass production of BS and the lead of SQ-SHED.” Raise the probability of commercialization centered on manufacturing and alliances
The Company’s pipeline has two layers: BS as the earnings base and SQ-SHED as the growth option. For BS, under MSA with Chiome/MBI, the Company has commenced cell-line establishment and set the conclusion of agreements for new BS (scheduled for the end of September 2025). In addition, by being selected for the development of domestic manufacturing facilities, it aims to create an integrated system from drug substance to drug product supply, thereby strengthening both cost and BCP simultaneously. For SQ-SHED, in pediatric cerebral palsy (GCT-103), autologous administration has progressed to the final stage, and the allogeneic product is being jointly commercialized with Mochida Pharmaceutical, with preparations for domestic clinical trials in progress. An operation that advances clinical work and manufacturing (MCB, large-scale culture, technology transfer) in parallel is the differentiating factor.
Risks include downward pressure on BS prices due to drug pricing and competitors, as well as quality and timelines in outsourcing/transfer, and uncertainty regarding efficacy and regulatory agreements for SQ-SHED. On the other hand, opportunities include improving gross profit through optimization of the BS supply network and price terms, as well as the possibility that SQ-SHED can take a first-mover advantage in unmet pediatric and rare disease areas. Funding will, for the time being, be covered mainly by BS cash, and in SQ-SHED, it is rational to leverage external resources through joint commercialization.
Market size (domestic; estimate of patient-number TAM)
• Cerebral palsy: with 686,000 domestic births (2024) and an incidence of 1.7 per 1,000 births, about 1,200 new cases per year. The stock in the chronic phase is even larger. This is an area with high earnings elasticity depending on price setting.
• Congenital isolated hypoganglionosis: a designated intractable disease that is extremely rare. While public domestic incidence figures are not available, if Hirschsprung’s disease, a related condition, at approximately 1 per 5,000 births, is used as an upper-bound reference, the scale is 100–150 cases per year (the actual number is likely lower than this).
• Ischemic bone disease (such as osteonecrosis of the femoral head): about 2,100 new patients per year domestically, and about 23,000 prevalent cases are estimated. Mainly adults, with expected demand for functional recovery before and after surgery.
In conclusion, while raising current profitability through the mass production of BS and optimization of prices, if SHED can establish a first-mover manufacturing advantage in pediatric and rare disease areas, re-ratings at each event can be expected. The markets have high actuality on a patient-by-patient basis, and the two key components of clinical data and supply implementation are essential for monetization.
Key stock price data
Key financial data
| Unit: million yen | 2020 | 2021 | 2022 | 2023 | 2024 | 2025 CE |
| Sales | 997 | 1,569 | 2,776 | 2,431 | 5,082 | 5,000 〜5,500 |
| EBIT (Operating Income) | -970 | -976 | -551 | -1,336 | 28 | -1,000 〜-1,700 |
| Pretax Income | -1,000 | -550 | -656 | -1,421 | 73 | |
| Net Profit Attributable to Owner of Parent | -1,001 | -551 | -657 | -1,422 | -21 | |
| Cash & deposits | 1,461 | 1,161 | 1,067 | 2,231 | 2,995 | |
| Total assets | 3,934 | 3,470 | 3,895 | 5,086 | 7,008 | |
| Total Debt | 1,100 | 700 | 1,950 | 2,575 | 1,838 | |
| Net Debt | -361 | -461 | 883 | 344 | -1,157 | |
| Total liabilities | 2,324 | 1,767 | 2,661 | 4,254 | 5,598 | |
| Total Shareholders’ Equity | 1,610 | 1,703 | 1,234 | 831 | 1,411 | |
| Net Operating Cash Flow | -1,267 | -1,170 | -1,421 | -454 | 937 | |
| Capital Expenditure | 3 | 0 | 0 | 0 | 6 | |
| Net Investing Cash Flow | -22 | 527 | -29 | 0 | 65 | |
| Net Financing Cash Flow | 718 | 369 | 1,356 | 1,618 | -240 | |
| ROA (%) | -26.61 | -14.88 | -17.85 | -31.67 | -0.35 | |
| ROE (%) | -64.66 | -33.25 | -44.78 | -137.73 | -1.89 | |
| EPS (Yen) | -34.8 | -17.9 | -20.8 | -40.2 | -0.5 | |
| BPS (Yen) | 54.4 | 54.2 | 38.5 | 21.4 | 32.2 | |
| Dividend per Share (Yen) | 0.00 | 0.00 | 0.00 | 0.00 | 0.00 | |
| Shares Outstanding (Million shares) | 29.06 | 31.44 | 31.90 | 37.31 | 40.66 |
Source: Omega Investment from company data, rounded to the nearest whole number
Share price
Financial data (quarterly basis)
| Unit: million yen | 2023/3 | 2024/3 | 2025/3 | ||||||
| 1Q | 2Q | 3Q | 4Q | 1Q | 2Q | 3Q | 4Q | 1Q | |
| (Income Statement) | |||||||||
| Sales | 46 | 536 | 985 | 864 | 483 | 1,267 | 1,286 | 2,046 | 1,721 |
| Year-on-year | -92.5% | 6.1% | 61.3% | -17.6% | 950.4% | 136.4% | 30.6% | 136.6% | 256.3% |
| Cost of Goods Sold (COGS) | 1 | 351 | 352 | 688 | 259 | 998 | 748 | 1,436 | 1,123 |
| Gross Income | 45 | 185 | 633 | 176 | 224 | 269 | 538 | 610 | 597 |
| Gross Income Margin | 98.1% | 34.5% | 64.3% | 20.4% | 46.3% | 21.2% | 41.8% | 29.8% | 34.7% |
| SG&A Expense | 500 | 449 | 580 | 845 | 383 | 372 | 414 | 444 | 413 |
| EBIT (Operating Income) | -455 | -265 | 53 | -669 | -159 | -104 | 125 | 166 | 185 |
| Year-on-year | 1097.7% | -638.6% | -135.9% | 60.9% | -65.1% | -60.9% | 136.8% | -124.8% | -216.2% |
| Operating Income Margin | -989.7% | -49.4% | 5.3% | -77.3% | -32.9% | -8.2% | 9.7% | 8.1% | 10.7% |
| EBITDA | -455 | -264 | 53 | -668 | -159 | -103 | 125 | 166 | 185 |
| Pretax Income | -470 | -309 | 35 | -676 | -176 | -65 | 107 | 207 | 176 |
| Consolidated Net Income | -471 | -310 | 33 | -675 | -177 | -65 | 54 | 167 | 157 |
| Minority Interest | 0 | 0 | 0 | 0 | 0 | 0 | 0 | 0 | 0 |
| Net Income ATOP | -471 | -310 | 33 | -675 | -177 | -65 | 54 | 167 | 157 |
| Year-on-year | 481.4% | -909.1% | -121.6% | 45.9% | -62.5% | -79.0% | 64.4% | -124.7% | -188.9% |
| Net Income Margin | -1023.6% | -57.8% | 3.3% | -78.0% | -36.6% | -5.1% | 4.2% | 8.1% | 9.1% |
| (Balance Sheet) | |||||||||
| Cash & deposits | 625 | 622 | 2,187 | 2,231 | 1,167 | 1,695 | 1,318 | 2,995 | 2,840 |
| Total assets | 3,044 | 3,194 | 5,199 | 5,086 | 4,609 | 4,646 | 4,575 | 7,008 | 6,579 |
| Total Debt | 1,850 | 1,775 | 2,275 | 2,575 | 2,402 | 2,131 | 2,034 | 1,838 | 1,549 |
| Net Debt | 1,225 | 1,153 | 88 | 344 | 1,235 | 436 | 715 | -1,157 | -1,291 |
| Total liabilities | 2,276 | 2,119 | 3,755 | 4,254 | 3,895 | 3,789 | 3,523 | 5,598 | 4,531 |
| Total Sharehjolders’ Equity | 769 | 1,075 | 1,444 | 831 | 714 | 857 | 1,052 | 1,411 | 2,048 |
| (Profitability %) | |||||||||
| ROA | -28.50 | -37.43 | -25.82 | -31.67 | -29.48 | -22.54 | -17.65 | -0.35 | 5.59 |
| ROE | -86.81 | -100.55 | -77.27 | -137.73 | -152.15 | -91.46 | -69.11 | -1.89 | 22.64 |
| (Per-share) Unit: JPY | |||||||||
| EPS | -14.7 | -9.3 | 0.9 | -17.5 | -4.5 | -1.6 | 1.3 | 3.8 | 3.3 |
| BPS | 24.0 | 30.0 | 37.6 | 21.4 | 18.1 | 21.1 | 25.9 | 32.2 | 43.0 |
| Dividend per Share | 0.00 | 0.00 | 0.00 | 0.00 | 0.00 | 0.00 | 0.00 | 0.00 | 0.00 |
| Shares Outstanding (milion shares) | 32.06 | 37.09 | 37.31 | 38.43 | 39.41 | 40.66 | 40.66 | 43.88 | 47.63 |
Source: Omega Investment from company data, rounded to the nearest whole number
Financial data (full-year basis)
| Unit: million yen | 2015 | 2016 | 2017 | 2018 | 2019 | 2020 | 2021 | 2022 | 2023 | 2024 |
| (Income Statement) | ||||||||||
| Sales | 1,161 | 1,089 | 1,060 | 1,022 | 1,078 | 997 | 1,569 | 2,776 | 2,431 | 5,082 |
| Year-on-year | 1817.7% | -6.2% | -2.7% | -3.6% | 5.5% | -7.5% | 57.5% | 76.9% | -12.4% | 109.0% |
| Cost of Goods Sold | 501 | 398 | 423 | 413 | 653 | 120 | 553 | 1,251 | 1,393 | 3,443 |
| Gross Income | 660 | 692 | 637 | 609 | 425 | 877 | 1,017 | 1,525 | 1,038 | 1,639 |
| Gross Income Margin | 56.9% | 63.5% | 60.1% | 59.6% | 39.4% | 88.0% | 64.8% | 54.9% | 42.7% | 32.3% |
| SG&A Expense | 1,480 | 1,876 | 1,551 | 1,414 | 1,586 | 1,847 | 1,992 | 2,076 | 2,374 | 1,611 |
| EBIT (Operating Income) | -820 | -1,184 | -913 | -806 | -1,161 | -970 | -976 | -551 | -1,336 | 28 |
| Year-on-year | 129.1% | 44.4% | -22.9% | -11.8% | 44.2% | -16.5% | 0.6% | -43.5% | 142.4% | -102.1% |
| Operating Income Margin | -70.7% | -108.7% | -86.2% | -78.8% | -107.8% | -97.3% | -62.2% | -19.8% | -54.9% | 0.5% |
| EBITDA | -820 | -1,184 | -913 | -805 | -1,161 | -969 | -973 | -550 | -1,335 | 29 |
| Pretax Income | -786 | -1,222 | -903 | -854 | -7,314 | -1,000 | -550 | -656 | -1,421 | 73 |
| Consolidated Net Income | -788 | -1,225 | -905 | -856 | -7,316 | -1,001 | -551 | -657 | -1,422 | -21 |
| Minority Interest | 0 | 0 | 0 | 0 | 0 | 0 | 0 | 0 | 0 | 0 |
| Net Income ATOP | -788 | -1,225 | -905 | -856 | -7,316 | -1,001 | -551 | -657 | -1,422 | -21 |
| Year-on-year | 108.9% | 55.5% | -26.1% | -5.3% | 754.4% | -86.3% | -45.0% | 19.3% | 116.3% | -98.5% |
| Net Income Margin | -67.9% | -112.4% | -85.4% | -83.8% | -678.9% | -100.5% | -35.1% | -23.7% | -58.5% | -0.4% |
| (Balance Sheet) | ||||||||||
| Cash & Deposits | 817 | 2,380 | 1,891 | 2,009 | 2,033 | 1,461 | 1,161 | 1,067 | 2,231 | 2,995 |
| Total assets | 1,694 | 3,706 | 3,025 | 3,151 | 3,592 | 3,934 | 3,470 | 3,895 | 5,086 | 7,008 |
| Total Debt | 810 | 0 | 0 | 0 | 1,225 | 1,100 | 700 | 1,950 | 2,575 | 1,838 |
| Net Debt | -7 | -2,380 | -1,891 | -2,009 | -808 | -361 | -461 | 883 | 344 | -1,157 |
| Total liabilities | 1,291 | 206 | 421 | 420 | 2,105 | 2,324 | 1,767 | 2,661 | 4,254 | 5,598 |
| Total Shareholders’ Equity | 403 | 3,500 | 2,604 | 2,731 | 1,487 | 1,610 | 1,703 | 1,234 | 831 | 1,411 |
| (Cash Flow) | ||||||||||
| Net Operating Cash Flow | -607 | -1,759 | -438 | -860 | -1,325 | -1,267 | -1,170 | -1,421 | -454 | 937 |
| Capital Expenditure | 2 | 0 | 0 | 0 | 2 | 3 | 0 | 0 | 0 | 6 |
| Net Investing Cash Flow | -122 | -150 | -50 | -0 | -137 | -22 | 527 | -29 | 0 | 65 |
| Net Financing Cash Flow | 947 | 3,472 | 0 | 978 | 1,222 | 718 | 369 | 1,356 | 1,618 | -240 |
| (Profitability ) | ||||||||||
| ROA (%) | -60.21 | -45.35 | -26.88 | -27.73 | -216.99 | -26.61 | -14.88 | -17.85 | -31.67 | -0.35 |
| ROE (%) | -122.00 | -62.74 | -29.64 | -32.10 | -346.86 | -64.66 | -33.25 | -44.78 | -137.73 | -1.89 |
| Net Margin (%) | -67.85 | -112.41 | -85.36 | -83.81 | -678.87 | -100.49 | -35.10 | -23.68 | -58.49 | -0.42 |
| Asset Turn | 0.89 | 0.40 | 0.31 | 0.33 | 0.32 | 0.26 | 0.42 | 0.75 | 0.54 | 0.84 |
| Assets/Equity | 2.03 | 1.38 | 1.10 | 1.16 | 1.60 | 2.43 | 2.23 | 2.51 | 4.35 | 5.39 |
| (Per-share) Unit: JPY | ||||||||||
| EPS | -75.7 | -68.5 | -47.3 | -43.8 | -264.7 | -34.8 | -17.9 | -20.8 | -40.2 | -0.5 |
| BPS | 34.9 | 182.9 | 136.1 | 134.3 | 53.8 | 54.4 | 54.2 | 38.5 | 21.4 | 32.2 |
| Dividend per Share | 0.00 | 0.00 | 0.00 | 0.00 | 0.00 | 0.00 | 0.00 | 0.00 | 0.00 | 0.00 |
| Shares Outstanding (million shares) | 10.85 | 18.74 | 19.14 | 19.68 | 27.65 | 29.06 | 31.44 | 31.90 | 37.31 | 40.66 |
Source: Omega Investment from company data, rounded to the nearest whole number