2026-06-26
Home
Japanese

Omega Investment Co., Ltd.
TAKARA & COMPANY (Investment report – Basic)
| Share price (9/18) | ¥4,060 | Dividend Yield (26/5 CE) | 3.0 % |
| 52weeks high/low | ¥2,577/4,180 | ROE(25/5 act) | 14.1 % |
| Avg Vol (3 month) | 26.8 thou shrs | Operating margin (25/5 act) | 13.6 % |
| Market Cap | ¥53.40 bn | Beta (5Y Monthly) | 0.7 |
| Enterprise Value | ¥33.46 bn | Shares Outstanding | 13.153 mn shrs |
| PER (26/5 CE) | 17.0 X | Listed market | TSE Prime section |
| PBR (25/5 act) | 1.7 X |
| Click here for the PDF version of this page |
| PDF version |
Time to turn abundant cash into a weapon.
Focusing on TAKARA & COMPANY’s potential for improved capital efficiency.
Conclusion
A solid financial base and expectations for improved capital efficiency. A steady management model with medium-to long-term investment appeal.
TAKARA & COMPANY LTD. (“TAKARA & COMPANY”) has positioned the Disclosure-related business and the Interpreting & Translation business at its core and has sought to enhance shareholder value through steady growth and prudent financial management. Since FY2019/5, net sales have achieved stable growth, reaching 29.6 billion yen (+1.4% YoY) in FY2025/5. The operating margin remains high at 13.6%, and is also forecast to remain steady at 13.3% according to the company’s forecast for FY2026/5.
On financial indicators, ROE was 11.5% in FY2024/5 and is expected to rise to 14.1% in FY2025/5, steadily improving capital efficiency. ROIC is also firm at 13.7%, and over the past several years, the company has secured the capability to create economic value that consistently exceeds WACC (approximately 6%–7%) by a wide margin. In addition, the company’s beta is slightly above 0.7, which also makes it attractive as a stable asset with low sensitivity to market volatility.
Furthermore, the cash flow structure is highly favorable. Over the past five years, operating cash flow has improved, and net cash has reached a high level of 18.937 billion yen, accounting for 47% of total assets and 42% of market capitalization. Such abundant cash holdings both strengthen the stability of the balance sheet and suggest ample room for shareholder returns. On the other hand, capital expenditures remain restrained, and at present, there has been no clear explanation from management regarding concrete uses of the accumulated cash. This point is a matter of interest for investors going forward.
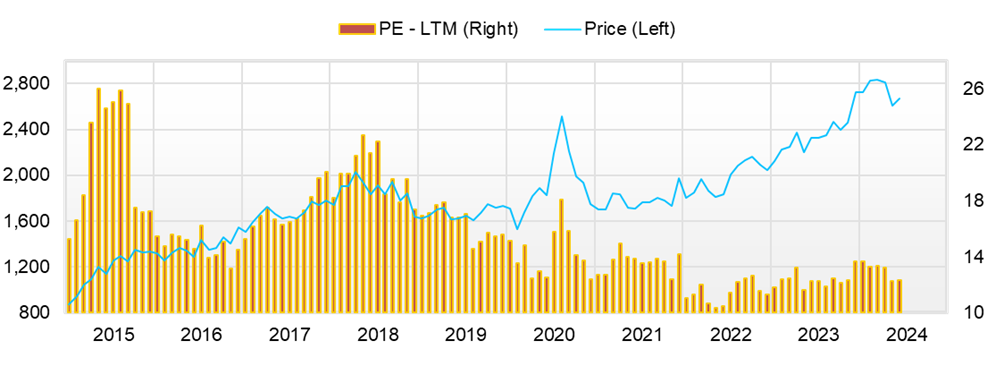
Turning to the current share price level, as of September 2025, PBR is 1.74x and the forward PER is 17.3x, but after adjusting for net cash, the effective PER falls to around 9.9x. In addition, the equity earnings yield based on ROE after PBR adjustment exceeds 10%, highlighting its significant undervaluation. Over the past five years, the share price has maintained a steady uptrend, reflecting progress in results, rising steadily from 1,716 yen in May 2021 to above 4,000 yen in September 2025.
Going forward, expectations in the market for the use of abundant net cash may rise further. In the external environment, pressure to improve capital efficiency on corporate management is increasing. Particularly, demands from activist shareholders and overseas investors may strengthen, and changes in management in response could serve as a catalyst.
In sum, TAKARA & COMPANY can be positioned for medium-to long-term investors as an “investment target that balances high financial stability with room to improve capital efficiency.” At the current share price level, while having downside resilience, there is ample room for a reassessment of valuation through progress in capital policies and shareholder return measures. For investors with a medium-to long-term holding period, it can be judged an opportune time to enter.
1. Company overview
“Two-pronged business focused on disclosure support and translation. A holding company structure with a stable base and expertise.”
TAKARA & COMPANY is a holding company whose main businesses are the Disclosure-related business and the Interpreting & Translation business. Since its establishment in 1960 in Minato-ku, Tokyo, it has specialized in IR/SR support for listed companies and, in addition to support for the preparation and printing of statutory and voluntary disclosure documents, has expanded its business domain into interpreting and translation services. It now has a group structure with 19 subsidiaries and provides comprehensive support for information disclosure in Japan and overseas.
The business structure consists of two segments: the “Disclosure-related business” and the “Interpreting & Translation business.” The Disclosure-related business provides support for the preparation of statutory disclosure documents (such as securities reports and convocation notices) based on the Financial Instruments and Exchange Act and the Companies Act, as well as voluntary disclosure support centered on IR and ESG information, and services related to the digitalization of general meetings of shareholders. With in-house-developed solutions centered on WizLabo, the company realizes efficient document creation and management. As of the end of May 2024, it maintains business relationships with over 2,000 domestic listed companies.
The Interpreting & Translation business, in addition to providing interpreting at international conferences, events, and seminars, has recently evolved to provide value-added services utilizing translation/localization and the AI translation solution SIMULwiz. In particular, against the backdrop of globalization and advances in ESG information disclosure, as demand grows for English-language disclosure of non-financial information, demand for TAKARA & COMPANY’s interpreting and translation services is steadily increasing.
The total number of employees of the Group is 1,193 (as of May 2024, excluding temporary employees), with approximately 840 in the Disclosure-related business and approximately 316 in the Interpreting & Translation business, reflecting a well-balanced allocation of human resources between the core businesses.
Since shifting to a holding company structure in 2019, TAKARA & COMPANY has accelerated the optimization of its group strategy and the efficient allocation of management resources while emphasizing the independence and expertise of subsidiaries. It has expanded its customer base by responding to domestic legal and regulatory changes (abolition of the quarterly report system, amendment of the Companies Act) and global disclosure standards (IFRS adoption, strengthened English-language disclosure).
Under its corporate philosophy, “Fulfill our role as a public entity of society,” the company promotes the advancement and streamlining of information disclosure infrastructure. It aims to conduct corporate management in a way that earns the trust of stakeholders. The stance of pursuing both leveraging group synergies and deepening expertise is an essential element supporting the resilience of TAKARA & COMPANY’s business base.
TAKARA & COMPANY has established a unique group structure as a “leading domestic specialist in disclosure support,” combining this with global capabilities in interpreting and translation. With high expertise and a stable customer base as strengths, it is attracting attention from investors as a company that has achieved steady growth while flexibly adapting to changes in laws/regulations and the market.
2. Characteristics and content of the business
“Expertise in information disclosure support and the translation business. Balancing regulatory response with IT utilization.”
The characteristics of TAKARA & COMPANY’s business lie in its high level of expertise through a two-pronged structure consisting of the “Disclosure-related business” and the “Interpreting & Translation business.” In particular, in the Disclosure-related business, the company’s mainstay is support for the preparation of statutory and voluntary disclosure documents related to the Financial Instruments and Exchange Act, the Companies Act, and IR/SR activities. Specifically, it provides a wide range of products and services related to information disclosure, including securities reports, convocation notices for general meetings of shareholders, business reports, integrated reports, and ESG-related materials. In these operations, in addition to expertise, “accuracy, speed, and compliance response capabilities” are the sources of its competitive advantage.
One of the company’s distinctive initiatives is the development and provision of the integrated business reporting system “WizLabo.” This is a tool that electronically manages the creation processes of documents such as financial results and securities reports, and realizes operational efficiency through API integration and enhanced CMS functions. It contributes to strengthening compliance and improving the efficiency of human resources at client companies and is highly regarded as a business support platform. Its product lineup, which promptly responds to changes in the external environment, such as the review of the quarterly disclosure system, is becoming an indispensable infrastructure for client companies.
The Interpreting & Translation business provides interpreting services mainly at international conferences, events, and seminars, and translation services in corporate marketing, IR activities, and legal/contract-related fields. In particular, strengthening disclosure-related translation is one of the company’s unique strengths. Against the backdrop of increasing demand for non-financial information (integrated reports, ESG-related materials, etc.) and English-language disclosure, it is expanding steadily. The company is also notable for its proactive efforts to increase added value, such as utilizing AI translation technology (“SIMULwiz”) and building a post-editing system for human quality assurance after machine translation (MTPE).
In addition, cross-selling between disclosure support and translation operations is a distinctive sales model of the company. As part of global IR support for domestic listed companies, it demonstrates synergy between the two businesses. Its capability to provide “end-to-end support” for the diverse information disclosure and communication needs of client companies is a key differentiating factor from its competitors.
As described above, TAKARA & COMPANY has established a unique position in the fields of disclosure support and global communication by swiftly incorporating changes in systems and market needs and combining its own IT solutions, consulting, and translation/interpreting services. This “balance of regulatory response and IT capabilities” also contributes to an increase in average revenue per customer and curbing the cancellation rate, and is a critical strength supporting the stability of growth over the medium to long term.
3. Major shareholders and investment trends
“Status of major shareholders: management stability underpinned by a stable shareholder structure and low activism risk”
TAKARA & COMPANY’s shareholder structure is characterized by its outstanding stability and is a crucial investment evaluation factor from the perspective of medium-to long-term management stability and governance. The total number of shares issued is 13,153,293 shares, and the free float ratio is 73.1%. In contrast, approximately 27% of the shares are held by insiders and strategic stakeholders.
Looking at the current composition of large shareholders, the largest shareholder is MIRI Capital Management LLC, which holds 9.71% of shares outstanding. In addition, it is notable that leading Japanese asset managers, including Sumitomo Mitsui DS Asset Management (3.11%), Nomura Asset Management (2.54%), Sumitomo Mitsui Trust Asset Management (1.90%), and Asset Management One (1.87%), are long-term shareholders.
Among management-and founding-family-related shareholders, Nomura Co., Ltd. (4.80%) and Ms. Akemi Nomura (1.85%), a shareholder related to the founding family, and other holdings with strong ties to management account for a significant portion of the total, which helps to stabilize the management base. Holdings by strategic investors such as Hikari Tsushin, Inc. (2.15%), Mizuho Financial Group, Inc. (4.14%), and Sumitomo Mitsui Financial Group, Inc. (3.62%) are also confirmed, indicating ongoing cooperative relationships.
From the perspective of activism risk, most major shareholders are considered to have a low activist orientation. At present, the likelihood of activist intervention in management is at a low level. This reflects TAKARA & COMPANY’s stable management stance and is a factor that curbs concerns about short-term governance risk.
What should be noted is the holding status related to shareholding associations: the presence of the company’s employee shareholding association (1.80%) helps to align the interests between management and employees. Shareholding by the employee shareholding association can be expected to contribute to stable organizational operations and have positive effects on governance.
Overall, TAKARA & COMPANY’s shareholder structure has the character of a “stable control structure and low activism risk” and functions as an element supporting a medium-to long-term management orientation. For medium-to long-term investors, while the risk of unexpected activist intervention is low, it also means that market pressure for the utilization of net cash and improvement in capital efficiency is limited. Going forward, whether management itself proactively discloses capital policies and presents an action plan for efficient capital utilization will be the key to leveraging the stability of the shareholder structure.
4. Medium-term management plan
“Medium-term management plan: levering regulatory changes to strengthen disclosure support”
TAKARA & COMPANY is promoting the “Medium-term Management Plan 2026,” which covers FY2024/5 through FY2026/5. The plan aims to strengthen the earnings base while responding to demand fluctuations accompanying legal and regulatory revisions as well as changes in market structure, and to secure sustainable growth.
The quantitative targets for FY2026/5 are net sales of 33.0 billion yen (+11.2% YoY), operating profit of 4.4 billion yen (+8.7%), operating margin of 13.3%, and net income of 3.1 billion yen (ROE 10.0%). While ROE of over 10% is set as a minimum target, in recent years the company has steadily secured 10%, reaching 14.1% in FY2025/5.
In the Disclosure-related business, against the backdrop of the review of the quarterly disclosure system and amendments to the Companies Act, the company is strategically expanding its high-value-added solutions for financial results and solutions for the digitalization of general meetings of shareholders (“Net de Shoshu,” “Net de Sokai,” etc.). Through “WizLabo2.0,” the company aims to increase average revenue per customer and differentiate its services by strengthening data collection, enhancing API linkage, improving web integration, and strengthening audit support.
In the Interpreting & Translation business, the company accurately addresses demand for English-language disclosure of IR/ESG information in Japan and overseas. It is strengthening competitiveness in both translation volume handled and quality. In addition, it is evolving into a high-value-added service centered on the expanded sales of its AI translation platform “SIMULwiz” and on human resource development in the interpreting/translation industry (in cooperation with Simul Academy). The company is also exploring expansion into overseas markets and is advancing reinforcement of multilingual capability, including Chinese and Southeast Asian languages.
Regarding capital allocation, the company has indicated a policy of allocating 10.0 billion yen of its funding sources totaling over 16.0 billion yen to growth investments (use of AI, M&A, strengthening WizLabo, ASEAN expansion) and 1.0–2.0 billion yen to improving the management base (equipment renewal, DX promotion, investment in human capital). For shareholder returns, it has set a payout ratio of 50% as a benchmark and has clearly set out its goal of “stable improvement in the level of returns” by combining stable dividends with consideration of share repurchases.
The company is also proactive in human capital management and strengthening governance. By enhancing the development of interpreter and translator talent, holding study sessions across the Group, and implementing measures to improve employee well-being, it aims for the sustainable growth of its human resources, building a structure that will support the maintenance and improvement of customer service quality over the long term.
In sum, the Medium-term Management Plan 2026 is an “aggressive management plan” that, while deepening the existing earnings base (disclosure-related), pursues enhancement of high-value-added and multilingual capability in the translation/interpreting market and, in parallel, advances operational efficiency through the use of AI/DX. For investors, the execution capability of this plan, which views regulatory changes and the diversification of disclosure needs as business opportunities, and the sustainability of the stated ROE target (10%) will be key points to watch.
5. International business
“Enhancing global support for domestic customers, focusing on expanding English-language disclosure support”
TAKARA & COMPANY’s international business strategy at present is focused less on directly expanding business overseas and more on strengthening English-language disclosure support for its domestic clients. The Medium-term Management Plan 2026 also explicitly states its goal of “enhancing the quality of information disclosure for overseas investors and expanding capacity,” outlining a policy to strengthen support for the production of English-language disclosure materials and translation services for English-language IR/ESG reports.
The strategic background to this is the growing market need for Japanese companies to strengthen their global IR. In particular, in response to the trend toward mandatory English-language disclosure of ESG information and active information dissemination to overseas investors, TAKARA & COMPANY is deepening its international responsiveness to enhance the value added of the Disclosure-support business.
Specifically, progress is being made in capturing demand for English translation services for statutory and voluntary disclosure documents such as financial results, securities reports, and integrated reports. To secure the translation resources that support this, improving the operating efficiency of translation-specialist subsidiaries and continuous skill-enhancement measures for translation personnel are also stated as priority issues in the medium-term plan.
Across the Interpreting & Translation business as a whole, centered on Simul International, the company continues to provide simultaneous interpreting services in response to international conferences and business events. In particular, in the post-COVID period, stable demand for “hybrid conferences combining online and in-person” has been a support, and the company is expanding its international business domain indirectly by strengthening international responsiveness for domestic customers.
Financially, the proportion of international business in total net sales is limited, and the Disclosure-related business continues to constitute the core. However, there is ample room for expansion in the field of English-language disclosure translation and IR support, and especially the market growth potential accompanying strengthened responses to global ESG standards is an element that cannot be overlooked.
At present, TAKARA & COMPANY’s “international business” is positioned as “advancing international responsiveness for domestic customers,” and full-scale overseas expansion itself is not yet underway. Going forward, whether this international-responsiveness domain can be further developed as a growth driver, backed by the tailwind of increasingly active overseas IR activities by Japanese companies and the trend toward strengthened English-language disclosure, will be a point for investors to watch.
6. Long-term results
“Stable growth track and evolving the earnings structure. A long-term improvement trajectory in ROE.”
TAKARA & COMPANY’s results have maintained a stable growth trajectory for more than the past ten years. In recent years, it has also made its improving trends in profitability and capital efficiency more pronounced. Particularly since FY2020/5, with the “introduction of a holding company structure” and the “establishment of a two-pillar earnings model consisting of Disclosure-related and the Interpreting & Translation business,” the stability of results and the sustainability of growth have been strengthened.
Looking at the long-term trend in net sales, they have increased moderately from approximately 24.7 billion yen in FY2021/5 to 29.6 billion yen in FY2025/5, achieving a CAGR of roughly 3%. The temporary downturn in interpreting demand due to the COVID-19 pandemic was overcome through the normalization of demand from 2023 onward and by capitalizing on demand for online interpreting, and a target of 33.0 billion yen in FY2026/5has been set. The progress of the medium-term plan underpins the continued stability of the performance trend.
Operating profit has also trended steadily. Operating profit of 2.7 billion yen in FY2021/5 rose to 4.0 billion yen in FY2025/5, and is expected to reach 4.4 billion yen in FY2026/5. The operating margin rose from 11.7% in FY2020/5 to 14.5% in FY2024/5, and, although it declined slightly to 13.6% in FY2025/5 due to a temporary increase in SG&A, the “high-profitability structure” over the medium to long term has been maintained.
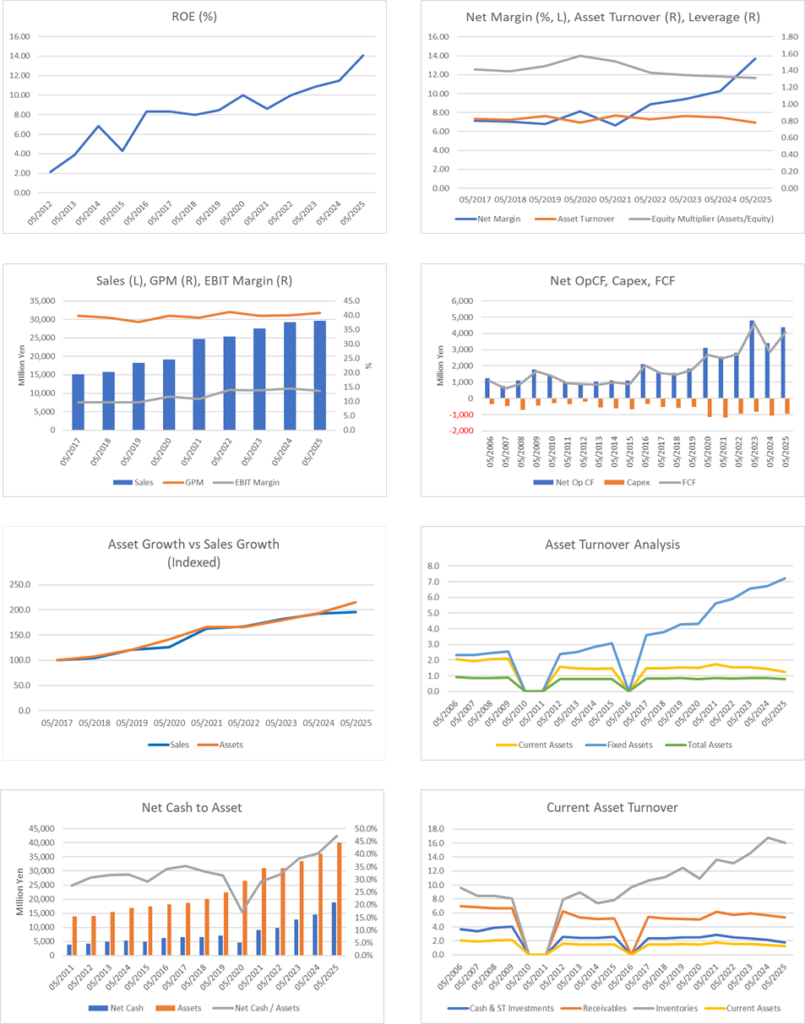
ROE has steadily improved, from 8.6% in FY2019/5 to 10.0% in FY2022/5, 10.9% in FY2023/5, 11.5% in FY2024/5, and 14.1% in FY2025/5. This sustained improvement in ROE reflects the company’s steady progress in improving asset turnover and SG&A efficiency and is a key indicator of the company’s “shift to management focused on capital efficiency.”
Free cash flow (FCF) has shown a consistent increasing trend over the past five years. In FY2025/5, cash flows from operating activities were 4.366 billion yen and cash flows from investing activities were 1.271 billion yen, maintaining the strengthening of the net cash position; from the perspective of financial soundness, its “long-term, stable cash flow generation capability” is highly evaluable.
The share price has also moved straightforwardly in tandem with this long-term improvement in results, rising from 1,716 yen at the end of FY2021/5 to 1,808 yen at the end of FY2022/5, 2,201 yen at the end of FY2023/5, 2,672 yen at the end of FY2024/5, and above 4,000 yen in September 2025, a 2.3x increase over four years. BPS also increased steadily from 1,672 yen in FY2021/5 to 2,337 yen in FY2025/5, and PBR improved from 1.03x to 1.74x, confirming that progress in results has been consistently reflected in market valuation.
Over the past ten years, the company has simultaneously achieved “stable growth,” “improved profitability,” and “improved capital efficiency.” Particularly in the past few years, it has established a position of capturing changes in market structure, such as changes in the disclosure system and strengthened global disclosure, as opportunities for growth in results, and even over the medium to long term, the outlook is for a stable and sound growth trend to continue.
7. Results in the most recent financial statements
“Stable growth and maintenance of the earnings structure. Key highlights of FY2025/5 results.”
TAKARA & COMPANY’s results for FY2025/5 maintained stable growth in both net sales and profit while laying the necessary groundwork for medium-term growth. On a consolidated basis, net sales were 29.6 billion yen (+1.4% YoY), operating profit was 4.048 billion yen (−4.3%), ordinary income was 4.239 billion yen (−1.6%), and profit attributable to owners of parent was 4.075 billion yen (+35.2%). The results were characterized by an increase in net sales, a decrease in operating and ordinary income, and a substantial increase in net income.
By segment, in the core Disclosure-related business, earnings based on statutory disclosure documents were firm, and sales expansion of high-value-added offerings such as translation, integrated reports, and consulting services contributed to higher net sales. However, increased SG&A (personnel expenses and office improvement costs) compressed operating profit. This is positioned as groundwork investment for medium-to long-term growth, and it is important to note that this does not indicate a structural decline in the profit margin.
In contrast, in the Interpreting & Translation business, net sales declined due to a recoil from the rapid recovery in interpreting demand in the previous fiscal year. Still, stable demand for hybrid services for online conferences partially offset this. It is noteworthy that AI translation/interpreting solutions using “SIMULwiz” and the growth of translation related to IR/ESG progressed steadily.
On the earnings structure, although the operating margin fell from 14.5% in the previous fiscal year to 13.6%, this was due to one-off cost factors, while the gross margin remained stable. The substantial 35.2% increase in net income was attributable to one-off factors such as the recording of a gain on the sale of fixed assets.
On financial indicators, ROE rose to 14.1% (from 11.5% in the previous fiscal year), confirming a notable improvement in capital efficiency. ROA was also at a high level of 8.3%. In addition, cash flows from operating activities were 4.366 billion yen (+30.2% YoY), cash and deposits at the end of the fiscal year reached 19.145 billion yen, and the net cash ratio was maintained at an abundant level of approximately 47% of total assets.
In dividend policy, the dividend for FY2025/5 was 120 yen per share (interim dividend 45 yen, year-end dividend 45 yen, and special dividend 30 yen), a significant increase from 80 yen in the previous fiscal year. The payout ratio remained at a stable level of 38.2%, indicating a strengthening stance on shareholder returns.
The results for FY2025/5 contained multiple favorable factors: “higher net sales, high profit levels, high ROE, an abundant cash position, and proactive shareholder returns.” The trend of growth in net sales and profit is continuing, and the increase in SG&A as an upfront investment can be interpreted in the context of “strengthening measures toward achievement of the Medium-term Management Plan.” Concerns about the short-term decline in the profit margin are limited; instead, the results arguably strengthened the company’s reputation as a stable growth company backed by a strong financial base and cash flow generating capability.
8. Full-year earnings forecast
“Balancing accelerated growth in net sales and profit with strategic investment. Earnings forecast for FY2026/5.”
TAKARA & COMPANY’s earnings forecast for FY2026/5is an upbeat outlook premised on continued steady growth in both net sales and profit. The company sets quantitative targets of net sales of 33.0 billion yen (+11.2% YoY), operating profit of 4.4 billion yen (+8.7%), profit attributable to owners of parent of 3.1 billion yen (−23.9%), and ROE of 10%.
The drivers of net sales growth are mainly in the Disclosure-related business, where increased orders are expected for support in the preparation of financial results (summary) and securities reports, integrated reports, and ESG consulting services in a manner that adapts to expanding demand for disclosure operations accompanying the review of the quarterly system and amendments to the Companies Act. In addition, increases in customers adopting “WizLabo2.0” with strengthened API linkage and CMS, and growth in services related to online general meetings are expected to continue to contribute as factors for higher net sales.
In the Interpreting & Translation business, demand for English translation of documents related to IR/ESG is firm, and expansion of high-value-added services utilizing the AI translation platform “SIMULwiz” and expansion of overseas projects, driven by strengthened multilingual capabilities for the ASEAN market, will be a key tailwind. Stable demand for services responding to hybrid international conferences in Japan and overseas is also assumed to contribute to higher net sales.
Concerning operating profit, the stability of the earnings structure in the Disclosure-related business will continue to underpin the whole. Still, because the effects of the planned increase in SG&A expenses in the previous fiscal year (personnel expenses, office-related expenses, etc.) are expected to remain to some extent in the current fiscal year, the operating margin is forecast to decline slightly from 13.6% in FY2025/5 to 13.3%. That said, it is important to view this as a strategic element toward “medium-term strengthening of the earnings base” accompanied by growth investment and upfront cost burden, rather than a structural decline in profitability.
The outlook for a substantial YoY decrease of 23.9% in profit attributable to owners of parent is due to the disappearance of the one-off factor of a gain on sale of fixed assets that was recorded in FY2025/5, and it should be noted that this is not a sign of declining profitability in the core business. Structurally, the business reality can be interpreted as “firm profitability in the core business + disappearance of a one-off gain.”
Financially, by setting the ROE target at 10%, the company demonstrates that it will continue to maintain an “awareness of management focused on capital efficiency.” With the net cash ratio still at a high level, as external demands for improved capital efficiency grow stronger, the flexibilization of capital policy (enhanced dividends, share repurchases, etc.) could become an essential topic of investor focus going forward.
TAKARA & COMPANY’s earnings forecast for FY2026/5 is a solid plan based on the coexistence of “accelerated net sales growth and strategic investment.” The company can accurately capture demand stemming from changes in systems and increases in IT-and translation-related demand, as well as the development of capital policies utilizing net cash, will be focal points that influence equity valuation.
9. Growth strategy and risks
“Structural analysis of growth opportunities and inherent risks arising from deepening the business base and responding to regulatory and market changes”
TAKARA & COMPANY’s growth strategy is built on two pillars: a “growth model that responds to regulatory changes” that skillfully incorporates changes in systems and markets, and the strengthening of multilingual and high-value-added responsiveness in the Interpreting & Translation business.
In the Disclosure-related business, the company positions the review of the quarterly report system, amendments to the Companies Act, and the Tokyo Stock Exchange’s initiatives to strengthen disclosure as opportunities for service differentiation and higher value added. Through strengthened API linkage, enhancement of WizLabo Library CMS functions, reinforcement of WizLabo Box, and other measures, “WizLabo” contributes to reducing operational burden and enhancing compliance response at client companies. The company aims to achieve both higher average revenue per customer and stronger customer loyalty.
In the Interpreting & Translation business, while refining expertise and quality, particularly in responses to English-language disclosure, the company is also considering expansion into overseas markets such as ASEAN. By strengthening sales of its proprietary AI translation platform “SIMULwiz” and developing translators within the Group (in cooperation with Simul Academy), the strategy is to enhance service competitiveness on both the human-capital and technology fronts.
In addition, the company has clarified its proactive resource allocation policy, placing priority on allocating 10.0 billion yen of growth investment (a portion of total funding sources of 16.0 billion yen) to strengthening WizLabo functions, utilization of AI, entry into ASEAN, and M&A. This strategic capital allocation is laying the groundwork for diversification of the service portfolio and strengthening of the earnings base over the medium to long term.
On the other hand, risk factors also exist. First is “regulatory risk,” whereby changes in laws and regulations and market practices directly affect TAKARA & COMPANY’s earnings model. This includes the possibility that future simplification of systems and progress in digitalization might partially reduce customer demand. Second is human-capital risk. So long as the Interpreting & Translation business is a core area, the difficulty of securing and developing highly specialized personnel is high, and maintaining and improving service delivery capability is directly linked to profitability.
Further, if pressure to improve capital efficiency intensifies on the back of a robust cash position (net cash of 18.9 billion yen, 47% of total assets), expectations from shareholders and investors regarding capital policy could function as a potential risk that constrains the flexibility of management strategy.
While TAKARA & COMPANY’s growth strategy consists of a “steady growth model originating from changes in systems and markets” and “strengthening the earnings base through advancement and diversification of services,” it also contains structural issues: a high degree of dependence on regulation, a high degree of reliance on specialized personnel, and initial risks in overseas business. For investors, the strategic use of cash going forward, the effectiveness of growth investment, and progress in international expansion will be keys to the assessment of growth potential and a reassessment of valuation.
10. Share price trends and equity valuation
“Share price trends that straightforwardly reflect growth in results. Short-term risks implied by abundant cash and pressure to improve capital efficiency.”
The share price has risen from 1,716 yen in May 2021 to above 4,000 yen in September 2025, reflecting stable growth in results and financial soundness.
PBR improved from 1.03x in FY2021/5 to 1.39x in FY2025/5, and as of September 2025, it has reached 1.74x. PER is 17.3x on a forecast basis, and after adjustment for net cash, it is 9.9x, highlighting a pronounced sense of undervaluation. The equity earnings yield based on ROE after PBR adjustment exceeds 10%, allowing for a quantitative assessment that the current share price remains “in undervalued territory.”
What is noteworthy amid this steady share price rise is the strength of financial downside resilience. Abundant net cash of approximately 18.9 billion yen, accounting for about 47% of total assets and about 42% of market capitalization, is emblematic of TAKARA & COMPANY’s financial safety, and even if temporary adverse factors were to arise in short-term results, the balance sheet’s strength could function as a defensive buffer.
However, short-term risks to be kept in mind are threefold: (i) the possibility that current growth in results is being supported by one-off demand stemming from system revisions; (ii) continued effects of increased SG&A (particularly personnel expenses and office improvement costs); and (iii) a growth deceleration owing to the normalization of demand in the Interpreting & Translation business. These could become factors compressing the profit margin in the short term. In particular, the operating margin declined from 14.5% to 13.6% in FY2025/5 and is expected to fall further to 13.3% in the FY2026/5 forecast, points of potential concern for short-term investors.
Moreover, while the share price has thus far responded favorably to the strengthening of the balance sheet through the accumulation of abundant cash, the fact that clear explanations from management and indications of capital policies regarding the use of that net cash remain insufficient could, conversely, become a factor for short-term share price volatility as a “risk that expectations for improved capital efficiency could fade.” This reflects the fact that, at the current market valuation level (PBR 1.74x), expectations for progress in capital policy are incorporated to some extent.
Accordingly, the share price is trending firmly as the market straightforwardly evaluates growth in results and financial soundness, and the undervaluation continues. However, in the short term, the continued burden of SG&A, a decrease in demand in the Interpreting & Translation business, and a lack of clarity in its capital policy may affect the sentiment of short-term investors, and attention should be paid to the risk of rising share price volatility. For medium-to long-term investors, it can be evaluated as an investment opportunity based on “strong fundamentals and downside resilience backed by net cash” that transcends such short-term noise.
11. Equity investment conclusion derived from consideration of results and share price
“Stable company with high profitability and abundant-cash. Investment decision based on long-term profitability and expectations for progress in capital policy.”
In addition to stable growth in net sales and profit, TAKARA & COMPANY has enhanced its corporate value-creation capabilities through a solid financial base and steady improvement in capital efficiency. Particularly since FY2021/5, the constant rise in ROE has been notable: ROE of 8.6% in FY2021/5, 10.0% in FY2022/5, 10.9% in FY2023/5, 11.5% in FY2024/5, and 14.1% in FY2025/5, an improvement over five years that confirms a clear shift to management focused on capital efficiency.
Backed by progress in results and improvement in capital efficiency, the share price rose steadily from 2021 to 2025, and BPS also increased steadily. PBR improved, and market evaluation has continued to rise.
The Medium-term Management Plan 2026 sees changes in systems (review of the quarterly disclosure system, amendments to the Companies Act, etc.) as opportunities. It aims for steady growth in net sales and profit through higher value added in the Disclosure-related business, expansion of WizLabo, strengthening of multilingual capability in the Interpreting & Translation business, and entry into the ASEAN market. Notably, setting “maintenance of ROE at 10%” as a numerical target is a vital management indicator that also responds to external pressure to improve capital efficiency.
Turning to the current share price level, with a PBR of 1.74x, forecast PER of 17.3x, net-cash-adjusted PER of 9.9x, and equity earnings yield based on ROE after PBR adjustment exceeding 10%, the sense of undervaluation remains pronounced. A situation exists in which stability backed by financial downside resilience (net cash at 47% of total assets) coexists with upside room for reassessment through progress in capital policy.
In the short term, increases in personnel expenses and office improvement costs, the decrease in demand following the previous fiscal year’s sharp rise in the Interpreting & Translation business, and opacity in the policy for cash utilization may be recognized as factors for share price volatility. In addition, because the current market valuation incorporates “expectations for improvement in capital efficiency” to some extent, attention should be paid to the risk of shareholder selling on disappointment if a clear direction of capital policy is not presented.
However, from a medium-to long-term perspective, structures are in place for high-quality growth: a stable customer base (over 2,000 domestic listed companies), a top position in the domestic disclosure-support industry, IT responsiveness centered on WizLabo, higher value added and expanded multilingual capability in interpreting/translation services, and the growth option of entry into the ASEAN market.
Overall, TAKARA & COMPANY can be positioned as “a stock with medium-to long-term investment appeal backed by stable growth potential, improved capital efficiency, and a solid financial base.” While being mindful of short-term risks, the current share price level (PBR 1.74x; net-cash-adjusted PER 9.9x) is sufficiently attractive and continues to represent a rational entry point for investors, premising medium-to long-term holding.
12. Trajectory of return on equity (ROE) and the current evaluation
“Return on capital in the context of investor evaluation based on the trajectory of ROE improvement and the deepening of management focused on capital efficiency”
TAKARA & COMPANY’s ROE has traced a clear improvement trajectory over the past five years. Starting from 8.6% in FY2021/5, it rose to 10.0% in FY2022/5, 10.9% in FY2023/5, 11.5% in FY2024/5, and 14.1% in FY2025/5, clearly demonstrating the company’s heightened awareness of management focused on capital efficiency.
This improvement is not merely the result of a one-off increase in earnings; it is underpinned by TAKARA & COMPANY’s strategic reform of its business structure and improvement in SG&A efficiency, as well as by stable growth in net sales (FY2021/5: 24.7 billion yen → FY2025/5: 29.6 billion yen) and sustained high operating margins (FY2025/5: 13.6%). In addition, steady improvement in asset turnover has contributed to improved capital efficiency.
What is particularly noteworthy is that, while achieving a record-high ROE of 14.1% in FY2025/5, the company simultaneously maintained a net cash ratio (47% of total assets). This indicates a capability for corporate management that can realize both control of financial risk and enhancement of capital efficiency in parallel, suggesting that TAKARA & COMPANY has evolved into a “management structure combining safety and efficiency.”
In the Medium-term Management Plan 2026, the ROE target for FY2026/5is set conservatively at “10%,” which can be interpreted as incorporating a temporary decline in the profit margin accompanying accelerated future investment (M&A, entry into ASEAN, strengthening of WizLabo, etc.) and, conversely, as indicating that the company has established “a governance and business structure capable of stably maintaining a double-digit ROE level.”
From an investor’s perspective, it should also be noted that this ROE improvement trend has been reflected to a certain extent in share price valuation (PBR). PBR rose from 1.03x in FY2021/5 to 1.39x in FY2025/5 and, as of September 2025, to 1.74x. The simultaneous progress of BPS growth (FY2021/5: 1,672 yen → FY2025/5: 2,337 yen) and ROE improvement speaks to a certain level of market evaluation for management focused on capital efficiency.
On the other hand, the room for further improvement in ROE requires careful assessment. The current high level of 14.1% also reflects contributions from one-off factors such as temporary demand increases accompanying system changes (review of the quarterly disclosure system, amendments to the Companies Act, etc.) and gains on the sale of fixed assets. Whether the company can stably maintain double-digit ROE going forward depends on deepening its core businesses, such as by increasing average revenue per customer in disclosure-support services, strengthening cross-selling, and promoting continuous use of WizLabo among its users.
In addition, expectations from shareholders and the market for “further improvement in capital efficiency through use of net cash” remain strong. Whether management explicitly presents this in the form of capital policies will be an essential management issue for future increases in PBR and for exceeding ROE targets.
From the above, over the past five years, the company has been “a rare presence that has steadily improved ROE and, while ensuring financial safety, has raised it to the 14% level,” and at the current share price level (PBR 1.74x), the improvement in capital efficiency continues to be evaluated. For medium-to long-term investors, the sustained maintenance of double-digit ROE and progress in capital policy should be recognized as the primary focus that will drive enhancement of shareholder value going forward.
13. Analysis of economic value creation based on ROIC and WACC
“Return on capital that far exceeds the cost of capital: analysis of the sustainability and structure of economic value creation”
TAKARA & COMPANY’s ROIC (return on invested capital) has shown a stable upward trend in recent years and reached a record-high 13.7% in FY2025/5. Meanwhile, WACC (cost of capital) is estimated at around 6%–7%, and TAKARA & COMPANY secures a large positive spread of more than 7 percentage points between ROIC and WACC. This structure indicates that the company has evolved into an organization that can stably create economic value in the course of its business operations.
This improvement in ROIC is not only the result of establishing a high-profit model in the Disclosure-related and the Interpreting & Translation businesses, but also the fruit of management efforts such as improving SG&A efficiency and asset turnover. Particularly in the Disclosure-related business, the company has used changes in the external environment, such as the review of the quarterly disclosure system and amendments to the Companies Act, as growth opportunities. It has improved profitability and strengthened customer loyalty through expanded sales of IT solutions centered on WizLabo.
As a business characteristic, TAKARA & COMPANY has a management structure with a strong fixed-cost-control effect, supported by the high repeatability and customer continuity of disclosure-support operations (stable transactions with over 2,000 domestic listed companies). For this reason, growth in net sales directly contributes to an increase in profit and improvement in ROIC. In addition, in the Interpreting & Translation business, a shift toward high-value-added projects (such as translation of IR/ESG documents) and AI translation services (such as SIMULwiz) is progressing, making growth with high capital efficiency increasingly possible.
On the other hand, the company’s ample net cash position (approximately 18.9 billion yen, equivalent to about 47% of total assets and 42% of market capitalization) also contributes to the magnitude of the ROIC–WACC spread by keeping the weighted average cost of capital (WACC) at a low level. A stable business portfolio with a low beta (0.7) lowers the required level of risk premium in the capital market and realizes an effective reduction in WACC.
This economic value creation structure (sustainability of EVA) is an essential factor for investors. EVA (economic value added) is proportional to the extent to which ROIC exceeds WACC and depends on the size of invested capital. Taking into account TAKARA & COMPANY’s abundant equity capital and stable capability to generate free cash flow, the company can be considered a significant contributor to EVA in absolute value in terms of scale.
In the short term, there are concerns such as an increase in SG&A and a deceleration in growth in the Interpreting & Translation business, and there is awareness of a slight downside risk to ROIC. However, the current “excess return of more than about seven percentage points,” with ROIC of 13.7% versus WACC of 6%–7%, substantiates the company as a clear economic–value-creating enterprise and indicates that it is sufficiently equipped with downside resilience against changes in the external environment.
TAKARA & COMPANY can be evaluated, by its business structure, as a “company that continuously creates EVA based on stable ROIC and low WACC,” and it is a solid investment candidate for medium-to long-term investors. In particular, if capital policies utilizing net cash are clarified, investment appeal would increase further in terms of both ROIC and total shareholder return.
14. Corporate value creation viewed from the perspectives of free cash flow and capital allocation
“Abundant cash and prudent capital allocation: high corporate value-creation capability produced by steady management”
TAKARA & COMPANY has dramatically improved its capability to generate free cash flow (FCF) in recent years. In FY2025/5, cash flows from operating activities (OCF) were 4.366 billion yen and cash flows from investing activities (ICF) were 1.271 billion yen, resulting in a net free cash flow of over 3.0 billion yen. Over the past five years, the company has steadily accumulated positive FCF, and net cash has reached an abundant level of 18.937 billion yen, equivalent to 47% of total assets and 42% of market capitalization.
This strong base for FCF generation stems from the fact that both the Disclosure-related business and the Interpreting & Translation business are business models with high repeatability and high customer retention. Once transactions begin in statutory/voluntary disclosure-document support operations, renewability is high, readily producing recurring earnings and cash; cross-selling effects from the IT solution WizLabo also contribute. The Interpreting & Translation business is likewise evolving into a revenue structure with high capital efficiency through IR/ESG translation and the use of AI translation.
From the perspective of capital allocation, in the Medium-term Management Plan 2026, the company specifies total resource allocation exceeding 16.0 billion yen, funded by cash flows from operating activities and other sources. The breakdown presents 10.0 billion yen for “growth investment” (M&A, entry into ASEAN, strengthening WizLabo, etc.), 1.0–2.0 billion yen for “strengthening the management base,” and more than 3.8 billion yen for “shareholder returns.” This balance can be described as a three-pronged approach of “executing the growth strategy,” “strengthening the management base,” and “stable shareholder returns.”
What is noteworthy is that, as a shareholder-return policy, the company presents “around a 50% payout ratio” and adopts a flexible capital-policy stance that includes consideration of share repurchases. For FY2025/5, it implemented a significant dividend increase to 120 yen per share (from 80 yen in the previous fiscal year), and a stance of sustained returns backed by FCF can be confirmed.
At the same time, prudence is also visible in TAKARA & COMPANY’s capital allocation strategy. At present, management has not presented a clear commitment regarding specific uses for the accumulated ample net cash (for example, the immediate execution of a large-scale M&A or share repurchases). For investors, while this is a focus as “additional room to improve capital efficiency,” in the short term, it could conversely become a factor increasing share price volatility as a “risk of opacity in capital policy.”
TAKARA & COMPANY’s corporate value creation is supported by a combination of “a stable capability to generate FCF” and “a conservative capital allocation stance that retains flexibility.” For medium-to long-term investors, the effectiveness of growth investment and progress in capital policies can be seen as potential primary triggers for a reassessment of corporate value.
15. Future possibilities for shareholder return measures and assessment of past track record
“Evolution and room for returns in a stable dividend policy: future flexibility prompted by dialogue with shareholders”
TAKARA & COMPANY’s shareholder return measures have evolved over the past several years with a basic policy of “raising dividend levels stably and gradually.” As its track record, the dividend per share rose step by step from 54 yen in FY2020/5 (payout ratio of about 39%) to 80 yen in FY2024/5 (34.5%). Further, in FY2025/5, it implemented a significant dividend increase to 120 yen per share (interim 45 yen, year-end 45 yen, including a special dividend of 30 yen), which is the highest level ever.
What supports the sustainability of this dividend level is the ample cash position (net cash of 18.937 billion yen, 47% of total assets, 42% of market capitalization) and the strong capability to generate free cash flow. In fact, against cash flows from operating activities of 4.366 billion yen in FY2025/5, the total annual dividend amount is only around 1.1 billion yen, leaving substantial capacity for dividends.
In dividend policy, the company sets as a benchmark the “maintenance of a payout ratio at around 50%,” emphasizing a policy of stable increases.
Looking back at the shareholder return track record over the past five years, the cumulative dividend per share has exceeded about 300 yen. This reflects stable growth in profit over the same period (net income: 1.2 billion yen in FY2019/5→ 4.0 billion yen in FY2025/5) and financial soundness, and has earned a certain evaluation from investors in terms of stability and consistency of dividends.
As for future possibilities, attention should be paid to (i) further progress in share repurchases, (ii) an increase in the payout ratio, and (iii) options for one-time special returns. Given the ample net cash that accounts for over 40% of total assets and market capitalization, there is significant room for management to meet investor expectations for capital efficiency improvement by indicating proactive measures. In particular, against a backdrop of a sense of undervaluation with PBR of 1.74x and a net-cash-adjusted PER of 9.9x, enhancements to return measures have a high potential to prompt a reassessment by the market.
On the other hand, regarding the direction of capital policy, the situation remains that “a policy is presented but the specific timing and scale of implementation are undecided,” which is an essential point investors should watch in upcoming financial results briefings and IR materials. In particular, the outcome of discussions by the “Group Capital Strategy Review Committee,” established in July 2025, will be a litmus test for greater flexibility in shareholder return measures and for progress in improving capital efficiency.
While the company has worked to enhance shareholder value through stable, gradual increases in dividends to date, it is now in a phase where there is growing room to utilize ample cash and rising expectations for the evolution of capital policy. For investors, this can be seen as a stage for simultaneously assessing both the “sustainability of returns with downside resilience backed by growth in results and financial soundness” and the “potential for progress in capital policy going forward.”
16. Corporate value assessment (DCF, PER/PBR analysis)
“Valuation indicating undervaluation and an effective assessment after adjustment for cash: fair-value analysis backed by steady results”
TAKARA & COMPANY’s current share price assessment, when the ample net cash position is taken into account in addition to its established structure of stable results and high ROE, appears even more undervalued. As of September 2025, the apparent levels of PBR of 1.74x and forecast PER of 17.3x may seem reasonable in light of the five-year share price rise (FY2021/5: 1,716 yen → September 2025: above 4,000 yen) and improvement in ROE (8.6% → 14.1%).
After adjustment for net cash, the effective PER is 9.9x, and the effective equity earnings yield based on this is 11.9%, supporting an evaluation of the stock as undervalued with both downside resilience and room to improve capital efficiency.
A DCF (discounted cash flow) perspective confirms the same investment appeal. Assuming, based on the targets in the Medium-term Management Plan 2026 (FY2026/5: net sales 33.0 billion yen, operating profit 4.4 billion yen, ROE 10%), that cash flows from operating activities are stably generated at around 4.0 billion yen per year, a discount rate of 7.5% (based on the market WACC range) and a terminal growth rate of 1% yield a theoretical DCF value of roughly over 46.0 billion yen. While this aligns with the market capitalization (around 45.3 billion yen), the enterprise value, after deducting 18.9 billion yen in net cash, suggests that the current share price is in undervalued territory relative to its fair value.
Furthermore, in a valuation comparison with peers (translation/interpreting/disclosure-support industry; average PBR 1.6x–1.8x, average PER 16x–18x), TAKARA & COMPANY shows little deviation in either PBR or PER. While it cannot be denied that the market may be applying a certain discount due to “uncertainty over strategies for utilizing the ample cash position,” conversely, this is a “source of expectations for correction of undervaluation” for investors.
Considering the high level of ROE of 14.1%, the low-risk characteristic of a low beta (0.7), and the outlook for steady growth in net sales and profit, the current valuation of TAKARA & COMPANY allows an evaluation as an “undervalued stock combining stability and growth.”
From the perspective of corporate value assessment, the current PBR/PER levels are below fair value, and the sense of undervaluation becomes even clearer after adjustment for net cash. Although the gap with the theoretical DCF value is small, what is important for investors is whether the use of the cash position is clarified and whether there is progress in capital policy. This will be the direct trigger for an upward revision in equity valuation going forward.
17. Multiple comparison analysis with peers
“Profitability and capital efficiency that highlight differences with competitors: TAKARA & COMPANY’s advantages as seen in comparison with PRONEXUS”
While TAKARA & COMPANY develops its business with the Disclosure-related business as its central axis, a comparison with industry peer PRONEXUS (7893) is a point of market focus. PRONEXUS’s net sales for FY2025/3 were 30,996 million yen (about 31.0 billion yen), which is roughly the same scale as TAKARA & COMPANY’s net sales of 29,600 million yen (about 29.6 billion yen) in FY2025/5. While the two companies are comparable in sales scale, there are apparent differences in profitability and efficiency.
PRONEXUS’s operating margin is extremely low at 0.7%, and its ROE for FY2025/3 is also modest at 1.8%. In contrast, TAKARA & COMPANY recorded an operating margin of 13.6% in FY2025/5, and ROE was 14.1% in FY2025/5, making its advantage in both capital efficiency and profitability clear. While both companies have disclosure support as a core business, PRONEXUS has a single revenue model based on electronic disclosure services. In contrast, TAKARA & COMPANY operates both disclosure support and the Interpreting & Translation business, achieving portfolio diversification and improved profitability through a two-pronged structure.
In terms of valuation, PRONEXUS trades at a forecast PER of 17.3x and PBR of 1.08x, while TAKARA & COMPANY trades at a PER of 17.3x and PBR of 1.74x. While PER levels are comparable, PBR is higher for TAKARA, which can be interpreted as the market assigning a certain premium to its high capital efficiency. However, considering TAKARA & COMPANY’s ROE level of 14.1%, the current PBR is relatively modest, and undervaluation persists.
That PRONEXUS’s operating margin is as low as 0.7% is partly due to one-off factors in FY2025/3, such as impairment of goodwill; even taking this into account, TAKARA & COMPANY’s high profitability can be regarded as structural. Furthermore, TAKARA & COMPANY’s net cash ratio reaches about 47% of total assets, and its financial safety is exceptionally high, another significant difference from competitors. The beta at 0.7, reflecting low sensitivity to market risk, also reinforces its positioning as a stable asset.
While matching PRONEXUS in sales scale, TAKARA & COMPANY is recognized as being in a phase in which its positioning as an “undervalued stock combining profitability and stability” is coming into focus for medium-to long-term investors, given that it maintains superiority in operating margin, ROE, and financial soundness, while also advancing risk diversification through portfolio diversification that includes the Interpreting & Translation business.
| Item | TAKARA & COMPANY (7921) | PRONEXUS (7893) |
| Net sales | 29.6 billion yen (FY2025/5) | 31.0 billion yen (FY2025/3) |
| Operating margin | 13.6% (FY2025/5) | 0.7% (FY2025/3) |
| ROE | 14.1% (FY2025/5) | 1.8% (FY2025/3) |
| Expected PER | 17.3 X | 17.3 X |
| PBR | 1.74 X | 1.08 X |
18. Evaluation of takeover defense measures, merits and demerits of the system and the investor’s perspective
“Operational structure and evaluation criteria of the articles-of-incorporation-based poison pill”
TAKARA & COMPANY has continued operating its “current plan” in the form of a takeover defense measure (poison pill) introduced in 2007 and renewed multiple times, with re-approval obtained at the 2022 Annual General Meeting of Shareholders. The system restrains transfers of control by a purchaser contemplating a large holding of 20% or more through a gratis allotment of stock acquisition rights.
Significance and effectiveness of the system
①Preservation of social responsibility and expertise
The company undertakes highly confidential and specialized operations such as disclosure support, preparation of IR documents, and interpreting/translation, with customer trust and know-how forming the core of corporate value. The system has a certain rationality as a defensive line against hostile takeovers that could impair such “intangible assets.”
②System design to eliminate arbitrariness
A special committee consisting of outside directors, outside auditors, and experts is established to decide on the invocation of countermeasures, and the board of directors’ resolution is structured to respect the committee’s recommendation to the maximum extent. In addition, the conditions for invocation, the information required, and the review period (in principle 60 days) are specified, ensuring formal transparency and rationality.
③Involvement of shareholder intent
Although the system is a standing provision in the Articles of Incorporation, renewal every three years presupposes approval by the general meeting of shareholders, and director terms are one year; thus, formally, the system is designed to reflect shareholder intent regarding its continuation.
Concerns and side effects of the system
①Liquidity constraints for minority shareholders
If the system is invoked and stock acquisition rights are allotted, the shareholding ratio of the targeted purchaser is diluted, and existing shareholders’ voting rights are protected. However, it cannot be denied that market liquidity of the shares and price formation may be distorted.
②Risk of being perceived as management entrenchment
Even if formal independence is maintained, it should be noted that discretion over the interpretation of a takeover proposal and invocation of the defense in practice rests with the current management and its supporting forces. In the past, there have been cases where defense measures were used as a means to refuse substantive improvement in capital efficiency, leading to distrust among institutional investors.
③Investor behavior: market reactions and structural caution toward the system
In the Japanese market, shareholder scrutiny of poison pills has intensified in recent years. Particularly since the 2000s, when hostile takeovers began to be recognized as a realistic option, institutional investors and some minority shareholders have become active in criticizing defense measures as “a means of management entrenchment” and casting opposing votes. For example, in the 2005 Nippon Broadcasting case, Nippon Broadcasting countered Livedoor’s takeover proposal by issuing stock acquisition rights. Still, the Tokyo District Court ordered an injunction, questioning the discriminatory nature and showing a judicial stance restraining abuse of formal defensive measures. In the 2014–2015 Skymark reconstruction phase, market backlash arose over opaque sponsor selection related to capital policy, drawing criticism as a governance failure. In the 2007 Bull-Dog Sauce case, the company countered a TOB by Steel Partners by issuing stock acquisition rights at no cost; while the Supreme Court recognized the legitimacy of this defense measure, investors widely shared concerns that “management used the system as a means to exclude external shareholders.”
Against this backdrop, in recent years, proxy advisory firms such as ISS (Institutional Shareholder Services) and Glass Lewis have, in principle, taken a stance of opposition to poison pills, with a stronger tendency toward strict evaluation, particularly for renewal-type, permanent systems. These entities influence global institutional investors and constitute a structural factor that raises the hurdle for investor engagement with companies that maintain defense measures.
At TAKARA & COMPANY as well, it is possible that the background to MIRI Capital’s reaching a large holding of 9.71% in 2024 included an awareness of issues regarding governance rigidity, including the presence of takeover defense measures. Particularly in a situation where excess net cash (18.9 billion yen) is held, there remain deep-seated concerns about external shareholders’ proposals for improving capital efficiency being shut out. Beyond the effectiveness of defense measures, this is being perceived as a persistent concern regarding the flexibility of its capital policy and governance itself.
TAKARA & COMPANY’s takeover defense measures possess formal independence and procedural transparency, and in light of the business structure with the social role of disclosure support, they can be evaluated as a system design with particular significance. On the other hand, in situations where the system in effect functions as a “shield to strengthen governance by the current management,” there is a risk that friction with the interests of minority shareholders will surface.
Particularly, where defense measures remain in place in a phase where no specific measures for improving capital efficiency are apparent, they can easily attract demands for stronger governance by institutional investors and activists, and can become a factor that suppresses the company’s valuation.
Therefore, for investors, the focus at this stage should be less on the mere existence of takeover defense measures and more on “whether they are being operated in a manner compatible with enhancement of corporate value” and “whether there is an exit strategy for abolition or review.”
Key stock price data
Key financial data
| Unit: million yen | 2021 | 2022 | 2023 | 2024 | 2025 | 2026 CE |
| Sales | 24,777 | 25,318 | 27,568 | 29,278 | 29,679 | 33,000 |
| EBIT (operating profit) | 2,707 | 3,561 | 3,812 | 4,232 | 4,049 | 4,400 |
| Pretax Income | 2,933 | 3,630 | 4,010 | 4,454 | 6,018 | |
| Net Profit Attributable to Owner of Parent | 1,640 | 2,250 | 2,596 | 3,014 | 4,076 | 3,100 |
| Cash & Short-Term Investments | 9,745 | 10,296 | 13,139 | 14,641 | 19,146 | |
| Total assets | 30,972 | 30,924 | 33,444 | 36,195 | 40,058 | |
| Total Debt | 702 | 441 | 367 | 107 | 209 | |
| Net Debt | -9,042 | -9,856 | -12,773 | -14,534 | -18,937 | |
| Total liabilities | 8,504 | 7,560 | 8,361 | 8,194 | 9,331 | |
| Total Shareholders’ Equity | 21,920 | 23,069 | 24,763 | 27,645 | 30,335 | |
| Net Operating Cash Flow | 2,569 | 2,802 | 4,794 | 3,412 | 4,391 | |
| Capital Expenditure | 1,183 | 945 | 824 | 1,052 | 957 | |
| Net Investing Cash Flow | -1,395 | -957 | -763 | -889 | 1,248 | |
| Net Financing Cash Flow | 1,193 | -1,234 | -1,192 | -1,371 | -1,127 | |
| Free Cash Flow | 2,486 | 2,734 | 4,608 | 2,860 | 4,083 | |
| ROA (%) | 5.71 | 7.27 | 8.06 | 8.66 | 10.69 | |
| ROE (%) | 8.63 | 10.00 | 10.85 | 11.50 | 14.06 | |
| EPS (Yen) | 130.0 | 171.3 | 197.7 | 231.8 | 314.0 | 238.8 |
| BPS (Yen) | 1,672.2 | 1,754.8 | 1,895.9 | 2,130.2 | 2,337.1 | |
| Dividend per Share (Yen) | 54.00 | 58.00 | 70.00 | 80.00 | 120.00 | 120.00 |
| Shares Outstanding (Million shares) | 13.15 | 13.15 | 13.15 | 13.15 | 13.15 |
Source: Omega Investment from company data, rounded to the nearest whole number.
Share price
Financial data (quarterly basis)
| Unit: million yen | 2023/5 | 2024/5 | 2025/5 | ||||||
| 4Q | 1Q | 2Q | 3Q | 4Q | 1Q | 2Q | 3Q | 4Q | |
| (Income Statement) | |||||||||
| Sales | 7,910 | 8,419 | 6,585 | 5,857 | 8,418 | 8,370 | 6,507 | 6,163 | 8,639 |
| Year-on-year | 9.5% | 1.2% | 10.1% | 9.3% | 6.4% | -0.6% | -1.2% | 5.2% | 2.6% |
| Cost of Goods Sold (COGS) | 4,684 | 4,744 | 4,092 | 3,773 | 4,933 | 4,785 | 4,117 | 3,842 | 4,809 |
| Gross Income | 3,225 | 3,675 | 2,493 | 2,084 | 3,485 | 3,586 | 2,389 | 2,321 | 3,829 |
| Gross Income Margin | 40.8% | 43.7% | 37.9% | 35.6% | 41.4% | 42.8% | 36.7% | 37.7% | 44.3% |
| SG&A Expense | 1,890 | 1,777 | 1,778 | 1,710 | 1,989 | 1,856 | 1,894 | 1,908 | 2,177 |
| EBIT (operating profit) | 1,275 | 1,833 | 671 | 310 | 1,418 | 1,652 | 448 | 370 | 1,579 |
| Year-on-year | 10.6% | 1.6% | 67.2% | -6.6% | 11.2% | -9.9% | -33.2% | 19.4% | 11.4% |
| Operating profit Margin | 16.1% | 21.8% | 10.2% | 5.3% | 16.8% | 19.7% | 6.9% | 6.0% | 18.3% |
| EBITDA | 1,596 | 2,136 | 988 | 622 | 1,737 | 1,953 | 765 | 694 | 1,914 |
| Pretax Income | 1,322 | 1,879 | 672 | 466 | 1,437 | 1,708 | 508 | 410 | 3,393 |
| Consolidated Net Income | 876 | 1,291 | 408 | 289 | 1,061 | 1,153 | 322 | 247 | 2,387 |
| Minority Interest | 5 | 8 | 10 | 6 | 11 | 7 | 8 | 8 | 12 |
| Net Income ATOP | 871 | 1,283 | 398 | 283 | 1,050 | 1,146 | 314 | 239 | 2,376 |
| Year-on-year | 12.8% | 1.2% | 72.8% | 24.9% | 20.6% | -10.7% | -21.1% | -15.4% | 126.2% |
| Net Income Margin | 11.0% | 15.2% | 6.0% | 4.8% | 12.5% | 13.7% | 4.8% | 3.9% | 27.5% |
| (Balance Sheet) | |||||||||
| Cash & Short-Term Investments | 13,139 | 14,463 | 14,274 | 14,057 | 14,641 | 16,248 | 16,534 | 15,910 | 19,146 |
| Total assets | 33,444 | 32,567 | 33,121 | 31,703 | 36,195 | 34,614 | 35,209 | 33,879 | 40,058 |
| Total Debt | 367 | 257 | 172 | 139 | 107 | 100 | 93 | 85 | 209 |
| Net Debt | -12,773 | -14,207 | -14,102 | -13,917 | -14,534 | -16,148 | -16,441 | -15,824 | -18,937 |
| Total liabilities | 8,361 | 6,380 | 6,720 | 5,593 | 8,194 | 6,088 | 6,544 | 5,539 | 9,331 |
| Total Shareholders’ Equity | 24,763 | 25,858 | 26,063 | 25,766 | 27,645 | 28,161 | 28,294 | 27,959 | 30,335 |
| (Profitability %) | |||||||||
| ROA | 8.06 | 8.24 | 8.63 | 9.16 | 8.66 | 8.57 | 8.18 | 8.39 | 10.69 |
| ROE | 10.85 | 10.47 | 11.04 | 11.40 | 11.50 | 10.65 | 10.28 | 10.24 | 14.06 |
| (Per-share) Unit: JPY | |||||||||
| EPS | 66.5 | 98.2 | 30.6 | 21.8 | 80.9 | 88.3 | 24.2 | 18.4 | 183.0 |
| BPS | 1,895.9 | 1,979.7 | 2,008.3 | 1,985.4 | 2,130.2 | 2,170.0 | 2,179.8 | 2,154.0 | 2,337.1 |
| Dividend per Share | 35.00 | 0.00 | 40.00 | 0.00 | 40.00 | 0.00 | 45.00 | 0.00 | 75.00 |
| Shares Outstanding (million shares) | 13.15 | 13.15 | 13.15 | 13.15 | 13.15 | 13.15 | 13.15 | 13.15 | 13.15 |
Source: Omega Investment
Financial data (full-year basis)
| Unit: million yen | 2018 | 2019 | 2020 | 2021 | 2022 | 2023 | 2024 | 2025 |
| (Income Statement) | ||||||||
| Sales | 15,792 | 18,258 | 19,117 | 24,777 | 25,318 | 27,568 | 29,278 | 29,679 |
| Year-on-year | 4.2% | 15.6% | 4.7% | 29.6% | 2.2% | 8.9% | 6.2% | 1.4% |
| Cost of Goods Sold | 9,590 | 11,388 | 11,484 | 15,071 | 14,891 | 16,596 | 17,542 | 17,554 |
| Gross Income | 6,202 | 6,870 | 7,633 | 9,706 | 10,427 | 10,972 | 11,736 | 12,125 |
| Gross Income Margin | 39.3% | 37.6% | 39.9% | 39.2% | 41.2% | 39.8% | 40.1% | 40.9% |
| SG&A Expense | 4,541 | 4,946 | 5,247 | 6,878 | 6,641 | 6,923 | 7,253 | 7,818 |
| EBIT (operating profit) | 1,534 | 1,780 | 2,245 | 2,707 | 3,561 | 3,812 | 4,232 | 4,049 |
| Year-on-year | 3.9% | 16.0% | 26.1% | 20.6% | 31.5% | 7.1% | 11.0% | -4.3% |
| Operating profit Margin | 9.7% | 9.7% | 11.7% | 10.9% | 14.1% | 13.8% | 14.5% | 13.6% |
| EBITDA | 2,149 | 2,424 | 2,852 | 3,646 | 4,732 | 5,031 | 5,482 | 5,326 |
| Pretax Income | 1,691 | 1,913 | 2,453 | 2,933 | 3,630 | 4,010 | 4,454 | 6,018 |
| Consolidated Net Income | 1,137 | 1,273 | 1,685 | 1,804 | 2,301 | 2,625 | 3,049 | 4,110 |
| Minority Interest | 26 | 36 | 130 | 164 | 51 | 29 | 35 | 35 |
| Net Income ATOP | 1,111 | 1,237 | 1,555 | 1,640 | 2,250 | 2,596 | 3,014 | 4,076 |
| Year-on-year | 2.7% | 11.3% | 25.8% | 5.4% | 37.2% | 15.4% | 16.1% | 35.2% |
| Net Income Margin | 7.0% | 6.8% | 8.1% | 6.6% | 8.9% | 9.4% | 10.3% | 13.7% |
| (Balance Sheet) | ||||||||
| Cash & Short-Term Investments | 6,751 | 7,845 | 7,365 | 9,745 | 10,296 | 13,139 | 14,641 | 19,146 |
| Total assets | 20,033 | 22,442 | 26,450 | 30,972 | 30,924 | 33,444 | 36,195 | 40,058 |
| Total Debt | 102 | 749 | 2,808 | 702 | 441 | 367 | 107 | 209 |
| Net Debt | -6,650 | -7,096 | -4,557 | -9,042 | -9,856 | -12,773 | -14,534 | -18,937 |
| Total liabilities | 5,488 | 7,082 | 9,867 | 8,504 | 7,560 | 8,361 | 8,194 | 9,331 |
| Total Shareholders’ Equity | 14,248 | 15,000 | 16,083 | 21,920 | 23,069 | 24,763 | 27,645 | 30,335 |
| (Cash Flow) | ||||||||
| Net Operating Cash Flow | 1,577 | 1,829 | 3,111 | 2,569 | 2,802 | 4,794 | 3,412 | 4,391 |
| Capital Expenditure | 601 | 528 | 1,146 | 1,183 | 945 | 824 | 1,052 | 957 |
| Net Investing Cash Flow | -940 | -806 | -5,229 | -1,395 | -957 | -763 | -889 | 1,248 |
| Net Financing Cash Flow | -481 | -30 | 1,477 | 1,193 | -1,234 | -1,192 | -1,371 | -1,127 |
| Free Cash Flow | 1,468 | 1,753 | 2,689 | 2,486 | 2,734 | 4,608 | 2,860 | 4,083 |
| (Profitability ) | ||||||||
| ROA (%) | 5.75 | 5.82 | 6.36 | 5.71 | 7.27 | 8.06 | 8.66 | 10.69 |
| ROE (%) | 8.00 | 8.46 | 10.01 | 8.63 | 10.00 | 10.85 | 11.50 | 14.06 |
| Net Margin (%) | 7.03 | 6.77 | 8.14 | 6.62 | 8.89 | 9.42 | 10.30 | 13.73 |
| Asset Turn | 0.82 | 0.86 | 0.78 | 0.86 | 0.82 | 0.86 | 0.84 | 0.78 |
| Assets/Equity | 1.39 | 1.45 | 1.57 | 1.51 | 1.38 | 1.35 | 1.33 | 1.32 |
| (Per-share) Unit: JPY | ||||||||
| EPS | 99.4 | 110.6 | 139.0 | 130.0 | 171.3 | 197.7 | 231.8 | 314.0 |
| BPS | 1,274.7 | 1,342.0 | 1,409.7 | 1,672.2 | 1,754.8 | 1,895.9 | 2,130.2 | 2,337.1 |
| Dividend per Share | 50.00 | 50.00 | 54.00 | 54.00 | 58.00 | 70.00 | 80.00 | 120.00 |
| Shares Outstanding (million shares) | 12.94 | 12.94 | 12.94 | 13.15 | 13.15 | 13.15 | 13.15 | 13.15 |
Source: Omega Investment