2026-06-26
Home
Japanese

Omega Investment Co., Ltd.
Chiome Bioscience (Investment report – Basic)
| Share price (9/22) | ¥154 | Dividend Yield (25/12 CE) | – % |
| 52weeks high/low | ¥145/155 | ROE(24/12 act) | -66.9 % |
| Avg Vol (3 month) | 820.9 thou shrs | Operating margin (TTM) | -132.0 % |
| Market Cap | ¥9.1 bn | Beta (5Y Monthly) | 0.3 |
| Enterprise Value | ¥7.9 bn | Shares Outstanding | 68.053 mn shrs |
| PER (25/12 CE) | – X | Listed market | TSE Growth |
| PBR (24/12 act) | 6.0 X |
| Click here for the PDF version of this page |
| PDF version |
New drug candidates taking on pediatric cancers. Re-rating expected on the forthcoming positive share price catalysts
Investment conclusion
Chiome Bioscience Inc. (the “Company”) is transitioning to a dual-track model that leverages cash to support drug discovery and biosimilars (IDD-type) while focusing on its in-house, clinical-stage pipeline. Due to front-loaded business investment, the Company posted an operating loss of 536 million yen in Q2 FY12/2025 (net sales of 251 million yen). In CBA-1205 (DLK-1), a PR case (partial response: ≥30% tumor reduction) was confirmed in hepatocellular carcinoma, and in addition to long-term dosing in melanoma (SD with tumor reduction for more than 48 months), a pediatric cancer cohort is under additional consideration. This progress, which indicates the potential for label expansion, is significant as material for out-licensing negotiations. In CBA-1535 (Tribody®), no material safety concerns have been reported in the first part of the Phase 1 study, and biomarker changes for T cell activation are beginning to be observed. Furthermore, the exclusive license of PFKR (anti-CX3CR1 antibody) to Asahi Kasei Pharma (with an upfront payment of 200 million yen and development/sales milestones of approximately 24.8 billion yen) can be viewed as external validation of the Company’s drug discovery capability. On the revenue base, the Company concluded MSAs with Mycenax and Kidswell Bio (Securities code: 4584; Growth; hereinafter, Kidswell), for new biosimilar development, and, in collaboration with Alfresa, a leading pharmaceutical wholesaler, is involved in building Japan’s first end-to-end supply chain. Expansion of the IDD (Integrated Drug Discovery)-type business, leveraging the antibody discovery platform, could become a mid-term driver that contributes to narrowing losses.
On the financial side, while cash and deposits of 1.47 billion yen, along with an equity ratio of 76.9%, provide a cushion, operating cash flow remains negative, and cash consumption continues. Consequently, a key point of interest is whether cash generation will be brought forward through any of (i) additional out-licensing, (ii) milestones, or (iii) expansion in contract services. The market values the Company at a market capitalization of 9.1 billion yen, PBR of 6.08x, ROE of −66.9% and ROA of −41.3%, with a beta of 1.22 (12 months; high volatility). The share price is currently hovering around 140 yen (as of August 12, 2025), and the environment is highly event-sensitive.
In sum, while in the short term the level reflects the risks of cash burn and clinical progress, if (i) indication expansion and clinical signals in CBA-1205, (ii) data enhancement through extension of the monotherapy part in CBA-1535, and (iii) additional out-licensing following PFKR or the conversion of IDD projects materialize stepwise, there is room for a re-definition of valuation. The recommended stance is “strategically neutral to slightly bullish,” premised on event-driven dynamics. The core is tracking progress in development and out-licensing, with a satellite focus on building IDD and contract services.
1. Company overview
Moving to a “dual-track” with antibody drug discovery × Drug discovery support × IDD. A small, elite antibody venture strong in upstream processes
The Company is an antibody drug discovery venture established in 2005 and listed on the TSE in 2011. Headquartered in Shibuya-ku, Tokyo (with an attached Technology Research Laboratory), it has a Drug Discovery Research Laboratory in Kawasaki City and 62 employees (as of June 2025). Its mission is “To accelerate drug discovery and development of mAb for therapeutics to overcome current medical unmet-needs.” In March 2025, Masamichi Koike assumed the office of President and Representative Director, and the structure was revised to integrate R&D and business development.
The businesses comprise (i) the “Drug Discovery and Development Business,” which aims for early out-licensing of candidate antibodies created in-house; (ii) the “Drug Discovery Support Business,” which undertakes antibody generation and protein expression/purification for pharmaceutical companies and academia; and, in addition, (iii) the platform-type “IDD” established in 2025. The revenue models are: drug discovery—upfront payments, development/sales milestones, and royalties; support—contract fees; and IDD—collaborative research-type.
The technology base consists of ADLib®, which can obtain human antibodies in a short time in vitro with less constraint from immune tolerance, and the multi-specific antibody technology Tribody®, which enables the design of three or more binding sites. A key strength is the ability, with a small team, to drive end-to-end development from discovery through CMC (Chemistry, Manufacturing, and Control) to early clinical phases, and it possesses a platform that accommodates modality evolution (multi-specific). In the pipeline, CBA-1205 targeting DLK-1 and the T cell engager CBA-1535 are in Phase 1. The Company also owns multiple non-clinical themes, such as PCDC (envisioned for ADC) and PTRY. In external collaboration, in November 2024, the CX3CR1 antibody (PFKR) was exclusively licensed to Asahi Kasei Pharma (with an upfront payment of 200 million yen and development/sales milestones of approximately 24.8 billion yen), thereby gaining external validation.
Furthermore, in May 2025, the Company jointly applied with Alfresa Holdings, Kidswell, and the Ministry of Health, Labour and Welfare’s biosimilar subsidy program and was certified as a target enterprise. In addition, together with Taiwan’s Mycenax Biotech Inc., the Company concluded an MSA on new biosimilar development. It advanced the commercialization of IDD by building a total value chain across the four companies.
Overall, the Company has a “dual-track” business model that operates in parallel, maximizing drug discovery value (in-house through early clinical stages) and revenue diversification through Drug discovery support and IDD. Although small in scale, at this stage it is expanding both the depth of the out-licensing pipeline and its cash-generation capability by leveraging practical drug discovery capabilities that bundle upstream functions and external alliances.
2. Business characteristics and description
Executing end-to-end, both the “ability to create” and the “ability to finish.” Upstream-focused drug discovery operations driven by ADLib® × Tribody® × IDD.
The Company’s distinguishing feature is its practical capability in the upstream processes of drug discovery, which a small team can bundle from discovery through CMC to early clinical trials. Centered on ADLib®, which can obtain human antibodies in a short time in vitro with less constraint from immune tolerance, and on the multi-specific antibody technology Tribody®, which enables the design of three or more binding sites, it connects in-house protein preparation, antibody engineering, non-clinical, CMC, and clinical operations. A framework has been established to rush from “screening and judging” antibody candidates through entry into early clinical trials. Furthermore, the Company is developing “DoppeLib™,” a new technology designed for the high-throughput generation of bispecific antibodies, thereby expanding its readiness for next-generation modalities.
The revenue model has three layers: (i) Drug Discovery and Development Business: enhance value through preclinical to early clinical and out-license to seek upfront payments, development/sales milestones, and royalties; (ii) Drug Discovery Support Business: secure recurring revenue through contracts for antibody generation and expression/purification; and (iii) IDD: a platform-type that monetizes the Company’s knowledge and experience (intelligence) through collaborative research. In 2025, as part of IDD, the Company concluded an MSA on new biosimilar development with MBI (Mycenax Biotech Inc.) and Kidswell, and is involved in constructing a domestic supply chain.
In the pipeline, CBA-1205 and CBA-1535 are in Phase 1, and the Company also holds non-clinical themes such as PCDC. Regarding external collaboration, PFKR has been exclusively licensed to Asahi Kasei Pharma, and external validation of the company’s drug discovery capabilities has also been obtained. This “upstream focus × multi-layered revenue” design both restrains funding needs in the front-investment phase and supports improvement in the certainty and negotiating power for out-licensing.
3. Major shareholders and investment trends
A large free float amplifies volatility. A dispersed structure of “individuals at the center × small-lot institutions”
As of August 15, 2025, major shareholders are led by individuals, totaling only 8.84% even for the top ranks. The largest is Yasuhiro Ogawa at 2.06%, followed by Kenji Watanabe at 1.63%, Kunifumi Ota at 1.43%, Fumishige Ehira at 1.42%, Shun Makihata at 0.72%, and Fukutaro Yamato at 0.71%, among others. Among operating or investment companies, Next Growth Co., Ltd. holds 0.45% and Growth Capital Co., Ltd. holds 0.30%, while the Company’s own shares are only 0.02%. Over six months, there have been no notable increases or decreases in share counts among major shareholders, indicating stable movement.
As a dilution factor, an increase in shares outstanding during the period (66,969,000 → 68,053,800; end-FY12/2024 → end-1H FY12/2025) can be confirmed. However, treasury shares, at 12,149, are minimal in scale and are considered to have a limited impact on the current supply–demand balance. On the other hand, a structure with a low concentration among top shareholders and a sizeable free float tends to heighten price elasticity to events (such as clinical progress, out-licensing, or financing). In fact, the Company’s beta is 1.22, a relatively high level of market sensitivity.
From an IR perspective, the entry of Next Growth and Growth Capital, based on information disclosed in December 2024, suggests the potential for supplementation on the funding and business fronts through external networks. Meanwhile, the high ratio of individual shareholders could, through the turnover of short-term capital, contribute to volatility. Accordingly, three points should continue to be monitored: (i) the presence or absence of dilution events (public offerings, third-party allotments, exercise of stock options, etc.); (ii) the inflow of new corporate or strategic investors; and (iii) the presence or absence of treasury stock policies. The current dispersed shareholder structure maintains flexibility in governance; however, the share price is prone to event-driven fluctuations. The formation of medium-term stable shareholders and clarification of capital policy would contribute to smoothing the evaluation process.
4. Medium-term management plan
Maximize out-licensing value through “thicker” clinical data. Lift cash-generation power by expanding IDD and contract services.
The Company’s medium-term plan offers limited numerical targets, and for full-year 2025, the Company’s forecast remains undisclosed (only 500 million yen in Drug discovery support sales is indicated). The achievement scenario is clear: (i) deepen early-stage clinical data for the in-house pipeline and, through out-licensing after Phase 1, obtain upfront payments, milestones, and future royalties; and (ii) stack stable revenue in Drug discovery support and IDD to fund research investment autonomously.
Two priorities can be considered. First, for CBA-1205, with a PR case in hepatocellular carcinoma and long-term SD with tumor reduction in melanoma (more than 48 months), a pediatric cancer cohort has been added. By building “thickness” in the data with an eye to indication expansion, the aim is to enhance negotiating power for out-licensing. For CBA-1535, the monotherapy part has been extended to continue confirming safety and pharmacodynamic signals, and the possibility of out-licensing based on monotherapy data alone is also mentioned.
Second, in the revenue foundation, Drug discovery support targets a segment margin of 50% through higher-value-added services, with a policy of improving profitability by deepening transactions with major domestic companies. In IDD, through MSAs with Mycenax Biotech Inc. and Kidswell, the Company participates in cell line development for biosimilars. Together with selection under the Subsidy Program for the Development of Domestic Manufacturing Facilities for Biosimilars by the MHLW, the Company is involved in building a domestic supply chain. It aims to make this a pillar of mid-term revenue.
In addition, through new technologies such as DoppeLib™, the Company is pursuing the high-throughput generation of bispecific antibodies and continues to invest in its base to enhance future lead-generation efficiency. Overall, this is a practical medium-term plan that seeks to maximize out-licensing value through the quantity and quality of clinical data × external alliances while strengthening cash generation through contract services and IDD.
5. International business
Widening “exits” through global IP × overseas collaboration. Building a rights network in the U.S./Europe/China, and a manufacturing network in Asia
Although clinical execution is currently centered in Japan, the Company is steadily building the “foundation for international development.” First, patents for the main pipeline (including CBA-1205 and CBA-1535) have been granted across multiple jurisdictions, including Japan, the United States, Europe, and China. The Company holds a rights network that can extend the reach of out-licensing negotiations to major overseas companies. Second, collaboration with overseas players is advancing. In Drug discovery support, there is a reference to the expansion of the scope of a business alliance with Merck, widening relationships with foreign pharmaceutical companies. Moreover, the Company concluded MSAs on new biosimilar development with Taiwan’s Mycenax Biotech Inc. and domestic Kidswell. Under this framework, it participates in cell-line development and is designed to play a key role in supply chain collaboration that includes Asia. Third, in the internationalization of research collaboration, the Company is considering adding a pediatric cancer cohort for CBA-1205 through cooperation with Spain’s IGTP. The suggestion of indication expansion contributes to enhancing value at the time of overseas out-licensing.
From the standpoint of revenue opportunities, the exclusive license granted to PFKR by Asahi Kasei Pharma must cover worldwide rights to development, manufacturing, and sales. The economics, including post-launch royalties, offer scope for global out-licensing based on worldwide rights, and the accumulation of contracts of this type will form the foundation of future international revenue. On the other hand, challenges accompanying international development include (i) alignment with global standards for technology transfer and CMC, (ii) regional differences in clinical trial design and regulatory requirements, and (iii) foreign exchange and regulatory change risk. In response, the Company adopts a strategy of building development and manufacturing in optimal locations while holding end-to-end upstream functions (discovery to CMC to early clinical) in-house and complementing them with external CDMOs/partners.
Through a three-pronged structure of multi-jurisdictional patents, transactions with foreign companies, and manufacturing collaboration in Asia, the bridge from “domestic clinical → overseas out-licensing/joint development” is being clarified. In the medium term, (i) additional out-licensing to overseas counterparties, (ii) initiation of international joint or combination trials, and (iii) progress in biosimilar cell-line projects will be milestones for expanding international business.
6. Long-term performance
Losses are narrowing; revenue is on a stepwise uptrend. Running “out-licensing × contract services” in parallel to close the distance to break-even
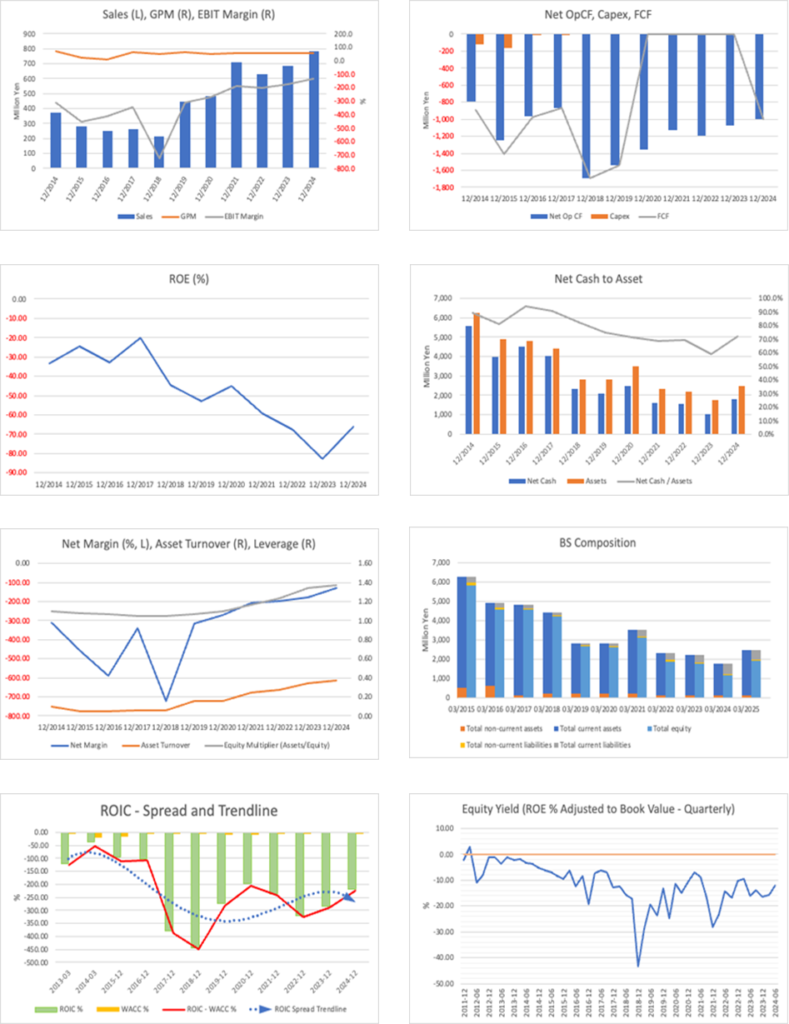
Over the past five years, net sales rose from 481 million yen in 2020 to 781 million yen in 2024. Although losses have been persistent, ordinary loss narrowed from 1.29 billion yen (2020) to 1.02 billion yen (2024), and net loss similarly improved from the 1.29 to 1.02 billion yen range. The equity ratio increased from 65.1% (2023) to 77.4% (2024), maintaining thickness while continuing front-loaded R&D investment (shares outstanding increased). In 2H 2024, an upfront payment (200 million yen) accompanying the exclusive license agreement for PFKR was recorded, and, notably, external out-licensing contributed to a lift in sales.
In the first half of 2025, on a cumulative basis, net sales totaled 251 million yen, and the operating loss was 536 million yen; despite continuing losses, the loss margin narrowed year-over-year. On the balance sheet, cash and deposits totaled 1.47 billion yen, and the equity ratio was 76.9%, providing a cushion. Operating cash flow was -673 million yen, continuing the cash outflow trend, with research and development expenses remaining the primary cause of cash outflow.
Taken together, the long-term picture is a trajectory of approaching break-even through “stable revenue from Drug discovery support + stacking of revenue events through out-licensing.” The lift in sales will be driven by higher-value-added contracts and new customer acquisitions in contract services, while operating leverage on profits depends heavily on the timing and terms of out-licensing for CBA-1205/1535. As demonstrated by PFKR in 2024, it has been confirmed that an exit design in preclinical to early clinical is the shortcut to monetization. Going forward, if any of (1) indication expansion in CBA-1205 (addition of a pediatric cohort) and accumulation of signals in hepatocellular carcinoma, (2) data enhancement through extension of the monotherapy part in CBA-1535, or (3) continued wins in IDD/biosimilar projects materialize, a step-up in sales and a renewed acceleration of loss-narrowing can be expected. In addition, as long as the negative pressure on operating cash flow persists, additional out-licensing, upside in contract services, or timely and appropriate use of financing options will be essential to financial stability.
7. Performance in the most recent financial results
Losses are narrowing steadily; cash on hand is ample. A phase of building “stepping stones” to out-licensing while raising the “quality” of research investment
In Q2 FY12/2025 (cumulative), net sales were 251 million yen (−4.5% YoY). By segment, Drug discovery support was 251 million yen, and Drug discovery & development recorded none. Operating loss was −536 million yen (vs. −581 million yen a year earlier), ordinary loss −539 million yen, and net loss for the interim period −540 million yen, indicating narrower losses. On the cost side, R&D expenses were 395 million yen ( -50 million yen YoY) due to a decline in high-cost equipment expenses, while SG&A and other expenses totaled 392 million yen, a slight decrease. As a result, the bottom line is gradually lifting. On the balance sheet, total assets were 1.962 billion yen, net assets were 1.519 billion yen, and the equity ratio was 76.9%. Cash and deposits totaled 1.474 billion yen, maintaining the necessary cushion for continued research investment. Operating cash flow was −673 million yen, indicating continued cash consumption, and financing cash flow was +84 million yen. Ending cash decreased to 1.474 billion yen (from 2.063 billion yen at the beginning of the period).
In terms of business progress, the strengthening of the pipeline stands out. In CBA-1205, a PR case was confirmed in hepatocellular carcinoma, and following long-term dosing in melanoma (SD with tumor reduction), a pediatric cancer cohort is under consideration. In CBA-1535, the monotherapy part has been extended, and confirmation of safety and signals of T cell activation continues. These can be interpreted as “thickening” the data in preparation for out-licensing negotiations after Phase 1, and together with stable sales in Drug discovery support, this movement can be economically profitable as diversifying the path to monetization.
For investment implications: (i) losses are narrowing due to cost optimization; (ii) cash on hand is ample, but operating cash flow remains negative; and (iii) accumulation of clinical signals directly improves out-licensing terms. Therefore, in the short term, managing the balance between cash burn and event progress is key. In the medium term, out-licensing/milestone capture and upside in contract services will serve as catalysts for growth.
8. Full-year earnings forecast
“Range management” under “no forecast disclosed.” Build the second half on two layers: Drug discovery support and event revenue
For the full-year 2025, the Company does not disclose a company-wide earnings forecast. It indicates only 500 million yen for net sales in the Drug Discovery Support Business (no range or profit targets disclosed). Net sales in the first half (January–June) totaled 251 million yen, and to reach the indicated figure, an accumulation of approximately 250 million yen will be needed in the second half. As materials for attainability, the expansion of the contract scope with Merck and new basic agreements with Nittobo and Mochida Pharmaceutical can be cited as an expansion of the transaction base in Drug discovery support. Furthermore, commencement of cell-line development under the MSA for biosimilar development offers room to contribute as a mid-term revenue source of the IDD type.
The profit range is opaque. The operating loss in the first half was -536 million yen, and the level of R&D expenses remains high. The addition of a pediatric cancer cohort in CBA-1205 and the extension of the monotherapy part in CBA-1535 are stepping stones that raise future out-licensing value; however, it is appropriate to view the contribution to revenue within 2025 as limited. Although cash on hand is 1.47 billion yen and there is a cushion, operating cash flow remains negative, and cash consumption continues. Therefore, in the second half, the upside in the utilization rate and average unit price of Drug discovery support will be the leading factor in profit improvement.
Points of investment focus are (i) order momentum in Drug discovery support (quarterly sales trend), (ii) the speed of conversion of IDD/biosimilar into projects, and (iii) updates on clinical progress and indications of out-licensing negotiations (disclosure of quantitative signals). The base case is “attainment of 500 million yen in Drug discovery support + narrowing of losses,” the upside case is “materialization of additional out-licensing and milestone capture,” and the downside case is “slowing of order growth and front-loaded development expenses.”
9. Growth strategy and risks
Maximize out-licensing value through “thickness of clinical data × external alliances.” Management of cash consumption and the feasibility of events are key
The Company’s growth strategy rests on three pillars: (i) maximizing the value of the in-house pipeline; (ii) expansion of stable revenue through contract services and IDD; and (iii) investment in the technology base. In (i), CBA-1205 has a PR case in hepatocellular carcinoma and long-term SD with tumor reduction in melanoma already confirmed, and a pediatric cancer cohort is added as a stepping stone toward indication expansion. The scenario of aiming to obtain upfront payments, milestones, and future royalties through out-licensing after Phase 1 is clear. In CBA-1535, the monotherapy part is extended, and confirmation of safety and signals of T cell activation continues. Additionally, there is mention of the possibility of out-licensing based on monotherapy data. In (ii), while expanding transactions with major pharmaceutical companies and accumulating new agreements in drug discovery support, the Company has started cell-line development for new biosimilars as IDD. Selection under the Subsidy Program for the Development of Domestic Manufacturing Facilities for Biosimilars by the MHLW is also a tailwind. In (iii), in addition to ADLib®/Tribody®, the Company is strengthening base technologies such as “DoppeLib™” for high-throughput generation of bispecific antibodies, thereby raising the efficiency of future lead creation. Furthermore, with the global exclusive license of PFKR, external validation has already been obtained, and the accumulation of similar contracts broadens revenue opportunities.
The principal risks are: (a) clinical trial risk (efficacy, safety, enrollment speed). For CBA-1205/1535, depending on delays or outcomes, out-licensing terms could worsen. (b) funding risk. Operating cash flow is negative, cash on hand is on a declining trend, and there is an embedded possibility of financing and dilution. (c) regulatory, CMC, and approval risk. Differences in requirements accompanying international expansion and technology transfer could raise development costs and time. (d) customer concentration and competition in contract services. If higher-value-added support in drug discovery is delayed, the underpinning of revenue weakens. (e) IP and competition. Maintaining patent networks across multiple jurisdictions and differentiation are essential. To mitigate these risks, the Company implements measures that reduce uncertainty through pipeline diversification, leveraging external partnerships, deepening contract services with major domestic companies, strengthening its technology base, and range management (full-year forecast disclosed only for Drug discovery support sales).
10. Share price trends and equity valuation
A highly volatile, event-driven market. A sense of valuation because of “high PBR × loss phase,” and management of short-term risks
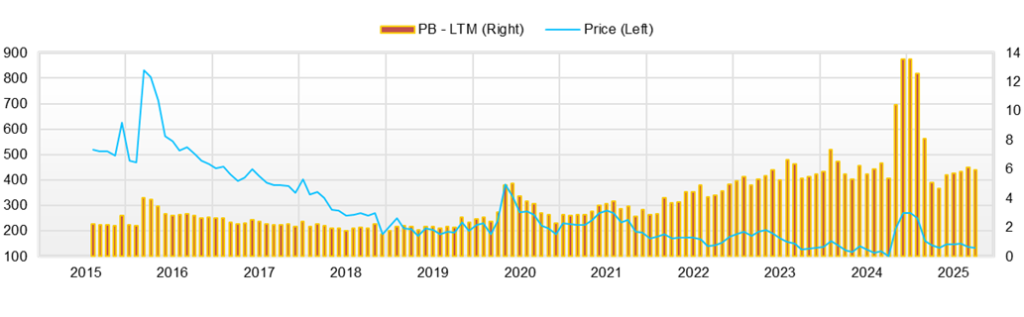
Over the most recent 12 months (roughly August 1, 2024 to August 26, 2025) the share price hit a low of 97 yen in September 2024, then surged to 304 yen in November, thereafter reached a YTD high of 294 yen in January 2025, a YTD low of 111 yen in April, and in summer moved sideways around 140 yen—a “large two-way range market.” Currently, from mid- to late August, it has been moving in the 139–145 yen range.
Valuation stands at PBR 6.08x and a market capitalization of 9.1 billion yen. Because the Company is in a loss phase, PER/EV-EBITDA has little practical meaning; it is reasonable to interpret the current state as one in which option value for assets, the technology platform, and the pipeline (out-licensing potential) is primarily being economically profitable. A profile of ROE -66.9%, ROA -41.3%, and beta 1.22 simultaneously suggests poor capital efficiency and high volatility.
In conclusion, there is a two-layer structure of “short term: strong swings in response to events / mid term: room for re-rating depending on the accumulation of out-licensing and contract services.” Although the absolute level of PBR is high, if clinical signals accumulate and out-licensing becomes concrete, a significant upward shift in the share price range can occur; on the other hand, note that if progress stalls and dilution and supply–demand deterioration overlap, the downside can be swift.
Short-term risks can be summarized in five points.
(i) Event risk: depending on the “presence/absence, quality, and timing” of materials such as Phase 1 progress and out-licensing negotiations, gap openings at the open and sharp rises/falls can easily occur. Exploratory forward-looking indications (observation of signals or addition of a pediatric cohort, etc.) do not directly lead to sustained improvement in supply–demand, and rallies may end quickly.
(ii) Financing and dilution: because losses continue and operating cash flow is negative, options such as public offerings, third-party allotments, and exercise of stock options are constantly embedded. In phases where good news drives the share price up, a “window for financing” opens, and potential supply shocks are more easily amplified. A dispersed shareholder structure (large free float) promotes the turnover of short-term capital and leads to cyclical volatility of materials → speculative buying → financing expectations → selling into strength.
(iii) Communication: under a disclosure policy of no company-wide forecast and indicating only Drug discovery support sales, if quantitative and qualitative explanations are insufficient, consensus is hard to form, and disappointment selling and excessive optimism intersect. In earnings briefings and Q&A sessions, how far the outlook for out-licensing, the design of combination/second parts, and IDD project timelines are disclosed will determine the short-term positioning.
(iv) Technicals and liquidity: trading volume surges and plunges around events; when trading is thin, the order book becomes a vacuum. Psychological lines (100 yen, 150 yen), which sell into previous highs and buy on dips near lows, are prone to becoming battle lines.
(v) External factors: sector sentiment is likely to swing with peers’ clinical news, exchange rates, and interest rates, and policy moves such as regulation and drug pricing. In sum, the width of fluctuation is determined by whether the four points of “quality and quantity of materials,” “dilution expectations,” “disclosure timing,” and “external environment” align in the same direction. For chasing the upside, confirm the sustainability of materials; for buying on dips, confirm the outlook for funding and vacuum zones in the supply–demand balance.
11. Equity investment conclusion derived from business performance and share price review
Capture by managing “option value with high event sensitivity.” Two wheels: out-licensing feasibility × stability in contract services.
The Company’s stock has a strong “event-linked” nature in which the accumulation of clinical data directly lifts valuation. In CBA-1205, a PR case has been confirmed in hepatocellular carcinoma and long-term SD with tumor shrinkage in melanoma, and an additional pediatric cancer cohort is under consideration. The scope for indication expansion is coming into view, and the environment is taking shape to strengthen negotiating power for out-licensing. CBA-1535 has extended the monotherapy part and continues to verify signals of T cell activation and safety; there is also mention of the possibility of out-licensing based on monotherapy data. In addition, the global exclusive license for PFKR (upfront payment + maximum milestones + future royalties) can be evaluated as external validation and proof of a monetization route.
On the other hand, in fundamentals, on a cumulative basis for Q2 FY12/2025, net sales were 251 million yen, an operating loss of 536 million yen, and cash on hand was 1.47 billion yen. While there are signs of narrowing losses, operating cash flow remains negative, and range management continues, with only Drug discovery support sales of 500 million yen being disclosed, and no company-wide forecast is provided. As measures to bolster contract services and IDD, cell-line development for biosimilars based on the MSA is progressing and could contribute to mid-term stable monetization.
Market valuation is 9.1 billion yen, with a PBR of 6.08x, an ROE of -66.9%, an ROA of -41.3%, and a beta of 1.22. Because it is in a loss phase, PER has little meaning; the principal axes of economic profitability are therefore “option value of the pipeline + underpinning by contract services.” Accordingly, in investment practice, three core items are (i) position management around events (progress, disclosure timing, and dilution expectations), (ii) checking the trends of utilization and unit price in contract services, and (iii) monitoring cash on hand and financing moves. Triggers will include the start of enrollment in the pediatric part of CBA-1205, additional responses, clear pharmacodynamic signals in CBA-1535, new out-licensing/milestone receipts following PFKR, and the visualization of project conversion and monetization in IDD. While discerning the quality and sustainability of events, phased accumulation on dips and parallel management of dilution and funding risks are recommended.
12. Transition of return on equity (ROE) and current assessment
The causes of “negative ROE” are profit margin and scale. Move above water without out-licensing events and thickness in contract services.
The Company’s most recent ROE is -66.9%. Because losses have been recorded on an ongoing basis in past years, the ROE item in the leading indicators section of the securities report has been omitted (2020–2024). In FY12/2024, net sales were 781 million yen, a net loss of 1.021 billion yen, net assets of 1.920 billion yen, and total assets of 2.469 billion yen. The structure continued, with the scale of losses exceeding the cushion of equity. On a cumulative basis for Q2 FY12/2025, net sales were 251 million yen, with a net loss for the interim period of 540 million yen, and an equity ratio of 76.9%. While financial thickness is maintained, earnings remain in a loss territory. Operating cash flow has been negative, with cash on hand decreasing to 1.474 billion yen, and R&D investment is the primary cause of the cash outflow.
Viewed through DuPont decomposition, the most significant constraint is the net profit margin, and a loss structure centered on R&D expenses is directly exerting negative pressure. In addition, because sales scale is small, total asset turnover remains low, and because the equity ratio is high—i.e., leverage is hard to apply—there is a background in which it is difficult to offset negative ROE. Therefore, a reversal of the Company’s ROE presupposes “breaking even and stabilizing in the black,” and triggers a concentration in two areas. First, creating a “step” in profit margin by obtaining upfront payments and milestones through out-licensing in preclinical to early clinical. In fact, in 2024, an upfront payment was recorded from the global exclusive license of PFKR, and it has been demonstrated that this model is effective. Second, increasing the thickness of Drug discovery support/IDD to compress the base loss structurally. For 2025, only 500 million yen in Drug discovery support sales is disclosed, and upside in utilization and unit price is the royal road to approaching break-even. In addition, cell-line development for biosimilars through MSAs could serve as a mid-term stable revenue base that improves ROE.
While the current market valuation at PBR 6.08x anticipates future option value, ROE is profoundly damaging, and consistency is hard to achieve. Only when the three conditions of quantitative results in out-licensing (upfront/milestones), accumulation in Drug discovery support/IDD, and restraint on dilution with optimization of expenses align will a scenario of moving from a negative to a low positive ROE become realistic.
13. Analysis of economic profit creation based on ROIC and WACC
Negative ROIC and positive cost of capital. Implement “upfront + contract gross margin” to reverse economic profit.
In this section, the Company’s economic profit creation is examined in the framework of economic profit = (ROIC − WACC) × invested capital. First, ROIC (NOPAT / invested capital) is negative as long as earnings are in loss. The operating loss in Q2 FY12/2025 (cumulative) was -536 million yen, and even after considering tax effects, NOPAT remains negative. In the previous year, FY12/20,24, both ordinary and net results were losses, and structurally, a positive ROIC is not being secured. Meanwhile, WACC (weighted average cost of capital) remains positive as long as the risk-free rate and market risk premium are both positive. Therefore, current economic profit is mechanically interpreted as negative.
From the perspective of invested capital, total assets at the end of Q2 FY12/2025 were 1.962 billion yen, of which cash and deposits accounted for a substantial 1.474 billion yen. Excess money serves as a buffer for funding, but unless R&D expenses are converted into profit, it does not improve ROIC. Conversely, if “effective invested capital” is viewed as invested capital minus excess cash, the denominator becomes smaller; however, because the numerator (NOPAT) is negative, the ROIC still remains negative. In terms of total asset turnover as well, with FY12/2024 net sales of 781 million yen against year-end total assets of 2.469 billion yen, the insufficiency of scale is clear. Among the three elements of ROIC (profit margin × turnover × leverage), both profit margin and turnover are simultaneously bottlenecks.
The practical solution for reversing economic profit concentrates on two levers. The first is a step improvement in profit margin: upfront payments and milestones from out-licensing are high gross margin income, as demonstrated with PFKR. If clinical signals in CBA-1205 and CBA-1535 accumulate, there is a significant opportunity for short-term improvement in ROIC through the acquisition of the next upfront. The second is thickness in contract services/IDD: for 2025, the Company discloses an outlook only for Drug discovery support sales of 500 million yen (no company-wide forecast), and upside in utilization and unit price structurally narrows losses and stabilizes the numerator of ROIC. In addition, cell-line development for biosimilars based on MSAs could raise the base of ROIC as a mid-term recurring gross margin.
At present, ROIC < WACC, and economic profit is negative. However, if the “two-stage rocket” of (i) step improvement through high gross margin income from out-licensing + (ii) accumulation of stable gross margin from contract services/IDD operates, first a narrowing of the negative width of ROIC toward around zero can be seen, and then, through improvement in turnover (expansion of sales scale), a sequence toward ROIC > WACC becomes visible. Priority in capital allocation is positioned as (i) securing the quantity and quality of clinical data that directly raises the certainty of out-licensing, and (ii) deepening high-value-added contract services. While having a large amount of cash on hand does not directly reduce WACC in the near term, it has the indirect effect of protecting economic profit by securing the room to avoid dilution.
14. Corporate value creation viewed from free cash flow and capital allocation
Create a cash cycle with upfront and contract gross margin while maintaining the “quality of research investment”
In Q2 FY12/2025 (cumulative), cash flows were operating CF -673 million yen, investing CF virtually zero, and financing CF +84 million yen. At the period end, cash and cash equivalents declined to 1.474 billion yen. On the P&L side, against net sales of 251 million yen, the operating loss was -536 million yen, and losses continue. At the same time, there is a clear policy of not paying dividends and directing funds to R&D. This structure means that in the short term, cash consumption is front-loaded. Still, the Company is in a phase of raising the quantity and quality of clinical work while maintaining a cushion of cash on hand.
The Company’s cash-generation design has a two-layer structure. First, high-gross-margin event income from out-licensing, such as upfront payments and milestones; for PFKR, an upfront payment of 200 million yen was actually recorded in Q4 FY12/2024. Second, a stable gross margin from Drug discovery support and IDD that underpins the base. In 2025, while not disclosing a company-wide forecast, the Company indicates only 500 million yen for Drug discovery support sales. It aims to increase the profit base through improvements in utilization and unit prices in contract services. Furthermore, cell-line development for new biosimilars based on the MSA could become a mid-term source of recurring revenue.
The implications for capital allocation are clear. Given the current operating cash consumption of approximately 670 million yen over six months and a cash buffer of 1.47 billion yen, it is rational to prioritize allocation to trial designs that directly connect to maximizing the value of CBA-1205/1535 and aim for the next upfront through the “thickness” of data. At the same time, deepening projects and raising unit prices in contract services, as well as accelerating project conversion in IDD/biosimilars, will ease the base negative pressure. If out-licensing closes later than planned, it is desirable to flexibly combine small-lot capital raising and the use of subsidies/advances to extend the runway while minimizing dilution. In summary, with the two wheels of event income and contract gross margin accumulation, it is the core of corporate value creation to narrow the negative width of the FCF step by step and approach self-sustaining research investment.
15. Future potential of shareholder return measures and assessment of past achievements
Room for returns depends on the accumulation of “upfront × stable gross margin.” For now, prioritize continuation of no dividend and management of dilution
The Company’s current shareholder return is remarkably restrained. The actual dividend for FY12/2024 was 0 yen, and for FY12/2025, the outlook remains unchanged at 0 yen for both the interim and year-end. It is confirmed that retained earnings will be prioritized for R&D in the near term. In the dividend status field, “0.00 yen” is stated for 2024, “0.00 yen” for the first half of 2025, and “0.00 yen” for the full-year outlook.
Treasury shares are limited to 12,149 shares, and shares outstanding increased from 66,969,000 to 68,053,800 at fiscal year-end. There is no sign of large-scale share buybacks, which can be interpreted as a phase that emphasizes financing and human-resource incentives over returns. Notably, financing CF in the first half of 2025 was 84.67 million yen, primarily from the proceeds of share issuance through the exercise of stock options. Although dilution is involved, it can be observed that financing is being operated flexibly in line with cash needs for R&D.
As incentive measures, the Company uses stock options (15th and 16th series) and restricted stock compensation (RS) in combination; stock-based compensation expense in 2024 was 23.21 million yen. The options have exercise prices of 226 yen / 194 yen, and unexercised balances remain. These are reasonable from the standpoint of medium- to long-term human-resource lock-in and governance; however, depending on the share-price level and timing of events, short-term deterioration of supply and demand (dilution) may accompany them and requires attention.
Strengthening shareholder returns in the future presupposes the sustainability of cash-generation capability. Specifically, only in a phase where (i) upfront payments and milestones from out-licensing are continuously obtained and (ii) the indicated level of 500 million yen in Drug discovery support (for the whole year) and accumulation of gross margin in IDD are achieved, narrowing the negative width of operating CF, will discussion of share buybacks and resumption of dividends acquire realism. At this stage, with PBR high, earnings in loss, and operating CF negative, allocating capital to growth investment and minimizing dilution is a rational choice.
16. Corporate valuation (DCF, PER/PBR analysis)
An “option value” economic valuation led by PBR. Relative view on EV/S, and position DCF as an auxiliary indicator
The company’s current valuation is a market capitalization of 9.1 billion yen and a PBR ratio of 6.08x. Net assets at the end of the interim period are approximately 1.519 billion yen, which is consistent with the PBR. With cash and equivalents of 1.475 billion yen and short-term borrowings of 261 million yen, net cash is about 1.215 billion yen, and EV is approximately 7.89 billion yen. Full-year 2024 net sales were 781 million yen, so EV/Sales (LTM) is about 10.1x and P/S (LTM) is about 11.6x. Because losses continue, calculating an ordinary P/E ratio is difficult (net loss of 1.021 billion yen in 2024), and, as is typical for pre-revenue biotech companies, it can be structured to incorporate future option value ahead of capital efficiency.
For DCF, because (i) short-term FCF is negative and (ii) the timing and scale of future cash are event-dependent, sensitivity is exceptionally high. Therefore, for this stock, it is practical to confine going-concern DCF to checking the lower bound range of the share price in a conservative case and to measure upside potential using project-by-project rNPV (success-probability-adjusted upfront, milestones, and post-launch royalties for out-licensing). In quantitative terms, the focus is on how far the base of contract services (drug discovery support) sales can be stacked against EV, and how much the frequency of out-licensing events contributes to justifying EV/S.
In conclusion, PBR in the 6x range suggests paying approximately six years’ worth of option fees on net assets, and if the quality and quantity of materials are accompanied, a multi-year room for re-rating remains. Conversely, if out-licensing stalls or data remain weak, a cut in EV/S is likely to occur. In the short term, confirm a chain of events; in the mid-term, confirm the realization of EV through the two layers of contract services and out-licensing, while using DCF as an auxiliary to verify downside resilience.
17. Multiples comparison with peers
“Degree of monetization of the platform” determines the multiple. Chiome is a small-cap with high PBR; scale differences and resilience in the black are issues.
Peers for comparison are overviewed as two companies, PeptiDream and NANO MRNA. The market capitalization is approximately 200.2 billion yen for PeptiDream, 10.8 billion yen for NANO MRNA, and 9.1 billion yen for Chiome. PBR is 3.71x for PeptiDream, 4.01x for NANO MRNA, and 6.08x for Chiome, with Chiome being the highest. P/E is 13.2x for PeptiDream (Company forecast), while NANO MRNA is in a loss and cannot be calculated, and Chiome is likewise in a loss phase, making P/E not informative. These indicators show that while PeptiDream has a certain revenue base and visibility of future profits, NANO MRNA and Chiome are being economically profitable with option value before profitability is strongly reflected.
Differences in business models divide the “quality” of the multiples. PeptiDream, backed by a group of collaborations with major pharmaceutical companies, has a relatively high turnover of royalties/milestones, and capital efficiency (actual ROE) has moved in a favorable range, which permits PBR in the 3–4x range. By contrast, NANO MRNA is premised on continuing losses (as per the Company’s plan), and the stock market, while incorporating dilution, is assigning a PBR ratio of around 4x due to the option nature of the mRNA theme.
Chiome, while in the same zone as NANO MRNA in terms of market capitalization, carries a relative premium with PBR over 6x. The background includes (i) confirmation of the “reality of out-licensing” through the licensing track record of PFKR to Asahi Kasei Pharma; (ii) progress in building the thickness of data in the clinical-stage CBA-1205/1535; and (iii) strengthening of the base of stable revenue through Drug discovery support and IDD. All the same, the current ROE/ROA is profoundly damaging, and to maintain a high PBR, it is indispensable to achieve a “bridge to profits” through a chain of out-licensing milestones and upside in contract services. Conversely, PeptiDream has relatively low volatility due to the dispersion of profits and collaborations, whereas for NANO MRNA and Chiome, event sensitivity and financing trends are the main drivers of multiple adjustments. The short-term winning line depends on whether Chiome can demonstrate additional out-licensing opportunities following PFKR or clearer clinical signals, and back up the “basis for high PBR” with profits.
| Company name | Market capitalization (Billion yen) |
PBR (Actual, X) |
PER (CE, X) |
ROE (Actual, %) |
| Chiome Bioscience (4583) | 9.1 | 6.08 | ― | -66.9 |
| PeptiDream(4587) | 200.2 | 3.71 | 13.20 | 30.92 |
| NANO MRNA(4571) | 10.8 | 4.01 | ― | -27.24 |
18. Competitive advantages and strategy of the pipeline and market size
Broaden “options for out-licensing” with upstream drug discovery × two-modality system. Pediatric expansion adds to negotiating power.
The Company’s strength lies in the ability, with an upstream drug discovery base such as ADLib®/Tribody®, to proceed simultaneously with the “two-strong-modalities” of CBA-1205 and CBA-1535. The strategy is to accumulate the quality and quantity of signals in early clinical and realize value in stages through out-licensing after Phase 1. The addition of a pediatric cancer cohort in CBA-1205 is a stepping stone that widens the room for negotiation through indication expansion, and stable gross margins from contract services and IDD complement the durability of research investment.
The main risks, on the other hand, are uncertainty of efficacy due to its pre-PoC status, safety management peculiar to T cell engagers such as CRS, the demand for evidence of differentiation in the face of competition with ICIs/TKIs and other TCEs, and cash consumption. Countermeasures hinge on designs that narrow the responding population through biomarkers, refinement of combination strategies, proof of value in underserved areas such as pediatrics, and dispersion of development and funding risk through the use of partners.
The assumed markets can be grasped from domestically distributed research channels. Drugs for hepatocellular carcinoma: USD 1.52 billion in 2024 → USD 2.87 billion in 2032. Drugs for melanoma: USD 6.84 billion in 2029. Drugs for mesothelioma: USD 246 million in 2024 → USD 360 million in 2030. In the pediatric area, drugs for neuroblastoma: USD 803 million in 2023 → USD 1.1 billion in 2030; drugs for hepatoblastoma: USD 344 million in 2024 → USD 499 million in 2030. Ranges vary by vendor and scope, but for expanding active markets and underserved niches, whether the Company can draw a “practical value realization loop” of accumulating early clinical data → out-licensing → acquisition of milestones and royalties will define mid-term upside.
Key stock price data
Key financial data
| Unit: million yen | 2020/12 | 2021/12 | 2022/12 | 2023/12 | 2024/12 | 2025/12CE |
| Sales | 481 | 713 | 631 | 682 | 781 | NA |
| EBIT (Operating Income) | -1,284 | -1,334 | -1,259 | -1,205 | -1,031 | NA |
| Pretax Income | -1,291 | -1,466 | -1,238 | -1,215 | -1,018 | NA |
| Net Profit Attributable to Owner of Parent | -1,294 | -1,480 | -1,243 | -1,220 | -1,021 | NA |
| Cash & Short-Term Investments | 2,686 | 1,791 | 1,727 | 1,326 | 2,063 | |
| Total assets | 3,495 | 2,339 | 2,215 | 1,751 | 2,469 | |
| Total Debt | 291 | 291 | 291 | 291 | 282 | |
| Net Debt | -1,035 | -1,035 | -1,035 | -1,035 | -1,782 | |
| Total liabilities | 385 | 446 | 425 | 594 | 549 | |
| Total Shareholders’ Equity | 1,158 | 1,158 | 1,158 | 1,158 | 1,920 | |
| Net Operating Cash Flow | -1,360 | -1,131 | -1,191 | -1,069 | -1,001 | |
| Capital Expenditure | 0 | 0 | 0 | 0 | 0 | |
| Net Investing Cash Flow | -4 | -35 | 0 | 0 | 0 | |
| Net Financing Cash Flow | 1,944 | 271 | 1,127 | 667 | 1,738 | |
| ROA (%) | -41.06 | -50.73 | -54.57 | -61.51 | -48.37 | |
| ROE (%) | -45.15 | -59.16 | -67.48 | -82.76 | -66.33 | |
| EPS (Yen) | -36.1 | -36.7 | -28.3 | -24.6 | -17.5 | |
| BPS (Yen) | 78.7 | 46.4 | 37.0 | 22.0 | 28.7 | |
| Dividend per Share (Yen) | 0.00 | 0.00 | 0.00 | 0.00 | 0.00 | |
| Shares Outstanding (Million shares) | 58.28 | 58.28 | 58.28 | 58.28 | 66.97 |
Source: Omega Investment from company data, rounded to the nearest whole number.
Share price
Financial data (quarterly basis)
| Unit: million yen | 2023/12 | 2024/12 | 2025/12 | ||||||
| 2Q | 3Q | 4Q | 1Q | 2Q | 3Q | 4Q | 1Q | 2Q | |
| (Income Statement) | |||||||||
| Sales | 189 | 165 | 158 | 130 | 134 | 159 | 358 | 139 | 113 |
| Year-on-year | 26.6% | 6.2% | -19.6% | -23.5% | -29.2% | -3.8% | 126.1% | 7.0% | -15.7% |
| Cost of Goods Sold (COGS) | 77 | 67 | 67 | 73 | 56 | 74 | 145 | 58 | 55 |
| Gross Income | 113 | 98 | 92 | 57 | 78 | 85 | 213 | 81 | 58 |
| Gross Income Margin | 59.5% | 59.6% | 57.8% | 44.0% | 58.0% | 53.4% | 59.5% | 58.1% | 51.5% |
| SG&A Expense | 546 | 344 | 391 | 379 | 337 | 425 | 323 | 345 | 330 |
| EBIT (Operating Income) | -433 | -246 | -300 | -322 | -259 | -340 | -110 | -265 | -272 |
| Year-on-year | 48.0% | -5.4% | 36.7% | 42.6% | -40.2% | 38.1% | -63.3% | -17.9% | 5.1% |
| Operating Income Margin | -228.6% | -149.0% | -189.3% | -248.5% | -193.1% | -213.9% | -30.7% | -190.7% | -240.7% |
| EBITDA | -433 | -246 | -300 | -322 | -259 | -340 | -110 | -265 | -272 |
| Pretax Income | -435 | -254 | -300 | -303 | -259 | -351 | -105 | -265 | -273 |
| Consolidated Net Income | -436 | -255 | -302 | -304 | -260 | -352 | -105 | -266 | -274 |
| Minority Interest | 0 | 0 | 0 | 0 | 0 | 0 | 0 | 0 | 0 |
| Net Income ATOP | -436 | -255 | -302 | -304 | -260 | -352 | -105 | -266 | -274 |
| Year-on-year | 56.5% | -0.7% | 40.1% | 33.5% | -40.4% | 38.0% | -65.1% | -12.5% | 5.5% |
| Net Income Margin | -230.1% | -154.3% | -190.3% | -234.5% | -193.9% | -221.2% | -29.4% | -191.8% | -242.5% |
| (Balance Sheet) | |||||||||
| Cash & Short-Term Investments | 1,245 | 1,342 | 1,326 | 1,325 | 1,104 | 1,241 | 2,063 | 1,819 | 1,475 |
| Total assets | 1,686 | 1,753 | 1,751 | 1,754 | 1,557 | 1,694 | 2,469 | 2,205 | 1,963 |
| Total Debt | 298 | 316 | 291 | 314 | 292 | 303 | 282 | 282 | 261 |
| Net Debt | -947 | -1,026 | -1,035 | -1,012 | -812 | -938 | -1,782 | -1,537 | -1,214 |
| Total liabilities | 541 | 542 | 594 | 506 | 487 | 478 | 549 | 443 | 443 |
| Total Shareholders’ Equity | 1,145 | 1,211 | 1,158 | 1,248 | 1,071 | 1,216 | 1,920 | 1,761 | 1,519 |
| (Profitability %) | |||||||||
| ROA | -62.98 | -59.13 | -61.51 | -67.53 | -69.09 | -70.61 | -48.37 | -49.66 | -56.65 |
| ROE | -86.66 | -79.25 | -82.76 | -92.28 | -101.15 | -100.30 | -66.33 | -65.33 | -77.00 |
| (Per-share) Unit: JPY | |||||||||
| EPS | -9.0 | -5.2 | -5.8 | -5.6 | -4.6 | -6.1 | -1.7 | -3.9 | -4.0 |
| BPS | 23.6 | 23.9 | 22.0 | 22.4 | 19.0 | 19.9 | 28.7 | 26.0 | 22.3 |
| Dividend per Share | 0.00 | 0.00 | 0.00 | 0.00 | 0.00 | 0.00 | 0.00 | 0.00 | 0.00 |
| Shares Outstanding(million shares) | 48.50 | 50.01 | 52.19 | 55.40 | 56.39 | 61.24 | 66.97 | 67.77 | 68.05 |
Source: Omega Investment from company materials
Financial data (full-year basis)
| Unit: million yen | 2015/12 | 2016/12 | 2017/12 | 2018/12 | 2019/12 | 2020/12 | 2021/12 | 2022/12 | 2023/12 | 2024/12 |
| (Income Statement) | ||||||||||
| Sales | 280 | 252 | 260 | 213 | 448 | 481 | 713 | 631 | 682 | 781 |
| Year-on-year | -24.4% | -10.0% | 3.0% | -18.1% | 110.3% | 7.4% | 48.3% | -11.5% | 8.2% | 14.4% |
| Cost of Goods Sold | 225 | 228 | 94 | 107 | 167 | 238 | 292 | 283 | 285 | 348 |
| Gross Income | 55 | 25 | 166 | 106 | 281 | 243 | 421 | 348 | 398 | 433 |
| Gross Income Margin | 19.8% | 9.7% | 64.0% | 49.6% | 62.7% | 50.5% | 59.0% | 55.1% | 58.3% | 55.4% |
| SG&A Expense | 1,325 | 1,067 | 1,054 | 1,645 | 1,683 | 1,526 | 1,755 | 1,606 | 1,603 | 1,464 |
| EBIT (Operating Income) | -1,270 | -1,042 | -888 | -1,539 | -1,402 | -1,284 | -1,334 | -1,259 | -1,205 | -1,031 |
| Year-on-year | 10.0% | -17.9% | -14.8% | 73.4% | -8.9% | -8.4% | 3.9% | -5.7% | -4.2% | -14.5% |
| Operating Income Margin | -453.4% | -413.3% | -341.6% | -723.1% | -313.2% | -266.9% | -187.2% | -199.5% | -176.6% | -132.0% |
| EBITDA | -1,168 | -929 | -877 | -1,532 | -1,397 | -1,280 | -1,331 | -1,257 | -1,204 | -1,030 |
| Pretax Income | -1,281 | -1,501 | -880 | -1,531 | -1,401 | -1,291 | -1,466 | -1,238 | -1,215 | -1,018 |
| Consolidated Net Income | -1,283 | -1,491 | -883 | -1,534 | -1,404 | -1,294 | -1,480 | -1,243 | -1,220 | -1,021 |
| Minority Interest | 0 | 0 | 0 | 0 | 0 | 0 | 0 | 0 | 0 | 0 |
| Net Income ATOP | -1,283 | -1,491 | -883 | -1,534 | -1,404 | -1,294 | -1,480 | -1,243 | -1,220 | -1,021 |
| Year-on-year | 11.5% | 16.3% | -40.8% | 73.8% | -8.5% | -7.8% | 14.4% | -16.0% | -1.8% | -16.3% |
| Net Income Margin | -457.9% | -591.2% | -339.6% | -720.5% | -313.6% | -269.1% | -207.6% | -197.0% | -178.8% | -130.7% |
| (Balance Sheet) | ||||||||||
| Cash & Short-Term Investments | 4,100 | 4,553 | 4,027 | 2,329 | 2,106 | 2,686 | 1,791 | 1,727 | 1,326 | 2,063 |
| Total assets | 4,919 | 4,789 | 4,419 | 2,831 | 2,808 | 3,495 | 2,339 | 2,215 | 1,751 | 2,469 |
| Total Debt | 100 | 54 | 4 | 0 | 0 | 180 | 183 | 184 | 291 | 282 |
| Net Debt | -4,000 | -4,499 | -4,023 | -2,329 | -2,106 | -2,506 | -1,608 | -1,543 | -1,035 | -1,782 |
| Total liabilities | 355 | 224 | 202 | 154 | 187 | 385 | 446 | 425 | 594 | 549 |
| Total Shareholders’ Equity | 4,564 | 4,565 | 4,218 | 2,677 | 2,622 | 3,110 | 1,893 | 1,791 | 1,158 | 1,920 |
| (Cash Flow) | ||||||||||
| Net Operating Cash Flow | -1,245 | -970 | -867 | -1,689 | -1,537 | -1,360 | -1,131 | -1,191 | -1,069 | -1,001 |
| Capital Expenditure | 168 | 11 | 5 | 0 | 0 | 0 | 0 | 0 | 0 | 0 |
| Net Investing Cash Flow | -1,780 | 1,989 | -137 | 0 | -26 | -4 | -35 | 0 | 0 | 0 |
| Net Financing Cash Flow | 124 | 1,434 | 479 | -10 | 1,341 | 1,944 | 271 | 1,127 | 667 | 1,738 |
| (Profitability %) | ||||||||||
| ROA | -22.95 | -30.72 | -19.17 | -42.30 | -49.79 | -41.06 | -50.73 | -54.57 | -61.51 | -48.37 |
| ROE | -24.69 | -32.67 | -20.10 | -44.49 | -52.99 | -45.15 | -59.16 | -67.48 | -82.76 | -66.33 |
| (Per-share) Unit: JPY | ||||||||||
| EPS | -58.3 | -65.9 | -33.5 | -57.3 | -44.6 | -36.1 | -36.7 | -28.3 | -24.6 | -17.5 |
| BPS | 207.0 | 179.3 | 157.5 | 99.9 | 78.8 | 78.7 | 46.4 | 37.0 | 22.0 | 28.7 |
| Dividend per Share | 0.00 | 0.00 | 0.00 | 0.00 | 0.00 | 0.00 | 0.00 | 0.00 | 0.00 | 0.00 |
| Shares Outstanding (million shares) | 22.05 | 25.31 | 26.78 | 26.78 | 33.28 | 39.51 | 40.31 | 48.42 | 52.19 | 66.97 |
Source: Omega Investment from company materials