2026-06-09
Home
Japanese

Omega Investment Co., Ltd.
CNS (Investment report – Basic)
| Share price (10/1) | ¥1,586 | Dividend Yield (26/5 CE) | 3.2 % |
| 52weeks high/low | ¥1,294/1,920 | ROE(25/5) | 11.2 % |
| Avg Vol (3 month) | 3.89 thou shrs | Operating margin (TTM) | 7.9 % |
| Market Cap | ¥4.61 bn | Beta (5Y Monthly) | 0.50 |
| Enterprise Value | ¥0.97 bn | Shares Outstanding | 2.906 mn shrs |
| PER (26/5 CE) | 10.8 X | Listed market | TSE Growth |
| PBR (25/5 act) | 1.2 X |
| Click here for the PDF version of this page |
| PDF version |
Cash generation ability and the value of the core business that the market is overlooking.
An investment opportunity created by the gap between business value and share price.
Investment conclusion
EV/EBITDA 1.4x, net cash ratio 82%. A good opportunity to allocate funds to a business with free cash flow generation ability that is markedly undervalued
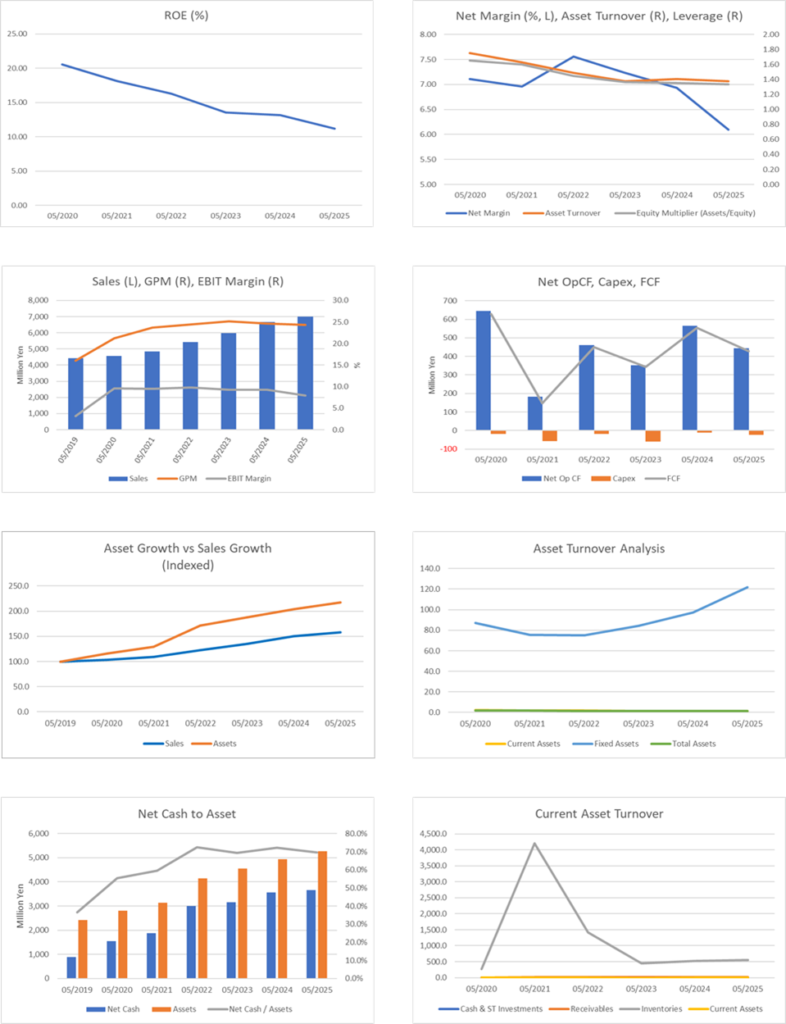
CNS Co., Ltd. (“CNS”) is an IT services company characterized by the sustained ability to generate free cash flow and by overwhelming financial soundness supported by it. The company has been steadily generating free cash flow of 400–500 million yen per year. As of the end of FY2025/5, net cash stood at 3.66 billion yen, reaching a level that accounts for about 70% of total assets and as much as 82% of market capitalization. Enterprise value (EV), which is the de facto corporate value after deducting net cash, is only 900 million yen. The shares are trading at a markedly undervalued level, with an EV/EBITDA of just over 1.4x. Furthermore, the PER forecast adjusted for net cash is 8x, which is clearly undervalued given the business’s capital efficiency and growth potential.
One factor behind this valuation distortion being left uncorrected is the recent tendency toward a slowdown in earnings growth. In FY2025/5, while net sales reached a record high of 7.00 billion yen, up +5.2% YoY, operating profit came in at 555 million yen, down by 10.4% YoY, and weakness on the profit side became evident. In addition to an increase in SG&A, rises in personnel expenses and outsourcing costs weighed on the cost structure, resulting in a decline in the operating profit margin from 9.3% in the previous year to 7.9%. As a result, EPS narrowed from 158.75 yen to 147.06 yen; ROE was 11.2% and ROIC was also 11.2%, which, while maintaining certain levels, continued a declining trend compared to the past. In addition, the spread between ROIC and WACC is on a narrowing trend, and signs of a slowdown are also seen in the pace of economic value creation.
Under these circumstances, what the market expects from the company is a shift away from an asset composition biased toward cash and deposits, and the execution of capital policies and growth strategies that utilize net cash. In fact, in its medium-term management plan covering FY2025/5–FY2027/5, the company set “promotion of empowerment and fostering of innovation” as its basic policy and made clear its stance of working on the sophistication of the business structure and improvement of profitability. At the core of the strategy is the expansion of business development for the original “U-Way” series in the cloud, data, and AI fields. The company aims to shift from the conventional contract development model by focusing on high-value-added areas, such as ServiceNow and SAS Viya. In addition, initiatives that recognize a qualitative shift in the earnings structure can be observed, including the development of new solutions for local governments, the creation of businesses that address social issues in collaboration with local governments, and the deepening of higher-unit-price proposals to existing customers.
Meanwhile, regarding capital policy, although the continuation of the progressive dividend policy is stated, the policy on actively utilizing net cash through share buybacks and M&A is not clearly indicated. In FY2025/5, the company added a commemorative dividend of 26 yen per share to mark the 40th anniversary of its founding. However, the FY2026/5 dividend forecast, excluding the commemorative dividend, is 50 yen per share and a payout ratio of 34.0%, remaining at a relatively conservative level of shareholder returns. From the share valuation and payout ratio, it is inferred that the current share price discounts an EPS growth rate of about 8% per annum. In contrast, the actual EPS CAGR over the past five years is only 5%, suggesting somewhat optimistic expectations.
To achieve a rerating of the share price, it is essential that management reliably executes the growth strategies outlined in the medium-term plan and delivers results that exceed the market’s expectations. In addition, a clear intention and actions to use ample net cash for measures to enhance shareholder value, such as growth investments, M&A, or agile share buybacks, will become the trigger for regaining market confidence and revising the evaluation.
In conclusion, the company’s shares can be evaluated as a clear deep-value stock, as its corporate value, after deducting net cash, is markedly undervalued. If the future growth scenario is reflected in actual business performance and produces results that exceed market expectations, the room for a correction in the share price level is substantial. Therefore, this name is worthy of consideration by institutional investors as a potential bargain, aiming for convergence between corporate value and equity value from a medium- to long-term perspective.
1. Company overview
An independent IT services company founded on technology and trust, with a 40-year history.
CNS is a systems engineering services company established in July 1985 in Minato-ku, Tokyo. It was listed on the Tokyo Stock Exchange Mothers Market (now the Growth Market) in August 2021. It is currently headquartered in Ebisu-minami, Shibuya-ku, Tokyo, and, on a consolidated basis, has 265 employees (non-consolidated 221) as of the end of FY2025/5.
Its main business activities consist of five areas: the Digital Innovation Promotion Business, the Big Data Analysis Business, the System Infrastructure Business, the Business System Integration Business, and the Consulting Business. All of these are included in the single segment “Systems Engineering Services Business,” and the company has established a structure to provide end-to-end services from technical support to development, operation, and maintenance. As a consolidated subsidiary, it holds 100% of CNS Hokkaido Co., Ltd., which is based in Hokkaido.
Over many years, the company has built a customer base centered on major system integrators (SIs), financial institutions, and public institutions, with key customers including NTT DATA, the NTT DATA Group, the Nomura Research Institute Group, and the NS Solutions Group.
In recent years, in light of the trend of promoting digital innovation, the company began offering ServiceNow ITSM implementation support services in 2025 and has indicated a strategy that aims to expand its share in the cloud operations domain going forward. In addition, under the “U-WAY” brand, the company is also focusing on the visualization of engineers’ career support and in-house training, aiming to enhance human capital and improve medium- to long-term profitability through greater engagement.
Stated capital is 478.77 million yen, and the number of shares outstanding is 2,906,000, placing the company in the mid-cap range among Growth market listings. From the perspective of human capital, the average age is 32.7 years, the average years of service are 6.0 years, and the average annual salary is 6.839 million yen (as of FY2025/5). The workforce composition is relatively young, and maintaining retention and developing highly skilled IT personnel are cited as management issues.
The corporate philosophy states: “In an increasingly internationalized society, we respect the individuality of each employee, act with integrity, and contribute to the development of client companies and society through the advanced use of information technology,” and in recent years, under the mission “Creating new value that advances society with the power to care for people,” the company has been focusing on business development starting from social issues and on expanding region-contribution-type solutions. For future growth, the company clearly places at the core of its management strategy the breakaway from a mere SI business and the shift to product-type and asset-type businesses, and building that structure is positioned as a central element in the new medium-term management plan (FY2025–FY2027).
2. Characteristics and content of the business
From contract-based to solution-based. Deepening of five business domains and a differentiation strategy through the company’s own brand
CNS is a systems engineering services company that provides comprehensive services related to the development and operation of information systems. Its business content is broadly divided into five fields: (1) the Digital Innovation Promotion Business; (2) the Big Data Analysis Business; (3) the System Infrastructure Business; (4) the Business System Integration Business; and (5) the Consulting Business.
The Digital Innovation Promotion Business is one of the company’s most focused areas, supporting the sophistication and efficiency of customers’ business processes through technical support centered on cloud, AI, and business automation. The company has strengths, particularly in supporting the digital transformation of operations using ServiceNow products and in consulting on database performance improvement. Multiple collaborative projects with NTT DATA are also in progress. In FY2025/5, net sales in this business exceeded 2.2 billion yen (+21% YoY), and it became the largest segment with a 31.4% share of sales by business.
The Big Data Analysis Business conducts data management and support for building analytical models centered on a partnership with SAS Institute Japan. In recent years, the company has been developing the original service “U-Way Migration to SAS Viya,” specializing in support for implementing the cloud-based AI/analytics platform “SAS Viya,” thereby contributing to data-driven management support. Major customers include large companies in the telecommunications, finance, and retail sectors. Net sales in this business were 1.33 billion yen (+16.7% YoY), and the gross profit margin was 21.1%, which declined somewhat, but the size of projects is increasing.
The System Infrastructure Business is responsible for designing, constructing, and providing operational support for cloud infrastructure, with a proven track record of supporting AWS and Oracle Cloud Infrastructure (OCI). In recent years, the “U-Way” series of offerings has been introduced, targeting Oracle’s virtual infrastructure and VMware solutions, and the company is attempting to differentiate itself through its own products. In FY2025/5, net sales in this business were 1.81 billion yen (+1.8% YoY), and there remained some issues on the sales side in terms of expanding new orders.
The Business System Integration Business is the company’s traditional core business, with strengths particularly in credit risk management, financial regulation compliance, and corporate business systems within the financial industry. The company consistently handles everything, from application design tailored to customers’ individual operations to post-implementation maintenance and operation, and maintains a high repeat rate. Net sales were 1.54 billion yen (+1.2% YoY), and the gross profit margin was 26.0%, securing the highest profitability among all businesses.
The Consulting Business is a new field that began full-scale development in FY2024/5 and primarily provides upstream support, including DX concept formulation, IT literacy education, development of digital human resources, and technical advisory services. In FY2025/5, net sales were 124 million yen, and the business scale remains limited; however, medium-term growth is expected against a backdrop of strengthened sales activities, including proposals to the public sector. The gross profit margin is 24.4%, securing a certain level of profitability. The company positions this business as a company-wide, cross-functional strategic initiative, advancing the concentration of resources and accumulation of know-how.
A common direction observed across the five businesses undertaken by the company is the shift from the conventional contract development model, which relies on technical personnel, to a solutions-based business with high stock characteristics and reproducibility. A symbolic example of this is the development of the “U-Way” brand, which is being accompanied by a structure that enables the development and provision of solutions that leverage the company’s expertise through collaboration with external platforms, including ServiceNow, Oracle Cloud, and SAS. These initiatives are positioned as a medium-term reform of the earnings structure that will simultaneously improve profit margins and capital efficiency, and they are elements that investors should also closely monitor.
The company’s engineering services also boast a strong ability to handle everything end-to-end, from requirements definition to design and development, implementation, and operation. They are equipped with proposal capabilities provided by engineers who possess a deep understanding of business processes. In recent years, the launch of proposal organizations across businesses has progressed, expanding opportunities for winning higher-unit-price projects with existing customers and for proposals to new customer segments.
As described above, CNS is in the process of shifting its business structure from a contract-based to a solution-based and product-based model, with each business supporting the execution of the growth strategy while building complementary relationships. Together with a structurally favorable market environment, the focus of corporate evaluation will be on how sources of competitiveness are linked to the creation of economic value going forward.
3. Major shareholders and investment trends
A stable shareholder base in which a founder-controlled structure coexists with an employee shareholding system
As of July 2025, the major shareholder structure of CNS is characterized by a high shareholding ratio held by management, including the founder, and the presence of stable shareholders, such as the Employee Stock Ownership Plan. According to the latest information, Hiromi Toyama (Chairman & Representative Director), the largest shareholder, holds 1,005 thousand shares, or 34.58% of the total, and continues to have a controlling influence on management. In addition, Masahide Sekine, the current President, holds 178 thousand shares (6.13%), and the combined holding ratio by management exceeds 40%.
Other officers and related parties include Haruhiko Onoma (3.87%), Keita Kusumi (3.85%), Tadashi Toda (2.06%), Masayuki Taneda (1.86%), Hidehiko Miyagawa (1.51%), Hideaki Fukuda (0.74%), and Masatoshi Inoko (0.29%). And broad shareholdings by officers and employees are confirmed. External shareholders can regard these holdings as a certain reassurance from the dual perspectives of maintaining management governance and designing incentives linked to business performance.
Regarding the employee shareholding system, the “CNS Employee Stock Ownership Plan” holds 135 thousand shares (4.64%), contributing to improved internal engagement and long-term capital stability. The presence of external institutional investors is minimal; for example, among identifiable institutional investors, Sumitomo Mitsui DS Asset Management holds only 1 thousand shares (0.04%), and its impact on the overall portfolio is viewed as minor.
As an example of external capital ties as an operating company, COOP Sapporo, one of the company’s key customers, holds 100 thousand shares (3.44%), and it is noteworthy that there is some overlap between business relationships and capital relationships. The NTT DATA Group also holds the same 3.44%, suggesting the maintenance and strengthening of a collaborative structure through capital relationships.
Examining the shareholder structure as a whole, the ratio of stable shareholders, comprising management and employees, is extremely high, and the likelihood of activist-type intervention by external shareholders is limited. As of the cumulative total in 2025/7, the shareholding ratio of insider shareholders, including officers and employees, exceeds at least 66%, and an environment is maintained in which capital policy and growth strategy formulation and execution are less susceptible to short-term shareholder pressure.
Such a shareholder structure provides a certain degree of freedom to implement measures that enhance corporate value from a medium- to long-term perspective, while also acknowledging the risk that excessive capital conservatism may lead to rigidity in evaluation. In particular, under the current asset composition, in which net cash accounts for most of the market capitalization, this clearly indicates that capital policies conscious of improving capital efficiency will become all the more critical going forward from the standpoint of accountability to external shareholders.
4. Medium-term management plan
An evolutionary medium-term plan consisting of five strategies, from “strengthening the business foundation” to “strengthening proposal capabilities”
CNS has formulated a medium-term management plan covering FY2025/5 to FY2027/5 and is deploying five strategies under the banner of “balancing sustainable growth and profitability.” This plan is positioned as “Stage 2” in the long-term vision leading up to 2030. As quantitative targets, the company plans to achieve net sales of 10.0 billion yen and an operating profit margin of over 10% by FY2027/5 (FY2024/5 results: net sales 6.6 billion yen, operating profit margin 9.3%). Additionally, for Stage 3 (2028–2030), it envisions achieving net sales of 15.0 billion yen and an operating profit margin of 12.0%.
The plan is organized into the following five strategies.
[Strategy 1] Strengthen the business foundation: As a prerequisite for supporting business growth, strengthen the human resources foundation, starting from recruitment, development, and evaluation systems. Promote the acquisition of highly skilled personnel through diverse recruitment channels for new graduates and mid-career hires, and develop training schemes to enable early contribution. Organizational culture reform, focusing on empowerment (expansion of discretion), the promotion of young employees, and fostering a change mindset within the organization, is also emphasized. The expansion of investment in human capital cultivates the soil to create innovation.
[Strategy 2] Business scale expansion through acquisition of new customers: Aim to expand net sales through both deepening of focus customers and acquisition of new customers. Specifically, starting from a consulting-type sales approach, strengthen alliances with external solution vendors, such as ServiceNow and OCI, and reinforce comprehensive proposal capabilities in combination with the company’s own solutions. This will accelerate the shift to a highly profitable and reproducible business model.
[Strategy 3] Market expansion through enhancement of solutions: Expansion of the company’s own solutions centered on the “U-Way” brand is the key to this plan. The company will commercialize its offerings in sequence, starting with a quick-starter package specializing in the ServiceNow ITSM domain and the U-Way series, utilizing Oracle Cloud Infrastructure and SAS Viya. These are standardized, highly reproducible offerings that achieve both standardization and speedy provision. In FY2025/5, U-Way net sales expanded significantly to 560 million yen (from 297 million yen in the previous year), and the company aims to reach 2.0 billion yen by the final year of the plan. It seeks to transition the sales structure to a stock-type model, while simultaneously enhancing capital efficiency (ROIC) and profitability.
[Strategy 4] Business creation starting from social issues: The company positions structural issues in corporate information systems as social issues and, leveraging know-how cultivated in implementation and utilization support for AI and ERP, accelerates the rollout of modernization support and business standardization solutions. By strengthening collaboration with regional financial institutions and local governments, the company aims to develop BtoG projects with high public relevance and to build proposal capabilities that are practical and effective, aligned with social implementation. Through the renewal of aging and person-dependent business processes, it presents a strategic stance that pursues both social responsibility and profitability.
[Strategy 5] Strengthening Proposal Capabilities: This strategy focuses on increasing added value at the sales/pre-sales stages. By delving deeper into customer needs and strengthening consulting functions that are directly linked to problem-solving, the company aims to improve both the probability of winning projects and unit prices. Close collaboration with the technical divisions is emphasized, and proposal activities with an end-to-end perspective through to the execution phase are regarded as necessary.
In this phase, the company is testing its strategic execution capability in balancing growth and profitability. In particular, the expansion of the solutions business centered on the U-Way brand will directly lead to a structural improvement in profit margins and is a priority target for allocating management resources. Points to watch going forward for investors will be: (1) establishment of a double-digit operating profit margin, (2) maintaining ROIC > WACC, and (3) sustaining free cash flow generation ability.
5. Concerning international business
Advocates are “building and expanding a global network.” Indirect rollout in view through strategic partnerships and capability building
CNS has hitherto primarily focused on business development in the domestic market. Still, in the medium-term management plan from FY2025/5 onward, it clearly positions “building and expanding a global network” as one of the priority measures. This measure is not, at present, a problematic rollout, such as opening overseas offices or establishing local subsidiaries, but is interpreted as intending to lay the groundwork for indirect international business development through strategic partnerships with overseas companies and support for implementing solution portfolios that are deployable globally (e.g., Oracle ERP, ServiceNow).
In particular, initiatives such as expanding the Oracle ERP business and strengthening collaboration with new alliance partners will not only support domestic customers’ global responses but also potentially create opportunities for the company to participate in overseas projects utilizing its capabilities in the future. Against this backdrop, although the company has not yet reached the “phase of explicitly declaring expansion of overseas net sales,” it is advancing medium- to long-term expansion of organizational capabilities with a global reach in view.
As of 2025, the only subsidiary is “CNS Hokkaido,” which is based in Hokkaido, and a service delivery structure using offshore development or overseas bases has not been established. However, strengthening global responsiveness in an indirect form is steadily progressing through technical collaboration with foreign-affiliated vendors and the provision of ERP solutions based on multi-region deployment.
If these initiatives yield positive outcomes, it may lead to the establishment of quantitative targets, such as overseas net sales ratios and base development, in the medium-term plan and long-term strategy from 2028 onward. Accordingly, at present, CNS’s international business should be organized as being in a “strategic preparation phase,” and full-scale utilization as a growth driver will depend on future progress.
6. Long-term results
From stable growth to a structural transition phase. A plateau in profit growth and the establishment of FCF generation ability
Looking at the company’s results over the past five years, both net sales and profit have continued to grow consistently. In particular, net sales expanded from about 4.6 billion yen in FY2020/5 to 6.6 billion yen in FY2024/5, with a CAGR of about 9%. This can be described as a stable trend, even compared with the growth rate of the domestic IT services market as a whole. Operating profit also increased by about 1.4x, from 440 million yen in FY2020/5 to 610 million yen in FY2024/5, and the CAGR over the same period was about 9%, with profit expanding at a pace equivalent to net sales.
What is noteworthy is that this profit growth has been achieved through sustainable business operations, centered on internal funds, without relying on excessive leverage. Since its founding, the company has maintained a debt-free management policy, with an equity ratio exceeding 70%. In addition, free cash flow in FY2024/5 was approximately 500 million yen, with a continued surplus resulting from a healthy balance between operating cash flow and investing cash flow. This ability to generate FCF has remained stable over the past five years, and a structure has been established in which internal reserves are accumulated while making growth investments.
Meanwhile, signs of a plateau in growth have appeared in the results for FY2025/5. Net sales recorded a record high of 7.00 billion yen (+5.2% YoY), but operating profit turned to a decrease at 555 million yen (-10.4% YoY). This is primarily attributed to an increase in SG&A, including forward-looking investments in human resources and advertising expenses. At the same time, this can be understood to a certain extent as a stepping stone toward growth; the short-term stagnation of profit could induce market concerns about medium-term profitability.
Looking also at EPS trends, it grew steadily from about 108 yen in FY2020/5 to 158.75 yen in FY2024/5, but decreased to 147.06 yen in FY2025/5. Although this point has a strategic background as a transition period for earnings structure reform, compared with the EPS CAGR of 5% over the past five years, there is a slight gap with the growth expectation of approximately 8% per annum that the current share price is discounting. Therefore, sustained improvement in ROE and ROIC going forward will be a critical perspective from the standpoint of shareholder returns and capital efficiency.
As for dividend results, the dividend was increased to 48 yen in FY2024/5, indicating that a stable dividend policy has been maintained. In addition, in FY2025/5, a total dividend of 75 yen was implemented, including a 26 yen commemorative dividend for the 40th anniversary of the company’s founding, with a payout ratio of 51.0%. It can be said that such a record of returns is made possible only with the backing of profitability and financial stability.
Overall, the company’s long-term results are characterized by stable growth and improvement in profitability. It is currently in a phase of structural transition, as outlined in its medium-term plan. The shift from conventional contract-type IT services to product-type and proposal-type businesses is in progress, and this is a phase in which the transition from the cumulative growth of the past to future discontinuous profit growth is being tested. The effectiveness with which accumulated FCF and net cash can be converted into growth investments will be a key determinant of the future performance trajectory.
7. Results in the most recent financial statements
Net sales reached a new record high, but profit growth slowed; this marks an investment phase as a stepping stone toward future growth.
In the financial results for FY2025/5, CNS recorded net sales of 7.0 billion yen (+5.2% YoY), renewing the record-high level. The growth in net sales was mainly due to the expansion of orders in high-value-added areas such as cloud migration support, ServiceNow implementation support, and big data-related services, and in particular, the Digital Innovation Promotion Business grew significantly at +20.9% YoY. In addition, expansion of business with key customers and an increase in unit prices on existing projects have supported a certain amount of top-line growth.
On the profit side, there was a decrease in profit: operating profit was 555 million yen (-10.4% YoY), ordinary profit was 585 million yen (-10.0% YoY), and profit attributable to owners of parent was 427 million yen (-7.4% YoY), with all key profit indicators falling below the previous year. The operating profit margin was 7.9%, down 1.4 points from 9.3% in the last year, clearly indicating a slowdown in profitability.
This decrease in profit was primarily due to an increase in the cost of sales and an increase in selling, general, and administrative (SG&A) expenses. In particular, forward-looking human resources investments, strengthened recruitment expenses, office relocation-related costs, license fees for cloud infrastructure, and fees to external partners temporarily increased costs and squeezed operating profit. In addition, 437 million yen has been budgeted for relocation costs of the head office, and part of the expenditure is scheduled to be reflected in FY2026/5 and beyond.
In parallel with strengthening the rollout of the product brand “U-Way” series, advertising and publicity activities aimed at enhancing brand penetration and supporting sales have also been intensified. These are positioned as strategic investments toward a shift to a proposal-type/reproducible business in the medium term. However, in the short term, from the current period, some factors squeeze profit due to a cost-first earnings structure.
On the financial side, an extremely sound condition is still being maintained. The equity ratio is 75.3%, and net cash has reached 3.66 billion yen, indicating a high degree of leeway on the balance sheet. ROE is 11.2%, ROA is 9.3%, and ROIC is 11.2%. Even while the level of profit temporarily declined, it is noteworthy that capital efficiency has been maintained at a certain level.
By segment, the Digital Innovation Promotion Business showed notable growth of 2.20 billion yen (comprising 31.4% of the total, +21% YoY), with advanced solution areas such as ServiceNow, OCI, and SAS Viya acting as drivers. The Big Data Analysis Business was 1.33 billion yen (comprising 19.0% of total, +16.7% YoY), and the System Infrastructure Business was 1.81 billion yen (comprising 25.9% of total, +1.8% YoY), both of which were steady. In comparison, the Business System Integration Business was 1.54 billion yen (comprising 22.0% of the total, +1.2% YoY), where some stagnation was observed. The Consulting Business, for which a turnaround is aimed in the current period, posted net sales of 124 million yen, and attention will be on its room for rollout going forward.
EPS decreased YoY to 147.06 yen (previous year 158.75 yen). Still, with the implementation of an annual dividend of 75 yen, including a commemorative dividend (of which 26 yen is the commemorative dividend), the payout ratio rose significantly to 51.0%. In the current period, on a normal dividend basis, excluding the commemorative dividend, a payout ratio of 34.0% and a dividend of 50 yen are being maintained. The continued stable shareholder returns, based on the progressive dividend policy, are also a positive element to be noted.
The results for FY2025/5 confirmed steady growth in net sales, driven by the launch of new services and the deepening of business with existing customers. On the profit side, the color of a forward-looking investment phase toward growth is intense, although short-term profitability temporarily retreated. Management positions this as a “deliberate adjustment of profit,” and whether structural reform of earnings in the medium term will make progress will be a key perspective that will influence future evaluations.
8. Full-year earnings forecast
Assuming a recovery trend in both net sales and profit. A cautious outlook toward achieving the first year of the medium-term plan
The earnings forecast for FY2026/5 at CNS is based on a recovery trend in both net sales and profit, and it is set at a conservative yet realistic level, taking into account both the rebound from the profit decline in FY2025/5 and consistency with the quantitative targets in the medium-term management plan (FY2025–FY2027).
The company announced guidance of net sales of 8.25 billion yen (+17.8% YoY), operating profit of 557 million yen (+0.3% YoY), ordinary profit of 575 million yen (-1.6% YoY), and profit attributable to owners of parent of 427 million yen (+0.0% YoY), and since the stage targets in the medium-term plan for 2025–2027 set “net sales of 10.0 billion yen and operating profit margin of 10% or higher in FY2027/5,” FY2026/5 is expected to be a transitional fiscal year toward this level, with a stepping stone toward recovery in the operating profit margin alongside sustained increases in net sales.
In practice, the main forward investments in FY2026/5 have already been explicitly budgeted and include head office relocation costs (437 million yen), costs for highly professional personnel (180 million yen), Oracle-related costs (34 million yen), and brand advertising costs (11 million yen). These investments are directly connected to strengthening the company’s U-Way brand, enhancing proposal capabilities, and the human resources retention strategy. They are characterized as expenditures aimed at establishing a solid foundation for structural growth.
On dividends, the annual dividend forecast for FY2026/5 is 50 yen per share, and it is expected to return to the normal level, excluding the commemorative dividend. The payout ratio is assumed to be 34.0%, and a stance of stable shareholder returns will be maintained based on a progressive dividend policy. Although it will be a decrease compared with the 75 yen, including the commemorative dividend in FY2025/5, if special factors are excluded, it is appropriate to regard it as a virtual “hold.”
Given the business structure of the company, there is a certain time lag before the results of sales activities are clearly reflected in profit, so going forward the nature as a “fiscal year to verify the results of growth investments” will be strong; the most significant focus will be on whether, alongside an increase in net sales, the operating profit margin will again approach the 10% level.
As described above, the full-year results for FY2026/5 will focus on recovering profitability in the execution phase of the growth strategy and steadily accumulating the top line. It is positioned as a fiscal year to determine how the management team’s strategic decision-making will be reflected in financial figures. To achieve the targets of the medium-term management plan, this phase requires both a turnaround on the profit side and the maintenance of a stable cash flow simultaneously.
9. Growth strategy and risks
Execution of earnings structure reform and investment in human capital. A phase of structural transition that takes on the challenge of balancing “deepening and expansion”
CNS’s growth strategy is outlined in the medium-term management plan (FY2025–FY2027), which commenced in FY2025/5, and the company positions this as “Stage 2” of a three-stage growth program leading up to 2030. At its core is the “advancement of the business structure” that will realize improvement in profit margin and capital efficiency alongside the expansion of net sales.
Specific strategies declared by the company include the following elements.
First, it is characteristic that the company declares “maximization of the power of human resources” and focuses on investment in human capital. During the medium-term plan period, in addition to implementing a base pay raise of 10% or higher, it plans to review skill definitions and evaluation/compensation systems to develop personnel who possess proposal capabilities in addition to technical capabilities. This aims to break away from the conventional model centered on contract development and shift to a high-value-added proposal-type solutions company.
Second, a review of the service delivery structure is progressing. In recent years, under the product brand “U-Way,” the company has developed reproducible implementation support services utilizing IT solutions, including ServiceNow, SAS Viya, and Oracle Cloud Infrastructure (OCI). It explicitly states deployment to a “proposal-type/product-type model” based on provision to multiple customers. The company positions this initiative as an evolution from a man-hour-dependent model to a stock-type high-profit structure.
Third, it emphasizes the strengthening of business development, beginning with addressing social issues. In the medium-term management plan, the company outlines a strategy to enhance proposal capabilities from perspectives such as business reform and optimization of communication processes for companies and government agencies that face challenges in utilizing information, aiming to balance social value and corporate growth. In particular, it presents a stance of aiming for the coexistence of social implementation and expansion of results by providing solutions that utilize IT knowledge and business know-how at sites where mechanisms for information transmission are not functioning sufficiently.
In executing these strategies, multiple forward investments are planned mainly in FY2026/5. In the medium-term plan, the following expenses are explicitly indicated: relocation costs for the materials head office (437 million yen), improvement of treatment for highly skilled personnel (180 million yen), Oracle-related costs (34 million yen), and branding advertising costs (11 million yen). Although these expenditures temporarily squeeze profit, the company positions them as “strategic investments to build future sources of profit.”
Additionally, these growth strategies also entail multiple risks. First, suppose the reproducible services under the “U-Way” brand fail to secure sufficient competitive superiority in the market. In that case, there is a possibility that progress in raising added value will be delayed. Additionally, strengthening a proposal-type sales structure and transitioning to a cross-functional organization are initiatives that require organizational execution capabilities, such as on-site business design and knowledge management. Risks associated with these initiatives include internal friction and delays in establishing practices.
Furthermore, investment in human capital is a source of competitiveness in the medium to long term; however, in the short term, it becomes a factor that pushes up SG&A. If expenditures on recruitment, education, and treatment diverge from net sales growth, a temporary decline in the operating profit margin and ROIC could become unavoidable. As for expansion into the public sector, it also contains uncertainties specific to government, such as bid and budget execution constraints, and it is assumed that it will take a certain amount of time before it contributes stably to profit.
In the current medium-term management plan (FY2025/5–FY2027/5), the company positions the transition to a business model that enhances profitability and reproducibility as an essential management policy, centered on expanding the “U-Way” brand and investing in human capital. This initiative aims to break away from the conventional structure dependent on contract development and to establish a new earnings structure centered on a high-value-added services business.
10. Share price trends and share valuation
An unusual share price formation in which net cash accounts for most of the value. A phase to face the risk of short-term revision to the evaluation
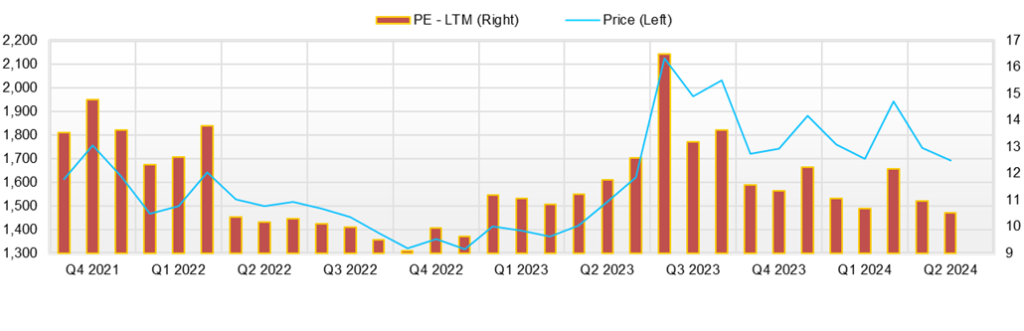
As of the end of 2025/7, CNS’s shares were trading on the TSE Growth Market with a market capitalization of about 4.3 billion yen, an actual PBR of 1.10x, and a forecast PER of 10.14x. Net cash is an extremely ample 3.66 billion yen, which is about 70% of total assets and 82% of market capitalization. On this premise, enterprise value (EV) after deducting net cash is only about 900 million yen, making it clear that business value is markedly undervalued.
EV/EBITDA is estimated at just over 1.4x, a level typically seen in large, listed companies in their mature phase or those that have fallen into structural profit stagnation. PER, too, if adjusted for net cash, comes down to about 8x, giving the shares a strong character as an asset-backed, deep-value stock. Such a valuation can be described as an unusually low evaluation for a company that can generate stable free cash flow (400–500 million yen per year).
Looking at share price trends, from early 2024 to spring, the share price temporarily rose following the announcement of the 40th anniversary commemorative dividend (a special dividend of 26 yen) and the earnings announcement. However, as the FY2025/5 results show a decrease in profit, the upside again becomes substantial. The market is cautious about the slowdown in EPS growth following the commemorative dividend, and a reevaluation of the significant growth potential is on hold.
There is a gap between the future growth rate discounted in the share price and the actual results and outlook. Assuming the current valuation (PER about 10x), the market is estimated to be discounting EPS growth of around 8% p.a., whereas the actual CAGR over the past five years is about 5%, and EPS in FY2025/5 turned to negative growth at -7.4% YoY. Under such circumstances, to maintain or increase the share price from its current level, it is essential to present actual results that match the profit growth outlined in the medium-term plan (an operating profit margin of 10% or higher) and to conduct a re-evaluation.
Short-term risk factors are also clear. First, the fact that the operating profit margin fell to 6.7% in the FY2026/5 results has created a gap with the profitability expected by the market. Management positions forward investments such as head office relocation costs, human resources investments, and advertising and publicity expenses as “stepping stones toward growth.” Still, if results are not visualized and the following financial results are reached, further compression of the evaluation (discounting of the valuation) may occur.
Second, because net cash accounts for most of corporate value, the company’s shares depend greatly on “expectations for capital policy.” Currently, the company declares a progressive dividend policy, but concrete measures to improve capital efficiency, such as the active use of funds for growth investments and share repurchases, have not been put forward. Therefore, there is a possibility that the market may be disappointed by the “rigidity of evaluation,” namely, the risk that net cash remains in internal reserves over the long term.
Third, external environment risks cannot be ignored. The company’s customer composition has a high dependence on financial and public-sector projects via SIers, making it susceptible to the macro environment of overall IT investment and policy trends. If the business cycle in Japan or government spending policy after FY5/2026 diverges from assumptions, delays or compression may occur in new orders and renewal projects, which could affect the bottom line.
The company’s shares have strong downside support from the asset side due to ample net cash, and the current valuation is markedly undervalued. However, this “undervaluation” is the flip side of multiple factors, such as slowed growth, a passive stance on capital utilization, and a temporary deterioration in profitability. To achieve a rerating, it is essential to visualize the results toward meeting the medium-term plan and to take clear actions on capital policy.
In the short term, it is an investment target with a dual aspect of “defensive deep value supported by assets,” and in the medium term, “re-evaluation (rerating) based on growth,” and the direction in which the share price will move depends on “execution” by management.
11. Equity investment conclusion derived from the consideration of results and share price
An asymmetry of evaluation is latent in an FCF-generating company. An investment phase protected by assets, with growth being tested
As of 2025, CNS’s shares show a highly unusual capital structure, with net cash of 3.66 billion yen against a market capitalization of 4.3 billion yen. This means that the business value (EV) is only around 900 million yen, and compared to the company’s ability to steadily generate free cash flow (FCF) of 400–500 million yen per year, a marked valuation discount exists.
Behind such asymmetry are seen low growth expectations and market doubts about capital efficiency. In fact, while results for FY2025/5 achieved a record high in net sales, operating profit, and net profit, both landed below the previous year, and the operating profit margin fell from 9.3% to 7.9%. This was due to strategic forward spending, such as investments in human resources. In the short term, the gap with market expectations is working as a factor suppressing the share price.
On the results side, there has been a record of continuous increases in net sales, profit, and EPS over the past five years. Notably, the ability to generate free cash flow has remained uninterrupted and stable. In this respect, the fundamental underpinning of the company’s corporate value is strong, and even if profit growth were to stall temporarily going forward, the ability to control risk through asset defense could be a significant attraction for institutional investors.
From the perspective of share valuation, PER adjusted for net cash is about 8x and EV/EBITDA is in the 1.4x range, indicating a marked sense of undervaluation compared to other growth-oriented IT companies. This level is considered an inherently unsustainable discount state, and a rerating will likely occur as the market applies a normal risk premium. In particular, if the EPS growth rate exceeds market expectations (around 8% per annum) and the company can achieve the target of an operating profit margin of 10% or higher set in the medium-term plan, correction of the valuation is expected to proceed at an accelerating pace.
Furthermore, an extremely net-cash-heavy financial structure can also become an obstacle in dialogue with investors who seek capital efficiency. Although a progressive dividend policy is currently in effect, unless concrete utilization of funds for growth investments or expansion of shareholder returns, such as the acquisition of treasury stock, is implemented, it could lead to investor evaluations of “insufficient in both growth and returns.”
In conclusion, the company’s shares are at present a rare investment target that combines the two aspects of “extremely high safety while proof of growth is awaited.” In terms of assets, they are at a vigorously defended level and have great appeal as a deep value investment target. Still, realization of a valuation revision will hinge on a clear track record of growth and the evolution of capital policy. For institutional investors, it can be positioned as a medium-term entry point, aiming for returns that accompany the correction of undervalued business value, while also being an investment case that presupposes progress in strategy execution and governance responses.
12. Trends in return on equity (ROE) and the current evaluation
Thick equity capital and a temporary profit slowdown affect ROE. Will recovery in profitability become the starting point for a renewed rise?
In FY2025/5, CNS’s ROE was 11.2% and maintained a favorable level above the median for listed companies as a whole. Still, the trend over the past several years shows a gradual downward trend. Specifically, compared with 15.6% in FY2022/5, 14.7% in FY2023/5, and 13.8% in FY2024/5, that in FY2025/5 is 11.2%, which is somewhat lower than the peak.
This decrease in ROE should not be taken simply as a decline in earning power but should be interpreted calmly in light of the company’s financial structure and growth stage. First, the company maintains a high equity ratio (FY2025/5: 75.3%) and has ample net cash (3.66 billion yen), effectively continuing its policy of maintaining a debt-free management. This capital structure is the flip side of financial safety, and the point that it maintains a double-digit ROE without using leverage can be highly evaluated.
Second, the decline in ROE in the current period is directly affected by the decrease in net profit. Profit attributable to owners of parent in FY2025/5 was 427 million yen, a decrease of 7.4% from the previous year’s 461 million yen, and in the background are items such as ▲0.07 billion yen due to a pay raise and an increase in the number of managers (+16.8% YoY). These are the results of the company accelerating strategic investments in human capital centered on brands such as “U-Way” based on the medium-term management plan (FY2025–FY2027). The temporary retreat in profit level can be positioned as a “stepping stone for future growth.”
Thus, the deceleration in ROE is interpreted as being due not to a structural decline in the profit margin but to an adjustment of profit accompanying a temporary investment phase. The company clearly states a policy to recover the operating profit margin to 10% or higher in the medium term. It shows a growth trajectory targeting net sales of 10.0 billion yen and an operating profit margin of 10% or higher by FY2027/5. If this strategy proceeds smoothly, net profit will also recover, and a return of ROE to the 15% range will become realistic.
The company has already begun a transition in the earnings structure and rollout of reproducible high value-added services, is advancing a shift from the conventional contract-type model to a proposal-type business model with high reproducibility and profit margin, and, in addition, through investment in human capital (implementation of base pay raises and support for skill improvement), a structure is in place in which medium- to long-term improvement in productivity and the operating profit margin is expected.
Whether this scenario of a renewed rise in ROE will materialize depends on whether these strategic investments become visible as earnings, and the precision and speed of execution are essential elements of verification. If the realization of growth is delayed, while capital accumulates, profit will struggle to grow, and there is also a risk of a further decline in ROE.
Overall, the company’s ROE is at a sufficiently healthy level, and the fact that financial risk is minimal provides significant reassurance for investors. There are clear reasons for the temporary factors behind the decline, and the company has already presented an explicit medium-term plan and structural reform to address them. Therefore, when evaluating ROE, attention should be paid not to fluctuations in a single fiscal year, but to the possibility of a renewed rise in ROE in the medium term as a consequence of progress in the growth strategy and improvement in capital efficiency.
13. Analysis of economic value creation based on ROIC and WACC
Value creation continues, but the spread is on a narrowing trend. A phase in which the redeployment of capital is in question
CNS’s representative indicator showing capital efficiency, ROIC, was 11.2% in FY2025/5, maintaining a level clearly above the cost of capital (WACC). While the company’s WACC is not disclosed, given its listing on the Growth Market, debt-free management, and a low-risk financial structure with an equity ratio of approximately 75.3%, it is estimated to be roughly 6–7%, and the spread with ROIC is considered to be about 4–5 points.
From this, the company can currently be clearly positioned as a “company that creates economic value,” and it can be quantitatively confirmed that it satisfies the condition of ROIC > WACC. However, looking at the trend over the past few years, a slight narrowing tendency is recognized in ROIC; for example, ROIC, which was around 16.2% in FY2022/5, declined stepwise to 13.1% in 2024 and 11.2% in FY5/2025. This fact can be interpreted as not meaning that the company’s earning power itself has been lost, but rather that forward investments to execute the growth strategy and a temporary slowdown in profit levels have had an impact.
Particularly in FY2025/5, operating profit decreased by 10.4% YoY, and the operating profit margin declined from 9.3% to 7.9%, so in the calculation of ROIC on a NOPAT (operating profit × (1 − tax rate)) after-tax basis, the numerator softened. Furthermore, free cash flow fell below the previous year’s level due to multiple overlapping strategic costs, including strengthened recruitment costs for advanced IT personnel and cloud license-related expenses, which contributed to the decline in ROIC.
The “reason” for this decline in ROIC is apparent; it stems from an investment phase in which temporary capital expenditures premised on growth overlapped. This corresponds to the process of the strategy in which, in the medium-term management plan, the company aims to establish a highly profitable structure with an operating profit margin of 10% or higher and net sales of 10.0 billion yen in FY2027/5, and thus a temporary retreat in financial efficiency can be said to be consistent with the strategy.
What is essential is that the company has already indicated multiple countermeasures. First, it promotes a shift to a business model with high reproducibility and added value through the horizontal rollout of services centered on U-Way. Second, it advances the elimination of person-dependence and builds a sales structure that enhances proposal capabilities and fosters a cross-functional organization, thereby strengthening execution capability. Third, through a base pay raise (11% in the first year), implemented as part of an investment in human capital, improvements in employee motivation and retention are expected, and groundwork is being laid that contributes to productivity enhancements. If these measures are reflected in earnings indicators, ROIC will again turn upward, and the spread with the cost of capital may widen again.
Additionally, the company maintains a debt-free structure and holds a net cash position of 3.66 billion yen. Furthermore, the fact that “idle surplus capital” not being utilized is primarily included in invested capital also affects the apparent decline in ROIC. Regarding this point, if effective capital utilization progresses through the reallocation of capital, such as through share repurchases or expansion of growth investments, there is significant room for improvement in ROIC.
As described, ROIC still satisfies the criterion for economic value creation (exceeding WACC), and earning power is not being impaired. However, the company is now entering an investment recovery phase, and how the temporary narrowing of the spread can be translated into “visible results” will directly impact investor evaluation going forward. Given that the company is taking specific measures for both components of ROIC—operating profit margin and capital turnover—there is ample room for improvement, and it is at a stage where the certainty of the execution phase is being tested.
14. Corporate value creation ability from the perspective of free cash flow and capital allocation
A conservative stance on capital allocation continues. A gap between strong FCF generation ability and market expectations
CNS has, in recent years, generated free cash flow (FCF) stably and consistently, a core strength that enables it to create corporate value. FCF in FY2025/5 is estimated on a rough basis at about 400–500 million yen, and this level has been maintained over the past five years. This is attributable to the strategy of focusing on highly profitable IT solutions while curbing investment in fixed assets and redirecting capital to human capital and the productization of services.
Such stable FCF generation is also clearly reflected in the company’s assets, with net cash held reaching 3.66 billion yen as of the end of FY2025/5. This accounts for about 70% of total assets and about 82% of market capitalization, indicating extremely high financial flexibility and risk tolerance.
Against such a strong financial structure, there are also issues regarding capital allocation. Specifically, the net cash in question has been accumulated as internal reserves over the long term. Currently, capital utilization with high growth or shareholder-return characteristics, such as the acquisition of treasury stock or M&A, has not been implemented. As a result, investors are evaluating that “the company is not appropriately redistributing or reinvesting the cash that is the source of corporate value creation ability,” which has become a factor in the discounting of the share valuation.
Reasons for this “evaluation gap” include the company’s preference for a conservative financial strategy and a cautious stance on growth investments and capital policies. This is, in part, an expression of a stability orientation in maintaining long-term trust relationships with customers. Given the industry characteristics of a systems integrator, there is a rationale that financial leeway leads to a competitive advantage.
However, the company itself recognizes this issue. In its medium-term management plan, it presents measures to improve profitability, such as “active investment in human capital,” “company-wide shift to proposal-based operations,” and “a shift to high value-added services centered on U-Way.” In fact, in FY2026/5, forward investments totaling more than 600 million yen are planned for head office relocation and recruitment of cloud technology-related personnel, among others, indicating that a move to reinvest part of FCF has begun.
As for shareholder returns, continuation of a progressive dividend policy has resulted in implementation of 75 yen(payout ratio: 51.0%) in 2025 including a commemorative dividend, while maintaining 50 yen per share and a payout ratio of 34.0% on a normal dividend basis; this can be interpreted as aiming for a healthy balance between maintenance of shareholder value and internal reserves, but it is undeniable that room for capital utilization remains.
Thus, the company’s ability to create corporate value is evident in the stability of FCF, and its defense is based on a sound financial foundation. On the other hand, the point that the strategy for utilizing that cash is cautious and passive appears as market dissatisfaction with the company’s growth evaluation and shareholder return policy. It is one cause of the valuation discount.
By making visible the improvement in profitability through forward investments already begun, it will be key to present the results of capital reinvestment to the market and show the “rotation” of corporate value creation ability. In addition, if the next medium-term plan indicates acquisition of treasury stock or introduction of a more agile capital policy, the likelihood of progress in valuation correction (rerating) will increase. Whether management can shift to a phase of “putting ample, stable FCF and abundant cash to work” rather than “letting them sleep” will be the watershed that determines evaluation going forward.
15. Future possibilities of shareholder return measures and evaluation of records
A stable policy centered on progressive dividends. Market expectations and issues concerning the utilization of net cash
CNS clearly states a “progressive dividend policy” as one of the essential management commitments in the medium-term management plan with respect to shareholder returns and adheres to a stance of maintaining or increasing the dividend without cutting it, regardless of fluctuations in profit. Since FY2021/5, dividend results have shown a consistent upward trend, and the stable and highly predictable return policy warrants a specific evaluation.
Looking back at the results from 2021 to 2024, the dividend amount transitioned from 30 yen to 30 yen, then to 45 yen, and finally to 48 yen. Notably, a 15 yen commemorative dividend was added in 2022. In FY2025/5, a commemorative dividend of 26 yen for the 40th anniversary of the company’s founding was added, resulting in an annual dividend of 75 yen. Even on a normal dividend basis, it reached a record-high level of 49 yen. The payout ratio transitioned 22.4% in 2021, 30.9% in 2022, 30.2% in 2023, 30.2% in 2024, and 51.0% in 2025 (including the commemorative dividend), maintaining a stable level around 30%.
From these results, it is evident that the dividend policy is consistent, and the company maintains an open stance with the market. This evaluation suggests that the company has sent a clear message to shareholders regarding returns. For FY2026/5, a dividend of 50 yen per share (payout ratio: 34.0%) is also planned, ensuring continuity of the policy, as the normal dividend level will not be reduced after the commemorative dividend is paid.
On the other hand, among investors, awareness of issues is increasing concerning “the core of the return measures being biased toward dividends” and “the absence of strategic capital policies such as share repurchases that utilize ample net cash.” Net cash at the end of FY2025/5 reached 3.66 billion yen, corresponding to 82% of the market capitalization. However, for this level of cash, neither return measures other than dividends nor proactive capital reallocation has been confirmed.
The reason for this “negative evaluation” is that the company has emphasized financial soundness and opted for strategic retention of internal reserves. In the past, during periods when new business investments and human resource investments were restrained, a conservative capital policy had a certain rationality. However, in the present, when FCF is generated continuously and cash is in excess, the same stance pushes down ROE and ROIC, becoming a factor that distorts share valuation.
As a “means to overcome” this point, the company has begun forward investments in the medium-term management plan in areas such as investment in human capital, head office relocation, and strengthening of IT infrastructure, and the move to direct part of capital to growth investments has already begun. If these investments become evident in terms of improved results and a widening of the profit margin, the “coexistence of growth and returns” will be evaluated, leading to a restoration of investor confidence in the stance on returns.
In addition, although not currently implemented, multiple capital policy options exist, such as enhancing capital efficiency through the acquisition of treasury stock in the future or aligning returns with human capital through the introduction of stock options or RSU (Restricted Stock Unit) systems. Whether these will be introduced is left to future management decisions, but given a management policy that emphasizes dialogue with the market, there remains ample possibility of flexible responses.
Therefore, while the company’s stance on shareholder returns is highly reliable, supported by records of stable dividends, it is also approaching the next stage of rebalancing its abundant cash among shareholders, growth, and employees. For investors, this is a stage at which attention should be paid, while evaluating the continuity of the dividend policy, to the room for rollout of “strategic capital utilization” beyond that, and its linkage with the creation of corporate value.
16. Corporate value evaluation (DCF, PER/PBR analysis)
Marked undervaluation highlighted by net cash. A divergence from industry evaluations and the key to closing that gap
As of July 2025, CNS’s shares were trading at a valuation level with a forecast PER of 10.14x and an actual PBR of 1.10x. Net cash is ample at 3.66 billion yen, equivalent to approximately 82% of the market capitalization of 4.3 billion yen, and the enterprise value (EV), which indicates business value, is at a level of only around 600–800 million yen. On this premise, PER adjusted for net cash is effectively in the 8x range, and EV/EBITDA is just over 1.4x, a significantly undervalued level.
First, regarding PER, the current share price is significantly lower than the market average (Growth Market average: around 30x), suggesting that the evaluation of the share’s growth is limited. However, considering that this undervaluation is based on FCF being stable at a high level of 400–500 million yen per year, it can be interpreted as a clear distortion in evaluation.
The fact that the EPS CAGR over the past five years has been relatively moderate at around 5% and that EPS decreased by 7.4% YoY in FY2025/5 can be understood as the background to the restrained evaluation of growth. This stems from the company being in a forward investment phase for head office relocation and recruitment of personnel, and it is made clear that a temporary retreat in profitability is unavoidable “in a transition phase toward growth.”
To overcome the “low and stable PER,” the company outlines in its medium-term management plan the achievement of an operating profit margin of 10% or higher and a structural shift to a reproducible proposal-type business model. If this is realized, EPS may return to a growth trajectory of 8–10% per annum, and a rerating of the PER can be expected.
Regarding PBR, the level of 1.10x suggests that the market is not thoroughly evaluating the business value supported by net assets. However, since the company is effectively debt-free and has an exceptionally high net cash ratio, it is viewed as structurally accumulating equity, rather than using it for business activities. This point is the main reason why PBR remains at a level slightly above 1x.
On this point as well, the company is beginning to invest in human capital and business. If ROE and ROIC improve as invested capital is effectively utilized, it will lead to an upward revision of PBR. In particular, regarding ROE, by curbing “expansion of the denominator” stemming from the high equity ratio, a renewed rise is at a realistic level. If the current ROE (11.2%) returns to the 15% range through profit growth in line with the medium-term plan, theoretically, PBR has room to rise to around 1.5x–1.7x.
From the perspective of DCF (discounted cash flow) evaluation, given the stable FCF generation ability (400–500 million yen) and the low level of past capital expenditures, the present value of future cash flows is evaluated as relatively high. Even with conservative assumptions (WACC = 7%, FCF growth rate = 2%) in a simplified evaluation, corporate value is around 6.0 billion yen, a level that significantly exceeds the market capitalization of 4.3 billion yen. As a theoretical value, it indicates a significant gap between the DCF-based value evaluation and the market price, suggesting room for correction in the valuation.
However, for a DCF evaluation to be justified, it is a prerequisite that FCF generation can continue going forward. In this regard, since the level of profit in FY2025/5 has temporarily decreased, whether recovery becomes visible going forward will be an essential trigger.
At present, the company’s valuation is structured to emphasize “safety” backed by assets held, while evaluation of profitability and growth remains cautious. However, if the structural shift in earnings and the visualization of investment results proceed, from the perspectives of PER, PBR, and DCF alike, a clear starting point for re-evaluation (rerating) can be formed. The shares can be regarded as an appropriate target for a “medium-term value strategy” that focuses on the gap between theoretical value and actual value, while also ascertaining recovery in capital efficiency and profit growth.
17. Comparative multiple analysis with peers
Marked undervaluation highlighted by net cash. A divergence from industry evaluations and the key to closing that gap
Among the IT services sector listed on the Growth Market, CNS is at a markedly undervalued level. As of the end of 2025/7, its forecast PER was 10.14x, PBR was 1.10x, and EV/EBITDA was estimated at approximately 1.4x, all of which were well below industry averages.
In comparison with its peers, TDC SOFT (4687) develops a stable-type business centered on supporting the building of enterprise IT infrastructure. It exhibits high levels of capital efficiency, with a PBR of 2.93x, a ROE of 17.7%, and an ROA of 13.1%. Cross Cat (2307) has strengths in the financial and public sectors, and a valuation incorporating a confident growth expectation has been formed, with a forecast PER of 13.74x and PBR of 2.62x. Axis Consulting (4012) secures stable profit with a consultant secondment model and is evaluated at EV/EBITDA of 4.3x.
Thus, while CNS’s capital efficiency itself is at a favorable level, with an ROE of 11.2% and an ROIC of 11.2%, its valuation remains remarkably restrained. This can be said to reflect the market’s cautious view of the company’s growth potential and scalability.
As factors behind the valuation gap, the structure that CNS has long relied on — a contract-based model with billing by person-month — can be cited. From the perspective of recurring profitability and service reproducibility, investor preference has tended not to extend to the company, compared with highly evaluated names such as TDC SOFT and Cross Cat. In addition, EPS growth over the past five years has remained at a somewhat moderate CAGR of around 5%, which has also led to a cautious evaluation.
Even so, CNS has indicated a clear policy to address this structural issue in the medium-term management plan, productizing cloud/SaaS implementation support services under the “U-Way” brand as reproducible solutions. Additionally, it is rebuilding the sales structure from person-dependent to proposal-based and pursuing a shift to a stock-type, value-added business model.
On the financial side, the company holds net cash of 3.66 billion yen, and it has a highly conservative financial structure, with approximately 80% of its market capitalization in cash. For this reason, EV is in effect only 600–800 million yen, and there is a high possibility that business value is not being sufficiently reflected in the share price.
Going forward, through the execution of progress on the medium-term plan, the company will aim to visualize profit growth and capital turnover. By advancing FCF generation and capital reallocation through share repurchases, among other measures, there is a likelihood that the multiple gap with peers will be corrected.
The current evaluation gap arises from a discrepancy between the market’s perception and the company’s asset structure, growth strategy, and profitability outlook. Still, structural transformation to overcome that gap has already begun. From a medium- to long-term investment perspective, the shares are worthy of attention as a “name that contains room for correction of undervaluation.”
| Company name | Security code | Expected PER | PBR | ROE | ROIC | EV/EBITDA |
| CNS | 4076 | 10.1x | 1.10x | 11.2% | 11.2% | 1.4x |
| TDC SOFT | 4687 | 14.4x | 2.93x | 17.7% | 15.5% | 8.9x |
| Cross Cat | 2307 | 13.7x | 2.62x | 19.2% | 15.6% | 6.7x |
| Axis | 4012 | 16.9x | 2.24X | 20.3% | 15.5% | 4.3x |
Key stock price data
Key financial data
| Unit: million yen | 2021 | 2022 | 2023 | 2024 | 2025 CE |
| Sales | 5,419 | 5,989 | 6,657 | 7,005 | 8,253 |
| EBIT (Operating Income) | 533 | 559 | 620 | 555 | 557 |
| Pretax Income | 595 | 589 | 636 | 583 | |
| Net Profit Attributable to Owner of Parent | 409 | 433 | 461 | 427 | 427 |
| Cash & Short-Term Investments | 3,010 | 3,163 | 3,574 | 3,667 | |
| Total assets | 4,152 | 4,547 | 4,934 | 5,260 | |
| Total Debt | 6 | 13 | 11 | 8 | |
| Net Debt | -3,004 | -3,150 | -3,563 | -3,659 | |
| Total liabilities | 1,113 | 1,206 | 1,262 | 1,300 | |
| Total Shareholders’ Equity | 3,039 | 3,341 | 3,672 | 3,959 | |
| Net Operating Cash Flow | 461 | 353 | 565 | 444 | |
| Capital Expenditure | 19 | 59 | 11 | 24 | |
| Net Investing Cash Flow | -23 | -126 | -81 | -269 | |
| Net Financing Cash Flow | 634 | -133 | -134 | -142 | |
| Free Cash Flow | 450 | 344 | 554 | 429 | |
| ROA (%) | 11.23 | 9.96 | 9.73 | 8.38 | |
| ROE (%) | 16.27 | 13.58 | 13.16 | 11.20 | |
| EPS (Yen) | 145.5 | 149.0 | 158.8 | 147.1 | 147.1 |
| BPS (Yen) | 1,045.7 | 1,149.7 | 1,263.5 | 1,362.5 | |
| Dividend per Share (Yen) | 45.00 | 45.00 | 48.00 | 75.00 | 50.00 |
| Shares Outstanding (Million shares) | 2.91 | 2.91 | 2.91 | 2.91 |
Source: Omega Investment from company data, rounded to the nearest whole number.
Share price
Financial data (quarterly basis)
| Unit: million yen | 2023/5 | 2024/5 | 2025/5 | ||||||
| 4Q | 1Q | 2Q | 3Q | 4Q | 1Q | 2Q | 3Q | 4Q | |
| (Income Statement) | |||||||||
| Sales | 1,621 | 1,646 | 1,651 | 1,683 | 1,677 | 1,645 | 1,720 | 1,823 | 1,818 |
| Year-on-year | 18.9% | 17.5% | 14.3% | 10.5% | 3.5% | -0.1% | 4.2% | 8.3% | 8.4% |
| Cost of Goods Sold (COGS) | 1,219 | 1,242 | 1,236 | 1,262 | 1,278 | 1,266 | 1,294 | 1,368 | 1,370 |
| Gross Income | 402 | 404 | 415 | 421 | 399 | 378 | 425 | 455 | 448 |
| Gross Income Margin | 24.8% | 24.5% | 25.1% | 25.0% | 23.8% | 23.0% | 24.7% | 24.9% | 24.7% |
| SG&A Expense | 287 | 263 | 233 | 232 | 292 | 298 | 279 | 260 | 314 |
| EBIT (Operating Income) | 116 | 141 | 182 | 189 | 108 | 80 | 146 | 195 | 134 |
| Year-on-year | 54.8% | 33.7% | 11.5% | 8.2% | -6.8% | -43.6% | -19.5% | 3.0% | 24.9% |
| Operating Income Margin | 7.1% | 8.6% | 11.0% | 11.2% | 6.4% | 4.8% | 8.5% | 10.7% | 7.4% |
| EBITDA | 124 | 149 | 190 | 198 | 117 | 88 | 155 | 209 | 150 |
| Pretax Income | 119 | 131 | 193 | 190 | 123 | 81 | 160 | 202 | 140 |
| Consolidated Net Income | 117 | 89 | 131 | 130 | 111 | 55 | 107 | 137 | 128 |
| Net Income ATOP | 117 | 89 | 131 | 130 | 111 | 55 | 107 | 137 | 128 |
| Year-on-year | 100.3% | 18.0% | 14.5% | 3.7% | -5.7% | -38.4% | -18.2% | 5.5% | 15.3% |
| Net Income Margin | 7.2% | 5.4% | 7.9% | 7.7% | 6.6% | 3.3% | 6.2% | 7.5% | 7.0% |
| (Balance Sheet) | |||||||||
| Cash & Short-Term Investments | 3,163 | 3,047 | 3,244 | 3,325 | 3,574 | 3,372 | 3,382 | 3,355 | 3,667 |
| Total assets | 4,547 | 4,414 | 4,622 | 4,665 | 4,934 | 4,732 | 5,005 | 4,946 | 5,260 |
| Total Debt | 13 | 13 | 12 | 11 | 11 | 10 | 9 | 9 | 8 |
| Net Debt | -3,150 | -3,035 | -3,232 | -3,314 | -3,563 | -3,362 | -3,372 | -3,346 | -3,659 |
| Total liabilities | 1,206 | 1,115 | 1,191 | 1,104 | 1,262 | 1,145 | 1,311 | 1,114 | 1,300 |
| Total Shareholders’ Equity | 3,341 | 3,300 | 3,431 | 3,561 | 3,672 | 3,587 | 3,694 | 3,832 | 3,959 |
| (Profitability %) | |||||||||
| ROA | 9.96 | 10.69 | 10.53 | 10.51 | 9.73 | 9.34 | 8.38 | 8.54 | 8.38 |
| ROE | 13.58 | 14.22 | 14.19 | 13.80 | 13.16 | 12.40 | 11.32 | 11.10 | 11.20 |
| (Per-share) Unit: JPY | |||||||||
| EPS | 40.4 | 30.7 | 45.1 | 44.8 | 38.1 | 18.9 | 36.9 | 47.3 | 44.0 |
| BPS | 1,149.7 | 1,135.5 | 1,180.5 | 1,225.4 | 1,263.5 | 1,234.4 | 1,271.3 | 1,318.6 | 1,362.5 |
| Dividend per Share | 45.00 | 0.00 | 0.00 | 0.00 | 48.00 | 0.00 | 0.00 | 0.00 | 75.00 |
| Shares Outstanding (million shares) | 2.91 | 2.91 | 2.91 | 2.91 | 2.91 | 2.91 | 2.91 | 2.91 | 2.91 |
Source: Omega Investment from company materials
Financial data (full-year basis)
| Unit: million yen | 2021 | 2022 | 2023 | 2024 |
| (Income Statement) | ||||
| Sales | 5,419 | 5,989 | 6,657 | 7,005 |
| Year-on-year | 11.9% | 10.5% | 11.1% | 5.2% |
| Cost of Goods Sold | 4,097 | 4,483 | 5,018 | 5,298 |
| Gross Income | 1,322 | 1,506 | 1,639 | 1,707 |
| Gross Income Margin | 24.4% | 25.1% | 24.6% | 24.4% |
| SG&A Expense | 789 | 947 | 1,019 | 1,151 |
| EBIT (Operating Income) | 533 | 559 | 620 | 555 |
| Year-on-year | 16.4% | 4.8% | 10.9% | -10.4% |
| Operating Income Margin | 9.8% | 9.3% | 9.3% | 7.9% |
| EBITDA | 559 | 589 | 654 | 601 |
| Pretax Income | 595 | 589 | 636 | 583 |
| Consolidated Net Income | 409 | 433 | 461 | 427 |
| Minority Interest | 0 | 0 | 0 | 0 |
| Net Income ATOP | 409 | 433 | 461 | 427 |
| Year-on-year | 21.6% | 5.8% | 6.5% | -7.4% |
| Net Income Margin | 7.6% | 7.2% | 6.9% | 6.1% |
| (Balance Sheet) | ||||
| Cash & Short-Term Investments | 3,010 | 3,163 | 3,574 | 3,667 |
| Total assets | 4,152 | 4,547 | 4,934 | 5,260 |
| Total Debt | 6 | 13 | 11 | 8 |
| Net Debt | -3,004 | -3,150 | -3,563 | -3,659 |
| Total liabilities | 1,113 | 1,206 | 1,262 | 1,300 |
| Total Shareholders’ Equity | 3,039 | 3,341 | 3,672 | 3,959 |
| (Cash Flow) | ||||
| Net Operating Cash Flow | 461 | 353 | 565 | 444 |
| Capital Expenditure | 19 | 59 | 11 | 24 |
| Net Investing Cash Flow | -23 | -126 | -81 | -269 |
| Net Financing Cash Flow | 634 | -133 | -134 | -142 |
| Free Cash Flow | 450 | 344 | 554 | 429 |
| (Profitability ) | ||||
| ROA (%) | 11.23 | 9.96 | 9.73 | 8.38 |
| ROE (%) | 16.27 | 13.58 | 13.16 | 11.20 |
| Net Margin (%) | 7.56 | 7.23 | 6.93 | 6.10 |
| Asset Turn | 1.49 | 1.38 | 1.40 | 1.37 |
| Assets/Equity | 1.45 | 1.36 | 1.35 | 1.34 |
| (Per-share) Unit: JPY | ||||
| EPS | 145.5 | 149.0 | 158.8 | 147.1 |
| BPS | 1,045.7 | 1,149.7 | 1,263.5 | 1,362.5 |
| Dividend per Share | 45.00 | 45.00 | 48.00 | 75.00 |
| Shares Outstanding (million shares) | 2.91 | 2.91 | 2.91 | 2.91 |
Source: Omega Investment from company materials