2026-06-19
Home
Japanese

Omega Investment Co., Ltd.
CNS (Investment report – 1Q update)
| Share price (10/27) | ¥1,696 | Dividend Yield (26/5 CE) | 3.0 % |
| 52weeks high/low | ¥1,294/1,920 | ROE(25/5) | 11.2 % |
| Avg Vol (3 month) | 3.78 thou shrs | Operating margin (TTM) | 7.9 % |
| Market Cap | ¥4.93 bn | Beta (5Y Monthly) | 0.50 |
| Enterprise Value | ¥0.87 bn | Shares Outstanding | 2.906 mn shrs |
| PER (26/5 CE) | 11.5 X | Listed market | TSE Growth |
| PBR (25/5 act) | 1.3 X |
| Click here for the PDF version of this page |
| PDF version |
OCI, ServiceNow, and generative AI will drive earnings over the medium to long term. The shares are sufficiently undervalued; a gradual increase in holdings is appropriate.
Investment conclusion
The shares are clearly undervalued. With the substantial progress in the first quarter, earnings momentum has improved. On the other hand, we continue to expect clarification of capital allocation.
For the shares of CNS Co., Ltd. (hereinafter “CNS”), an “accumulation on dips leaning toward neutral” is an appropriate investment stance. In the first quarter of FY2026/5, net sales were 1.874 billion yen (+14.0% YoY), operating profit was 182 million yen (+128.7% YoY; operating margin 9.7%), showing substantial progress that confirmed a turnaround in profitability. Meanwhile, valuation remains low at an actual PBR of 1.21x and a forecast PER of 11.01x. However, financial capacity is ample, with net cash of 3.472 billion yen; there has been little new information on capital allocation policies such as enhanced shareholder returns or share buybacks. At present, there are limited immediate factors to trigger a full-fledged reassessment of the share price.
Nonetheless, there are three positives. First, the demand environment and the company’s edge (competitive advantage) are consistent. The buildup in U-Way and ServiceNow centered on Oracle Cloud Infrastructure (OCI) and the increase in revenue and profit in the first quarter are linked, suggesting an improvement in the order mix that structurally makes it easier to raise the gross margin. Furthermore, CNS became the first in Japan to conclude Oracle’s Enhanced OPN Level 2, and the higher probability of generating deals using joint GTM and human resource development is a tailwind over the medium term. Second, CNS has laid the groundwork for capturing potential demand by advocating a differentiated theme of “local utilization” of generative AI. Third, although there has been no change to the full-year plan (net sales 8.253 billion yen, operating profit 557 million yen), the improved profit margin in the first quarter has raised the probability of achievement.
The sources of the company’s strength are (i) technological assets spanning OCI/ERP, ServiceNow, and data/AI; (ii) an agile workforce composed mainly of young employees; (iii) high project diversity despite a single segment; and (iv) a solid financial structure. Combined with the aforementioned partner strategy (Oracle), these are highly likely to become repeatable growth drivers.
Looking back at the previous Basic Report, (i) the assessment of a “markedly undervalued level backed by net cash” remains unchanged; (ii) regarding the expectation that “U-Way/ServiceNow/OCI will drive growth,” the increase in profit in the first quarter and the conclusion of OPN Level 2 have provided further support. By contrast, (iii) the expectation that “clarification of capital policy will be a rerating catalyst” has not materialized within this short period, as no additional actions such as share buybacks have been confirmed, and a valuation lift has not yet been achieved.
In summary, while the company is positioned at the “entrance to a business expansion stage,” with significant room to raise profit margins through reinforcement on the technology and partner fronts, it would be appropriate to accumulate the shares gradually over time while expecting signals on capital allocation, such as shareholder returns and M&A.
◇ 1Q FY2026/5 Highlights: Revenue growth absorbed higher costs to deliver a sharp increase in profit; the profit margin returned to just shy of double digits.
In the first quarter of FY2026/5, supported by improved utilization across businesses and a better project mix, CNS posted net sales of 1.874 billion yen (+14.0% YoY), operating profit of 182 million yen (+128.7% YoY), ordinary profit of 182 million yen (+126.8% YoY), and profit attributable to owners of parent of 154 million yen (+181.6% YoY), resulting in higher revenue and a sharp increase in profit. The operating margin improved to 9.7% (from 4.8% in the same period of the previous year), as the increase in sales absorbed higher costs and the increase in SG&A expenses remained modest. In the core Technology Solutions Business, in addition to the expansion of structures for new customers, generative AI-related projects via major system integrators grew and served as a driving force. Financially, total assets were 5.171 billion yen, and the equity ratio remained solid at 75.3%.
On the negative side, cost inflation—including the effects of wage increases—continues, and some projects remain in which costs tend to be front-loaded. However, the gross margin is on an improving trend due to the expansion of high-value-added areas centered on U-Way and ServiceNow, and there is considerable room for cost control through the promotion of standardization and reuse. The company has maintained its full-year plan for net sales of 8.253 billion yen and operating profit of 557 million yen, and the substantial progress at the first-quarter stage is a factor that raises the probability of achievement. A year-end dividend of 50 yen is planned, and the company maintains a progressive dividend policy. Overall, the expansion of orders in leading-edge areas and the stabilization of project quality are acting to lift profit margins, and the outlook for a double-digit operating margin is favorable.
At present, “qualitative growth” is being led by generative AI and OCI. The remaining issues are tolerance to rising costs and clarification of capital allocation; we would like to closely monitor the quarterly gross margin, the rate of increase in SG&A, and the trend in order unit prices.
◇Segment Analysis: The complementary relationship among the three pillars has been strengthened, and the mix is shifting toward technology.
In FY2026/5, starting with a reorganization into a headquarters system, CNS has a three-in-one structure in which the Technology Solutions Business leads, the Business Solutions Business broadens its base, and the Consulting Business is responsible for creating projects and expanding upstream touchpoints. Based on last fiscal year’s actual results, the composition ratios are 40% for the Technology Solutions Business, 49% for the Business Solutions Business, and 11% for the Consulting Business, making the shift to advanced technology areas more pronounced. From FY2026/5, the reporting categories were unified into the above three divisions, clarifying the roles and revenue models of each business.
• Technology Solutions Business: Provides ServiceNow implementation/operation, cloud/infrastructure construction, AI/next-generation technology R&D, DB performance optimization, etc. Customers are major companies in finance, telecommunications, and distribution, as well as major system integrators. Revenue consists mainly of contract development and operation/maintenance contracts after implementation. Recently, growth has been driven by the expansion of structures for new customers and generative AI projects via major system integrators.
• Business Solutions Business: Develops business applications for finance and retail/distribution, promotes data utilization, and provides the in-house asset “U-Way” centered on OCI and ERP. Customers are mainly general operating companies. Revenue consists primarily of contract development and the continuous provision of services such as operation and maintenance after implementation through U-Way, etc. CNS was the first in Japan to conclude Oracle’s Enhanced OPN Level 2. With joint GTM and human resource development, it has a structure that strengthens its ability to generate projects.
• Consulting Business: Provides DX strategy formulation, business reform, and AI human resource development (such as DX boot camps). It forms high unit-price/short-delivery projects end-to-end from upstream to implementation and serves as a hub that leads to downstream SI orders.
Recent results: On a consolidated basis for the first quarter of FY2026/5, net sales were 1.874 billion yen (+14.0% YoY) and operating profit was 182 million yen (+128.7% YoY), resulting in higher revenue and profit. The increase in sales absorbed higher costs, and curbing the growth of SG&A contributed to the improvement in the profit margin. Although detailed figures by business are not disclosed, topics in the supplementary materials suggest that the main factors were the increase in utilization in Technology and an improved mix in generative AI/cloud-related areas.
◇FY2026/5 Outlook: The company plan’s achievement is the base case for the whole year; steady progress toward the FY2027/5 targets.
The full-year plan for FY2026/5 (net sales 8.253 billion yen, operating profit 557 million yen, ordinary profit 575 million yen, profit attributable to owners of parent 427 million yen, EPS 147.08 yen, and a year-end dividend of 50 yen) remains unchanged. Based on the information available at this time, achievement of the plan is the base-case scenario. In the first quarter of FY2026/5, net sales were 1.874 billion yen, operating profit was 182 million yen, ordinary profit was 182 million yen, and profit attributable to owners of parent was 154 million yen, all increasing significantly year on year. The profit structure at present is on an improving trend.
The medium-term milestone is a KGI of “net sales of 10.0 billion yen and an operating margin of 10%” by FY2027/5 (Stage 2). In the materials, this is presented alongside employee returns (a +10% base-wage increase) and the long-term continuation of a progressive dividend. Accordingly, this fiscal year is a transition period toward Stage 2, and the focal points of evaluation will be the stabilization of the gross margin and the buildup in leading-edge areas (ServiceNow, U-Way, ERP). As a reference for FY2030/5 (Stage 3), “net sales of 15.0 billion yen and an operating margin of 12%” are shown separately, and these are clearly distinguished from the final-year KGI.
Upside factors are: (i) mix improvement driven by an increase in orders in leading-edge areas (as of the first quarter, a rise in gross profit and a recovery in the operating margin have already been confirmed); (ii) continued optimization of pricing and scope; and (iii) smoothing of workforce utilization during the fiscal year. In contrast, negative factors include personnel inflation, outsourcing costs, and front-loading of the expenses due to changes in requirements. The company bases the full-year plan on “investment in strengthening sales and organization in parallel with the expansion of focus areas.” It maintains a cautious tone, with an outlook for an operating margin of 6.7% this fiscal year, despite higher sales (previous year 7.9% → current plan 6.7%).
In aggregate, while the probability of achieving the full-year plan is high, the upside is likely to be limited to several percent. KPIs to watch closely are (i) the quarterly gross margin and SG&A ratio, (ii) the order and sales trends for ServiceNow, U-Way, and ERP, and (iii) the timing of cost recognition for large projects toward the end of the fiscal year. If stable achievement is confirmed this year, the feasibility of “net sales of 10.0 billion yen and an operating margin of 10%” in FY2027/5 will increase further.
The increase in profit in the first quarter has clearly raised the “probability of achieving the plan.” This year is one to measure the repeatability of profit margins. As long as the project mix in advanced areas and price optimization do not break down, “net sales of 10.0 billion yen and an operating margin of 10%” next fiscal year will come into view. We would like to rigorously track the quarterly gross margin, the rate of increase in operating expenses, and the seasonality of order amounts.
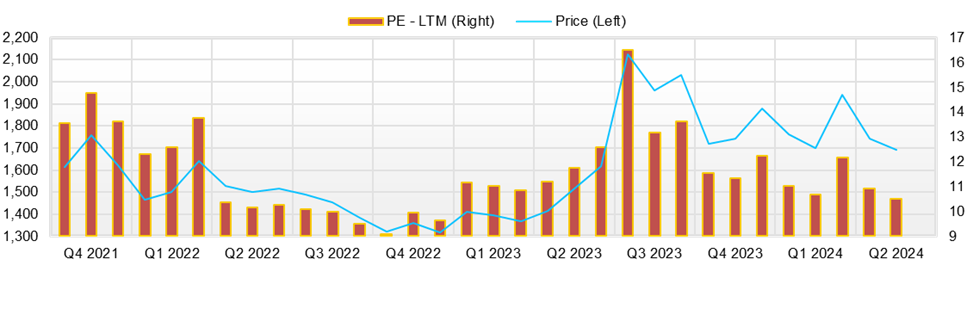
◇Share Price Trends and Points of Focus Going Forward: The small “effective EV” remains attractive. PBR is also restrained, and the current level is sufficiently undervalued. This is a phase to buy gradually over time.
CNS’s current valuation is a forecast PER of 11.01x and an actual PBR of 1.21x. Deducting ample net cash of 3.472 billion yen from the market capitalization of 4.7 billion yen, the “effective EV” is only around 1.2 billion yen. Based on the full-year operating profit plan of 557 million yen, EV/EBIT is contained in the 2x range, a level that combines defensiveness and undervaluation. Over the past three months (July to mid-October), the share price broke out once from the box range centered on the 1,500-yen level, triggered by the earnings announcement on October 10. The closing price on the day before October 10 was 1,721 yen, and on October 14, the intraday price fell back to 1,630 yen, confirming an expansion in the trading range after the event. Valuation is low, and no excessive premium has been attached.
The market’s assessment can be organized as a tug-of-war among three factors: first, downside resilience due to financial soundness and cash on hand; second, growth expectations for the expansion of leading-edge areas; and third, a discount factor stemming from the opacity of capital allocation. In particular, the three points of ServiceNow, OCI/ERP (U-Way), and the “local utilization” of generative AI are consistent with the recovery in profit margins that emerged in the results; if their continued contribution to sales and gross profit from here becomes visible, the potential for lifting the share-price multiple will become more apparent. On the other hand, the fact that capital allocation policies such as enhanced shareholder returns, share buybacks, and M&A remain limited continues to cap the upside of the valuation.
As for the tendency of share price reactions to catalysts, a recent pattern has been observed of straightforward attempts to rise on “favorable earnings/strategy updates” and “improved supply-demand.” In the first quarter of FY2026/5, net sales were 1.874 billion yen and operating profit was 182 million yen (operating margin 9.7%), far exceeding the previous year, and the price range on the event day rose. In addition, the “local utilization” policy for generative AI announced on October 3 had an easy-to-understand theme of demand in the realm of confidential information, and supported the tone of the share price together with expectations for earnings in the week immediately afterward. Furthermore, the Enhanced Oracle PartnerNetwork Level 2 agreement on August 14 demonstrates the strengthening of OCI supply capacity and the joint GTM structure, which acts positively as demand-side backing. All of these factors are highly consistent with the company’s focus areas, and the assessment has progressed in tandem with supply and demand.
From a technical perspective, the long bullish candle and increase in volume triggered by the earnings release are conditions that tend to function as a “turnaround signal from a downward bias.” While simultaneous increases in volume and price can be read beginning on October 10, a pullback into the 1,600-yen range was observed as of the 14th, and short-term volatility has increased. We regard the low 1,600-yen range as a buy-on-dips zone, and the high 1,700s to just under 1,800 yen as an initial band of overhead supply. It is appropriate to track these together with the trend in volume before and after events. A breakout without catalysts is unlikely to be sustained; a clear breakout requires fundamentals to follow through.
Even at the current share price, an overweight is warranted, but this is not a situation to rush. Additional confirmation is required to justify immediate additions. First, strengthened disclosure of quantitative KPIs in leading-edge areas (orders, sales, and gross profit for U-Way, ServiceNow, and the local utilization of generative AI); second, an upward revision to full-year guidance (at least an increase in operating profit and an indication of upside in the operating margin); and third, a commitment on capital allocation (clarifying the dividend range, share buybacks, and guideposts for M&A investment amounts). If these are presented together, an upward shift in PBR—starting from the inexpensive, effective EV—will come into view. As for investment timing, a staggered approach of building positions immediately before and after earnings and IR events is rational, and, in particular, joint seminars with Oracle and the publication of implementation case studies are likely to stimulate the share price.
Comparing the past three months with the external environment, the most influential factors on the company’s share price have been IR related to “financial results figures” and the “degree of implementation of strategy.” Therefore, if in the next quarter the trio of gross margin, SG&A ratio, and unit order price is maintained, and projects in leading-edge areas are disclosed together with specific names and implementation effects, the share price is highly likely to undergo a rerating alongside an improvement in supply and demand.
The small effective EV remains attractive, and if the earnings fundamentals take a step forward, there is significant room to lift the share-price multiple. This fiscal year, the keys to evaluation are the “repeatability of plan achievement” and the “disclosure of KPIs in leading-edge areas.” If signals on capital allocation are added to these, a story in which PBR converges in the 1.3–1.5x range will become more realistic. At the current share price level, the sense of undervaluation is significant; while confirming KPIs and the quality of the company’s disclosure stance, a stance of increasing holdings over time is reasonable.
Key stock price data
Company profile
◇An independent SI centered on cloud and AI technologies; a growth-type IT services company shifting its focus to leading-edge areas
CNS Co., Ltd. is an independent IT services company established in 1985 and listed on the Tokyo Stock Exchange Mothers (now the Growth Market) in 2021. As of the end of May 2025, the number of employees was 221 on a non-consolidated basis and 265 on a consolidated basis. With “CNS Hokkaido Co., Ltd.” based in Hokkaido as a consolidated subsidiary, the Group develops engineering services as a whole.
The business consists of three main pillars: (i) the Technology Solutions Business, (ii) the Business Solutions Business, and (iii) the Consulting Business. These are centered on leading-edge areas such as cloud, AI, ServiceNow, data analytics, ERP, and business reform support, and the company is shifting from conventional contract development to platform-type and asset-type businesses.
Major customers include the NTT DATA Group, the Nomura Research Institute Group, and the NS Solutions Group; CNS has a stable customer base centered on finance, distribution, and public sectors. The average age is 32.7, the average years of service are 6.0, and the annual average wage is 6.839 million yen; despite the workforce being centered on younger employees, a stable human capital strategy has been built.
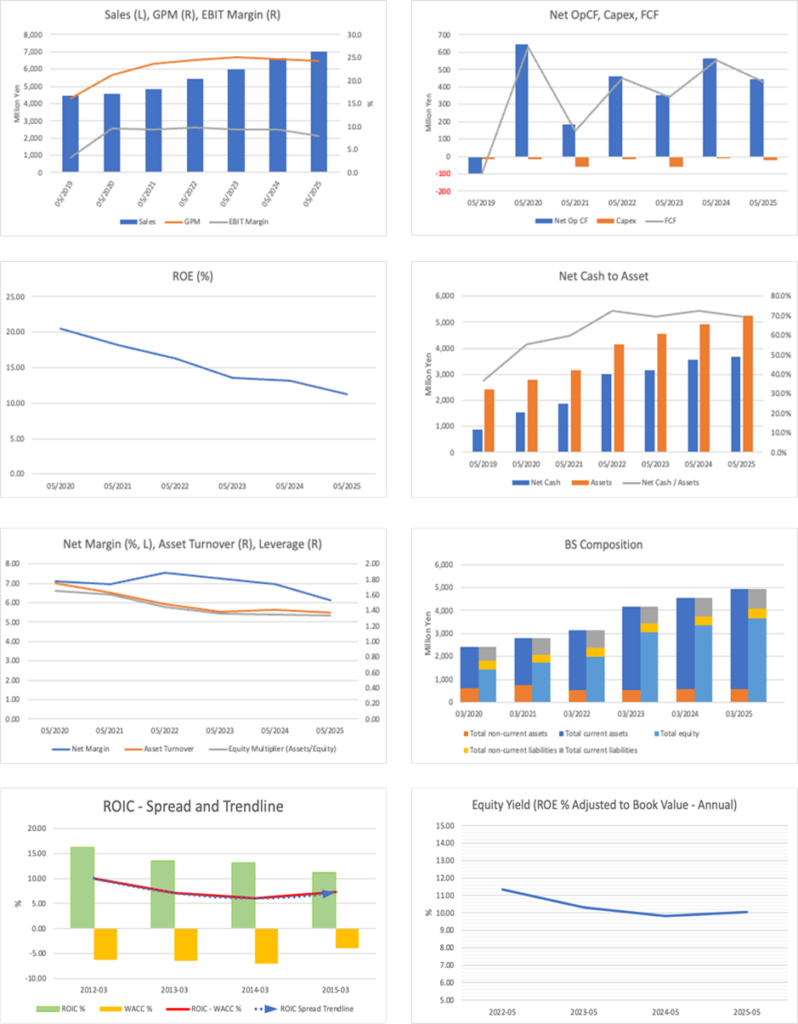
Key financial data
| Unit: million yen | 2021 | 2022 | 2023 | 2024 | 2025 CE |
| Sales | 5,419 | 5,989 | 6,657 | 7,005 | 8,253 |
| EBIT (Operating Income) | 533 | 559 | 620 | 555 | 557 |
| Pretax Income | 595 | 589 | 636 | 583 | |
| Net Profit Attributable to Owner of Parent | 409 | 433 | 461 | 427 | 427 |
| Cash & Short-Term Investments | 3,010 | 3,163 | 3,574 | 3,667 | |
| Total assets | 4,152 | 4,547 | 4,934 | 5,260 | |
| Total Debt | 6 | 13 | 11 | 8 | |
| Net Debt | -3,004 | -3,150 | -3,563 | -3,659 | |
| Total liabilities | 1,113 | 1,206 | 1,262 | 1,300 | |
| Total Shareholders’ Equity | 3,039 | 3,341 | 3,672 | 3,959 | |
| Net Operating Cash Flow | 461 | 353 | 565 | 444 | |
| Capital Expenditure | 19 | 59 | 11 | 24 | |
| Net Investing Cash Flow | -23 | -126 | -81 | -269 | |
| Net Financing Cash Flow | 634 | -133 | -134 | -142 | |
| Free Cash Flow | 450 | 344 | 554 | 429 | |
| ROA (%) | 11.23 | 9.96 | 9.73 | 8.38 | |
| ROE (%) | 16.27 | 13.58 | 13.16 | 11.20 | |
| EPS (Yen) | 145.5 | 149.0 | 158.8 | 147.1 | 147.1 |
| BPS (Yen) | 1,045.7 | 1,149.7 | 1,263.5 | 1,362.5 | |
| Dividend per Share (Yen) | 45.00 | 45.00 | 48.00 | 75.00 | 50.00 |
| Shares Outstanding (Million shares) | 2.91 | 2.91 | 2.91 | 2.91 |
Source: Omega Investment from company data, rounded to the nearest whole number.
Share price
Financial data (quarterly basis)
| Unit: million yen | 2024/5 | 2025/5 | 2026/5 | ||||||
| 1Q | 2Q | 3Q | 4Q | 1Q | 2Q | 3Q | 4Q | 1Q | |
| (Income Statement) | |||||||||
| Sales | 1,646 | 1,651 | 1,683 | 1,677 | 1,645 | 1,720 | 1,823 | 1,818 | 1,875 |
| Year-on-year | 17.5% | 14.3% | 10.5% | 3.5% | -0.1% | 4.2% | 8.3% | 8.4% | 14.0% |
| Cost of Goods Sold (COGS) | 1,242 | 1,236 | 1,262 | 1,278 | 1,266 | 1,294 | 1,368 | 1,370 | 1,386 |
| Gross Income | 404 | 415 | 421 | 399 | 378 | 425 | 455 | 448 | 488 |
| Gross Income Margin | 24.5% | 25.1% | 25.0% | 23.8% | 23.0% | 24.7% | 24.9% | 24.7% | 26.0% |
| SG&A Expense | 263 | 233 | 232 | 292 | 298 | 279 | 260 | 314 | 306 |
| EBIT (Operating Income) | 141 | 182 | 189 | 108 | 80 | 146 | 195 | 134 | 182 |
| Year-on-year | 33.7% | 11.5% | 8.2% | -6.8% | -43.6% | -19.5% | 3.0% | 24.9% | 128.7% |
| Operating Income Margin | 8.6% | 11.0% | 11.2% | 6.4% | 4.8% | 8.5% | 10.7% | 7.4% | 9.7% |
| EBITDA | 149 | 190 | 198 | 117 | 88 | 155 | 209 | 150 | 195 |
| Pretax Income | 131 | 193 | 190 | 123 | 81 | 160 | 202 | 140 | 229 |
| Consolidated Net Income | 89 | 131 | 130 | 111 | 55 | 107 | 137 | 128 | 155 |
| Minority Interest | 0 | 0 | 0 | 0 | 0 | 0 | 0 | 0 | 0 |
| Net Income ATOP | 89 | 131 | 130 | 111 | 55 | 107 | 137 | 128 | 155 |
| Year-on-year | 18.0% | 14.5% | 3.7% | -5.7% | -38.4% | -18.2% | 5.5% | 15.3% | 181.6% |
| Net Income Margin | 5.4% | 7.9% | 7.7% | 6.6% | 3.3% | 6.2% | 7.5% | 7.0% | 8.3% |
| (Balance Sheet) | |||||||||
| Cash & Short-Term Investments | 3,047 | 3,244 | 3,325 | 3,574 | 3,372 | 3,382 | 3,355 | 3,667 | 3,479 |
| Total assets | 4,414 | 4,622 | 4,665 | 4,934 | 4,732 | 5,005 | 4,946 | 5,260 | 5,172 |
| Total Debt | 13 | 12 | 11 | 11 | 10 | 9 | 9 | 8 | 7 |
| Net Debt | -3,035 | -3,232 | -3,314 | -3,563 | -3,362 | -3,372 | -3,346 | -3,659 | -3,472 |
| Total liabilities | 1,115 | 1,191 | 1,104 | 1,262 | 1,145 | 1,311 | 1,114 | 1,300 | 1,275 |
| Total Shareholders’ Equity | 3,300 | 3,431 | 3,561 | 3,672 | 3,587 | 3,694 | 3,832 | 3,959 | 3,896 |
| (Profitability %) | |||||||||
| ROA | 10.69 | 10.53 | 10.51 | 9.73 | 9.34 | 8.38 | 8.54 | 8.38 | 10.65 |
| ROE | 14.22 | 14.19 | 13.80 | 13.16 | 12.40 | 11.32 | 11.10 | 11.20 | 14.09 |
| (Per-share) Unit: JPY | |||||||||
| EPS | 30.7 | 45.1 | 44.8 | 38.1 | 18.9 | 36.9 | 47.3 | 44.0 | 53.3 |
| BPS | 1,135.5 | 1,180.5 | 1,225.4 | 1,263.5 | 1,234.4 | 1,271.3 | 1,318.6 | 1,362.5 | 1,340.8 |
| Dividend per Share | 0.00 | 0.00 | 0.00 | 48.00 | 0.00 | 0.00 | 0.00 | 75.00 | 0.00 |
| Shares Outstanding (million shares) | 2.91 | 2.91 | 2.91 | 2.91 | 2.91 | 2.91 | 2.91 | 2.91 | 2.91 |
Source: Omega Investment from company materials
Financial data (full-year basis)
| Unit: million yen | 2021 | 2022 | 2023 | 2024 |
| (Income Statement) | ||||
| Sales | 5,419 | 5,989 | 6,657 | 7,005 |
| Year-on-year | 11.9% | 10.5% | 11.1% | 5.2% |
| Cost of Goods Sold | 4,097 | 4,483 | 5,018 | 5,298 |
| Gross Income | 1,322 | 1,506 | 1,639 | 1,707 |
| Gross Income Margin | 24.4% | 25.1% | 24.6% | 24.4% |
| SG&A Expense | 789 | 947 | 1,019 | 1,151 |
| EBIT (Operating Income) | 533 | 559 | 620 | 555 |
| Year-on-year | 16.4% | 4.8% | 10.9% | -10.4% |
| Operating Income Margin | 9.8% | 9.3% | 9.3% | 7.9% |
| EBITDA | 559 | 589 | 654 | 601 |
| Pretax Income | 595 | 589 | 636 | 583 |
| Consolidated Net Income | 409 | 433 | 461 | 427 |
| Minority Interest | 0 | 0 | 0 | 0 |
| Net Income ATOP | 409 | 433 | 461 | 427 |
| Year-on-year | 21.6% | 5.8% | 6.5% | -7.4% |
| Net Income Margin | 7.6% | 7.2% | 6.9% | 6.1% |
| (Balance Sheet) | ||||
| Cash & Short-Term Investments | 3,010 | 3,163 | 3,574 | 3,667 |
| Total assets | 4,152 | 4,547 | 4,934 | 5,260 |
| Total Debt | 6 | 13 | 11 | 8 |
| Net Debt | -3,004 | -3,150 | -3,563 | -3,659 |
| Total liabilities | 1,113 | 1,206 | 1,262 | 1,300 |
| Total Shareholders’ Equity | 3,039 | 3,341 | 3,672 | 3,959 |
| (Cash Flow) | ||||
| Net Operating Cash Flow | 461 | 353 | 565 | 444 |
| Capital Expenditure | 19 | 59 | 11 | 24 |
| Net Investing Cash Flow | -23 | -126 | -81 | -269 |
| Net Financing Cash Flow | 634 | -133 | -134 | -142 |
| Free Cash Flow | 450 | 344 | 554 | 429 |
| (Profitability ) | ||||
| ROA (%) | 11.23 | 9.96 | 9.73 | 8.38 |
| ROE (%) | 16.27 | 13.58 | 13.16 | 11.20 |
| Net Margin (%) | 7.56 | 7.23 | 6.93 | 6.10 |
| Asset Turn | 1.49 | 1.38 | 1.40 | 1.37 |
| Assets/Equity | 1.45 | 1.36 | 1.35 | 1.34 |
| (Per-share) Unit: JPY | ||||
| EPS | 145.5 | 149.0 | 158.8 | 147.1 |
| BPS | 1,045.7 | 1,149.7 | 1,263.5 | 1,362.5 |
| Dividend per Share | 45.00 | 45.00 | 48.00 | 75.00 |
| Shares Outstanding (million shares) | 2.91 | 2.91 | 2.91 | 2.91 |
Source: Omega Investment from company materials