2026-07-27
Home
Japanese

Omega Investment Co., Ltd.
Digital Hearts Holdings (Company note – 2Q update)

| Share price (12/21) | ¥950 | Dividend Yield (24/3 CE) | 2.21 % |
| 52weeks high/low | ¥1,950 / 818 | ROE(23/3) | 3.48 % |
| Avg Vol (3 month) | 160.7 thou shrs | Operating margin (23/3) | -6.41 % |
| Market Cap | ¥22.6 bn | Beta (5Y Monthly) | 0.94 |
| Enterprise Value | ¥20.1 bn | Shares Outstanding | 23.890 mn shrs |
| PER (24/3 CE) | 38.46 X | Listed market | TSE Prime section |
| PBR (23/3 act) | 2.64 X |
| Click here for the PDF version of this page |
| PDF Version |
FY2024/3 Q2, 6% revenue growth, but recorded impairment loss, resulted in downward revision to full year. For the second half of the year, however, recovery trend is planned.
▷Summary of financial results: Sales rose by 6%, but impairment losses at overseas subsidiaries led to a bottom-line loss. Full-year forecasts were revised downwards. The Company plans to recover to a trend of higher sales and profits over the second half of the year.
Digital Hearts Holdings’ (hereinafter referred to as ‘the Company’) Q2 results for FY2024/3 grew 6% YoY to 18.6 billion yen continued to be lead the way by the Enterprise Business. Operating profit, however, declined by 47% (to 729 million yen) due to the impact of lower sales in the Entertainment Business and an increase in SG&A expenses due to strategic investments, including expenses related to the Spin-Off Listing of AGEST, Inc. An extraordinary loss of 1 billion yen was recorded, mainly due to a goodwill impairment of overseas subsidiaries, resulting in a net loss attributable to owners of the parent company of 436 million yen.
The Company has revised its full-year forecasts downwards in line with these results. Sales were reduced from 40.75 billion yen to 40 billion yen, and operating profit from 3.12 billion yen to 2.5 billion yen, resulting in a decrease in profit forecast from an increase in profit forecast. Net profit attributable to owners of the parent was revised down from 2.1 billion yen to 550 million yen. For the year’s second half, the Company aims to return to higher sales and profits, therefore achieving record-high sales and operating profit on a half-yearly basis.
Preparations for the Spin-Off Listing of AGEST, Inc. appear to be progressing steadily as planned. The reorganisation of Enterprise group companies is scheduled for January 1, 2024, and if FY2024 is set as the base period, a Spin-Off Listing is expected to be realised in 2025.
▷FY2024/3 full-year forecasts: Plans to return to a trend of higher sales and profits in the second half of the year.
As of the end of Q2, the Company had achieved 47% and 29% of its revised FY2024/3 full-year estimates of 40 billion yen in sales and 2.5 billion yen in operating profit, respectively. The Company plans to increase sales and profits in the second half of the year due to a recovery in business performance, and for the second half alone, it expects sales of 21.33 billion yen, up 13% YoY, and operating profit of 1.77 billion yen, up 9% YoY, with operating profit expected to reach a record half-year high. In the second half of the year, net profit attributable to owners of the parent company is expected to be approximately 1 billion yen, but due to the impact of impairment losses in the first half, full-year bottom-line profit will be 550 million yen.
▷Stock price trend: Expectations for a rebound as all the negative catalysts are out
The share price fell by about 14% in the two days following the announcement of the Q2 results and the downward revision of the full-year forecast. Following the recording of an extraordinary loss on goodwill impairment of the overseas subsidiary of the Entertainment Business (about 1 billion yen) in FY2023/3, the surprise impact of the announcement of an impairment loss of the same amount at an overseas enterprise companies seems to have been significant. On the other hand, it can be said that the bad news has been exhausted by the impairment of the overseas business, which was one of the challenges in terms of profitability, and positive news can be expected in the future. Preparations for the Spin-Off Listing are progressing steadily, and we will keep a close eye on future developments.
| JPY, mn, % | Net sales | YoY % |
Oper. profit |
YoY % |
Ord. profit |
YoY % |
Profit ATOP |
YoY % |
EPS (¥) |
DPS (¥) |
| 2020/3 | 21,138 | 9.8 | 1,394 | -13.2 | 1,372 | -16.9 | 792 | -49.7 | 36.31 | 14.00 |
| 2021/3 | 22,669 | 7.2 | 1,908 | 36.9 | 1,975 | 43.9 | 974 | 23.0 | 45.15 | 14.00 |
| 2022/3 | 29,178 | 28.7 | 2,696 | 41.3 | 2,774 | 40.4 | 1,778 | 82.5 | 82.25 | 15.00 |
| 2023/3 | 36,517 | 25.2 | 3,000 | 11.3 | 3,152 | 13.6 | 799 | -55.0 | 36.50 | 21.00 |
| 2024/3 (Prev. CE) | 40,750 | 11.6 | 3,120 | 4.0 | 3,160 | 0.2 | 2,100 | 162.6 | 95.86 | 21.00 |
| 2024/3 (New. CE) | 40,000 | 9.5 | 2,500 | -16.7 | 2,560 | -18.8 | 550 | -31.2 | 24.69 | 21.00 |
| 2023/3 Q2 | 17,562 | 30.1 | 1,372 | 0.2 | 1,517 | 6.0 | 945 | 3.1 | 43.70 | 10.50 |
| 2024/3 Q2 | 18,669 | 6.3 | 729 | -46.8 | 792 | -47.8 | -436 | – | -19.61 | 10.50 |
Full year consolidated sales / operating profit trend
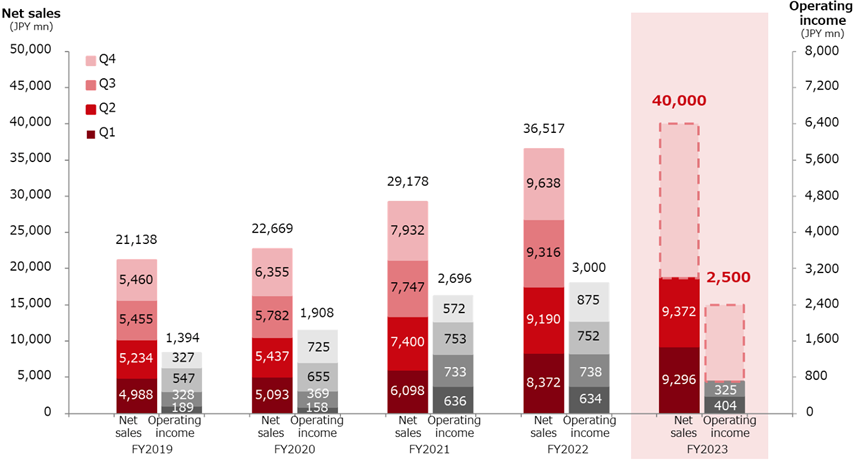
The company handout for the 2nd quarter results for FY2024/3 (published on November 9, 2023)
◇ Results for Q2 FY2024/3: Operating profit declined by 47% despite increased revenues. Impairment losses on overseas subsidiaries were recorded as extraordinary losses and full-year forecasts were revised downwards.
In the Company’s Q2 results for FY2024/3, sales rose by 6.3% to 18,669 million yen, with the Entertainment Business experiencing a decline in sales in the result to the strong performance of the previous year, while the Enterprise Business continued to perform well with a 23.8% increase in sales. Operating profit decreased by 46.8% to 729 million yen due to the impact of the decline in sales in the Entertainment Business, deteriorating profitability of overseas subsidiaries in the Enterprise Business, as well as investment in growth and the cost of the Spin-Off Listing of AGEST, Inc. In addition, as a result of a major review of the management structure and sales strategy of the overseas operations of the Enterprise Business, impairment losses of 1,030 million yen were recorded for related goodwill, etc. (This includes impairment losses of 584 million yen at LOGIGEAR CORPORATION and 446 million yen at DEVELOPING WORLD SYSTEMS LIMITED and MK Partners, Inc.) As a result, the net attributable to owners of the parent company was a loss of 436 million yen.
See the diagram below for an analysis of changes in EBITDA. EBITDA of the Enterprise Business fell by 10.4% to 397 million yen. Despite an increase in gross profit due to higher revenue, the decline in gross profit margin caused by deteriorating profitability of overseas subsidiaries and the occurrence of low-profit projects in software development, as well as the active recruitment of engineers, the change of personal expenses which had been included in company-wide expenses to this business in preparation for the Spin-Off Listing, and one-off expenses, resulted in a decline in EBITDA. In the Entertainment Business, EBITDA fell by 25.5% to 1,772 million yen due to a decline in gross profit as a result of lower sales compared to the very strong previous year, an increase in the fixed cost ratio due to lower sales, opening new bases and strategic investments in human resources such as raising testers’ hourly wage. As a result, despite curbing company-wide common costs (+12 million yen), overall EBITDA fell by 33.4% to 1,279 million yen.
Analysis of Changes in EBITDA
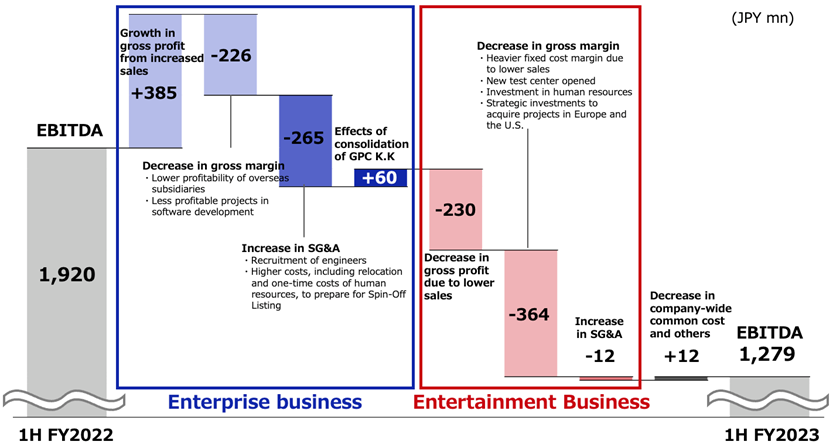
Source: The company handout for the 2nd quarter results for FY2024/3 (published on November 9, 2023)
◇ Segmental trends: (see also chart below and table on P7)
1) Enterprise Business: Sales: 9,429 million yen, +23.8%; operating profit: 35 million yen, -66.5%.
In response to a tailwind of increased domestic IT investment, the Company recruited engineers, strengthened its technological capabilities and expanded its service offerings, which, together with the effects of M&A, resulted in a 23.8% increase in revenue. On the profit, segment profit fell by 66.5% to 35 million yen due to the deterioration of profitability in overseas subsidiaries, restructuring group subsidiaries in preparation for the Spin-Off Listing of AGEST, Inc., increased head office personnel and expenses related to relocating head office functions.
Trends in the sub-segments are as follows:
QA Solution: Sales: 6,287 million yen (+37.2%). Demand for software testing in Japan continues to grow against the backdrop of DX acceleration and other factors, and even excluding the effects of M&As, the Company achieved a significant 27.6% increase in revenue. See the table below for main KPIs of QA solutions. Although the number of clients with orders decreased QoQ, this was due to a decline in the number of overseas clients, while the number of domestic clients increased. Average sales per clients and number of engineers are steadily increasing.
QA solutions main KPIs
FY2022/3 |
FY2023/3 |
FY2024/3 |
|||||
Q4 |
Q1 |
Q2 |
Q3 |
Q4 |
Q1 |
Q2 |
|
Number of clients with orders (companies) |
748 |
627 |
650 |
693 |
808 |
824 |
822 |
Average sales per client (million yen) |
10 |
10 |
12 |
12 |
13 |
13 |
14 |
Number of engineers (people) |
924 |
961 |
1,026 |
993 |
1,009 |
1,047 |
1,082 |
Source: Prepared by Omega Investment based on company data.
IT services and others: Sales: 3,141 million yen (+3.7%). The security monitoring service grew by 13.2% as the Company captured increasing demand against the backdrop of the expansion of remote working and other factors. The business base is steadily expanding, with the number of registered engineers at identity Inc., which became a subsidiary in June 2021, reaching 32,000.
Sales/Profit by Segment(Quarterly basis)
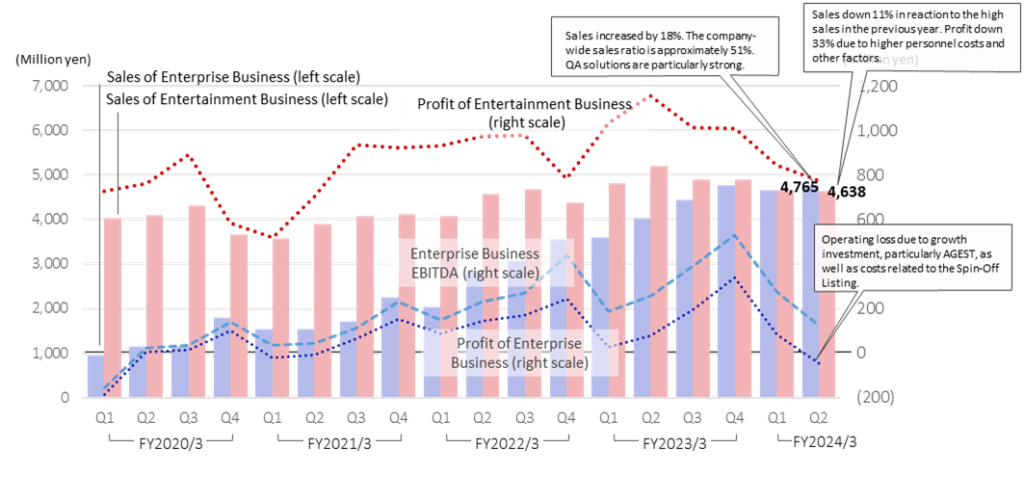
Source: Prepared by Omega Investment based on company data
2) Entertainment Business: Sales: 9,299 million yen, – 7.2%; operating profit: 1,618 million yen,
-26.2%.
Domestic debugging maintained a high level of sales, but sales fell due to the impact of a backlash from the previous year. Meanwhile, Global and others also experienced sluggish growth, resulting in an overall sales decline of 7.2%. Profits fell by 26.2% due to the decline in sales and the impact of higher personnel costs, including increasing tester hourly wages to secure talented personnel. The Company expects sales and profitability to recover in the second half of the year.
Domestic debugging: Sales: 6,340 million yen (-8.1%). In console games, sales fell sharply due to the launch of a series of major titles in the previous year. However, by strengthening service quality etc., the Company maintains a high quarterly sales level of 3.1 billion yen, 105% of the FY2022/3 Q4 level. In addition to the decline in sales, the gross profit margin fell to 28.5% from 32.5% registered in FY2022/3 1H due to higher labour costs from the hourly wage increase implemented in April and the opening of a new base (Kumamoto), etc. The Company expects the gross profit margin to recover to the 30% level in the second half of the year as a result of sales growth and the penetration of the price pass-on from October.
Global and others: Sales: 2,958 million yen (-5.3%). In the Chinese market, sales fell due to the aftermath of the impact of COVID-19 and gaming regulations, as well as the detachment of the local advertising agency business in Taiwan. However, looking only at the focused areas of global services (translation, LQA, and marketing support), sales growth remained high at +10% YoY, excluding the impact of business restructuring of this business divestiture. Meanwhile, in August, the Company signed a strategic business alliance agreement with Localsoft, S.L., a game localisation company headquartered in Spain, to expand services for Japanese and Asian game makers expanding into Europe and the Middle East, and to strengthen its sales structure for European game makers. Furthermore, the Company is promoting initiatives for new growth in the Entertainment Business, including the commencement of development of an AI-based game translation engine, etc.
◇ Forecast for FY2024/3: Downward revision following Q2 results announcement
Following the announcement of Q2 results, the Company revised its full-year forecasts downwards. Sales were reduced from 40.75 billion yen to 40 billion yen, operating profit from 3.12 billion yen to 2.5 billion yen, and ordinary profit from 3.16 billion yen to 2.56 billion yen, resulting in a decrease in profit forecast from an increase in profit forecast before. Net profit attributable to owners of the parent was revised downwards from 2.1 billion yen to 550 million yen.
The reasons for the revision to the forecast for sales are as follows: 1) the Entertainment Business was affected by the expansion of COVID-19 and regulations in the Chinese games market, in addition to a lower result from the previously strong domestic games market; and 2) in the Enterprise Business, there was a delay in acquiring new projects at overseas subsidiaries following the expansion of COVID-19. The factors affecting profit were: 1) the failure to achieve sales estimates in both businesses; 2) increased costs for upfront investment in the Entertainment Business to strengthen the global business; 3) costs related to the Spin-Off Listing of AGEST, Inc.; and 4) impairment losses on goodwill and other assets of the aforementioned overseas businesses, which were recorded as extraordinary losses in the Q2.
As of the end of Q2, the Company achieved 46.7% and 29.2% of its revised forecasts for FY2024/3 of 40 billion in sales and 2.5 billion in operating profit, respectively. In the second half of the year, however, the Entertainment Business is expected to return to the trend of rising sales and profits backed by the recovery of the domestic games market, while the Enterprise Business is also expected to improve profitability thanks to the restructuring of overseas subsidiaries (cost reductions due to changes in growth strategy and management restructuring, reduced goodwill amortisation burden, etc.) and the expansion of domestic sales. As a result, the Company has announced that it is aiming for record sales of 21,330 million yen and operating profit of 1,770 million yen on a half-yearly basis.
Revised full-year consolidated forecasts for FY2024/3.
| JPY, mn | Net sales | Oper. profit |
Ord. profit |
Profit ATOP |
EPS (¥) |
| Previous forecast (A) | 40,750 | 3,120 | 3,160 | 2,100 | 95.86 |
| Revised forecast (B) | 40,000 | 2,500 | 2,560 | 550 | 24.69 |
| Change (B – A) | -750 | -620 | -600 | -1,550 | – |
| Percentage change (%) | -1.8 | -19.9 | -19.0 | -73.8 | – |
| Actual results for FY2023/3 | 36,517 | 3,000 | 3,152 | 799 | 36.50 |
| Revised forecast, YoY (%) | 9.5 | -16.7 | -18.8 | -31.2 | 24.69 |
| Actual results for Q2 | 18,669 | 729 | 792 | -436 | |
| Progress ratio as at Q2 (%) | 46.7 | 29.2 | 30.9 | – | – |
Source: Prepared by Omega Investment based on company data
◇ Progress of AGEST’s Spin-Off Listing project
In previous reports, we have noted that a detailed explanation of the Spin-Off Listing was required to investors, but more informative explanatory slides have been added to the financial results presentation for reference (https://pdf.irpocket.com/C3676/MH4b/r0vN/Mhmb.pdf). From page 29 onwards, the document explains in an easy-to-understand manner the respective goals of the Enterprise Business and Entertainment Business and the choice to list AGEST, Inc. as a Spin-Off because the two businesses require different expertise and a different corporate culture.
Since the Spin-Off Listing plan was revealed in May at the time of the FY2023/3 result announcement, the Company has been actively recruiting personnel to build up AGEST’s management structure, governance and head office functions in order to realise the Spin-Off Listing and the schedule appears to be progressing well (see diagram below).
In addition, the Company’s US testing subsidiary, which recorded an impairment loss in Q2, has undergone a renewal of its management structure and organisational restructuring. The Vietnamese subsidiary of the US subsidiary was reorganised as AGEST Vietnam Co. Ltd. under the AGEST brand and will be reorganised as a subsidiary of AGEST. Vietnamese engineers and proprietary tools, which were previously utilised for services to European and US customers, will be actively utilised for services to Japanese companies (see next page, above diagram). The reorganisation of these Enterprise-related group companies is scheduled to take place on January 1, 2024, and once the framework of the new AGEST Group is solidified in January 2024, a Spin-Off Listing is expected in 2025, with FY2024 as the base period.
Progress of AGEST’s Spin-Off schedule
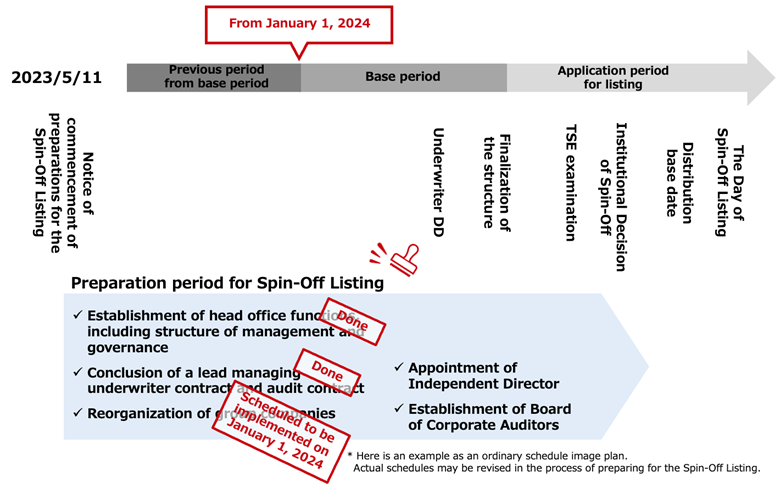
Source: The company handout for the 2nd quarter results for FY2024/3 (published on November 9, 2023)
Reorganisation of the group’s businesses around AGEST, Inc.
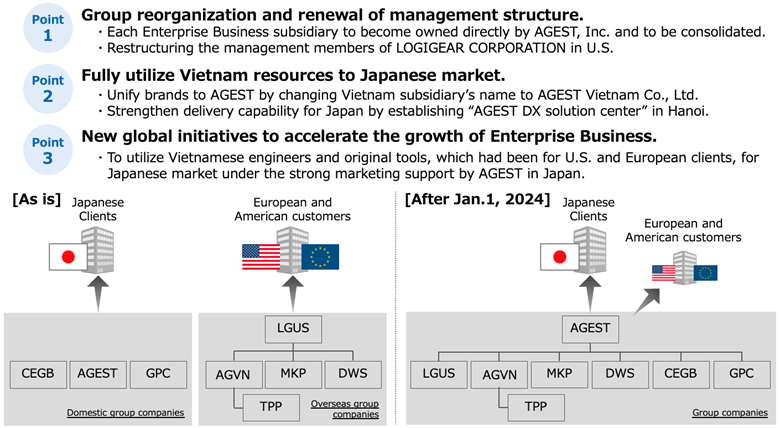
Source: The company handout for the 2nd quarter results for FY2024/3 (published on November 9, 2023)
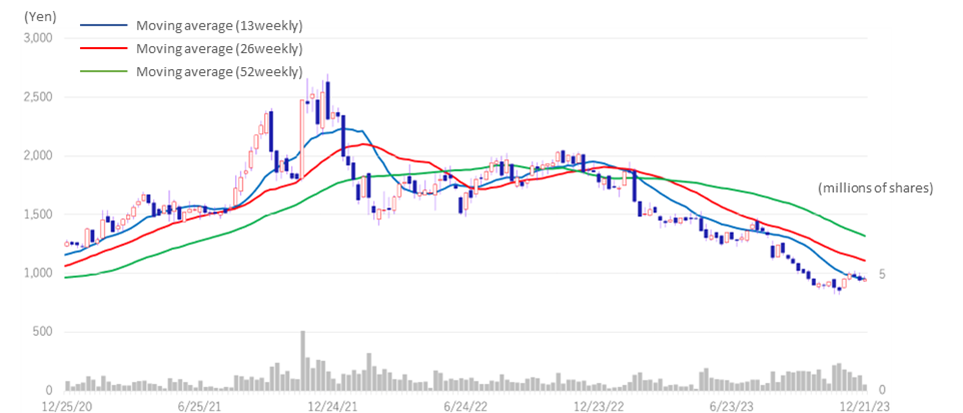
◇ Stock price trend: Expectations for a rebound, as all the negative catalysts are out of the picture
The Company’s share price has been on a downtrend since reaching a high of 2,700 yen on December 13, 2021. Following the announcement of the Q2 results and the downward revision of the full-year forecast, the share price fell 14% in the two days following the results announcement. The decline since the beginning of the year has been 52.7%. As the Entertainment Business had performed extremely well in the previous year, there was expected to be a certain degree of reactionary impact. However, it was a big surprise that an impairment loss of the same amount as the goodwill impairment of the overseas subsidiary of the Entertainment Business in FY2023/3 (approximately 1 billion yen) was also recorded at the overseas subsidiary of the Enterprise Business. The change in strategy in the overseas business, which has been low-profitable on a number of occasions since last year, is expected to and returning to profitability. And the impairment is also expected to lighten the burden of amortisation. In ddition, as seen above, preparations for the Spin-Off Listing are progressing steadily. We will keep a close eye on those progress, including the future recovery in earnings.
Digital Hearts Holdings (3676) Stock Price Trend (3Year-to-date)
Financial data I
2021/3 |
2022/3 |
2023/3 |
2024/3 |
|||||||||||
Q1 |
Q2 |
Q3 |
Q4 |
Q1 |
Q2 |
Q3 |
Q4 |
Q1* |
Q2* |
Q3* |
Q4* |
Q1 |
Q2 |
|
[Sales by segment] |
||||||||||||||
Net sales |
5,093 |
5,437 |
5,782 |
6,355 |
6,098 |
7,400 |
7,747 |
7,932 |
8,372 |
9,190 |
9,316 |
9,638 |
9,262 |
9,372 |
YoY |
2.1% |
3.9% |
6.0% |
16.4% |
19.7% |
36.1% |
34.0% |
24.8% |
37.3% |
24.2% |
20.3% |
21.5% |
11.0% |
2.0% |
Enterprise business |
1,523 |
1,540 |
1,710 |
2,246 |
2,029 |
2,833 |
3,074 |
3,553 |
3,589 |
4,025 |
4,451 |
4,774 |
4,663 |
4,765 |
YoY |
59.6% |
35.1% |
50.9% |
25.2% |
33.2% |
83.9% |
79.7% |
58.2% |
76.8% |
42.0% |
44.8% |
34.3% |
29.9% |
18.4% |
Composition of sales |
29.9% |
28.3% |
29.6% |
35.3% |
33.3% |
38.3% |
39.7% |
44.8% |
42.9% |
43.8% |
47.8% |
49.5% |
50.2% |
50.8% |
QA solution |
1,129 |
1,127 |
1,267 |
1,633 |
1,395 |
1,572 |
1,772 |
2,121 |
2,102 |
2,481 |
2,730 |
3,166 |
3,101 |
3,186 |
YoY |
– |
– |
– |
– |
23.6% |
39.5% |
39.9% |
29.9% |
50.7% |
57.8% |
54.1% |
49.3% |
47.5% |
28.4% |
Composition of sales |
22.2% |
20.7% |
21.9% |
25.7% |
22.9% |
21.2% |
22.9% |
26.7% |
25.1% |
27.0% |
29.3% |
32.8% |
33.9% |
34.0% |
IT services and others |
393 |
413 |
442 |
613 |
634 |
1,260 |
1,301 |
1,432 |
1,486 |
1,543 |
1,721 |
1,608 |
1,562 |
1,579 |
YoY |
– |
– |
– |
– |
61.3% |
205.1% |
194.3% |
133.6% |
134.3% |
22.4% |
32.3% |
12.4% |
5.1% |
2.3% |
Composition of sales |
7.7% |
7.6% |
7.6% |
9.6% |
10.4% |
17.0% |
16.8% |
18.1% |
17.7% |
16.8% |
18.5% |
16.7% |
16.8% |
16.8% |
Entertainment business |
3,566 |
3,900 |
4,072 |
4,109 |
4,069 |
4,566 |
4,672 |
4,378 |
4,818 |
5,201 |
4,906 |
4,889 |
4,661 |
4,638 |
YoY |
-11.6% |
-4.7% |
-5.8% |
12.1% |
14.0% |
17.1% |
14.7% |
6.6% |
18.4% |
13.9% |
5.0% |
11.7% |
-3.3% |
-10.9% |
Composition of sales |
70.0% |
71.7% |
70.4% |
64.7% |
66.7% |
61.7% |
60.3% |
55.2% |
57.6% |
56.6% |
52.7% |
50.7% |
50.1% |
49.5% |
Domestic debugging |
2,681 |
2,846 |
2,953 |
3,054 |
2,931 |
3,030 |
3,149 |
3,011 |
3,334 |
3,561 |
3,220 |
3,720 |
3,171 |
3,169 |
YoY |
– |
– |
– |
– |
9.3% |
6.4% |
6.7% |
-1.4% |
13.7% |
17.5% |
2.2% |
8.6% |
-4.9% |
-11.0% |
Composition of sales |
52.7% |
52.4% |
51.1% |
48.1% |
48.1% |
41.0% |
40.7% |
38.0% |
39.8% |
38.8% |
34.6% |
33.9% |
34.1% |
33.8% |
Global and others |
887 |
1,050 |
1,118 |
1,054 |
1,137 |
1,536 |
1,522 |
1,366 |
1,484 |
1,640 |
1,685 |
1,620 |
1,490 |
1,468 |
YoY |
– |
– |
– |
– |
28.2% |
46.3% |
36.1% |
29.6% |
30.4% |
6.8% |
10.7% |
18.5% |
0.4% |
-10.5% |
Composition of sales |
17.4% |
19.3% |
19.3% |
16.6% |
18.7% |
20.8% |
19.7% |
17.2% |
17.7% |
17.8% |
18.1% |
16.8% |
16.0% |
15.7% |
Operating profit |
158 |
369 |
655 |
725 |
636 |
733 |
753 |
572 |
634 |
738 |
752 |
875 |
404 |
325 |
YoY |
-16.4% |
12.4% |
19.7% |
121.3% |
301.3% |
98.5% |
14.9% |
-21.1% |
-0.3% |
0.6% |
-0.2% |
52.8% |
-36.3% |
-55.9% |
Operating profit margin |
3.1% |
6.8% |
11.3% |
11.4% |
10.4% |
9.9% |
9.7% |
7.2% |
7.6% |
8.0% |
8.1% |
9.1% |
4.3% |
3.5% |
Enterprise business |
-21 |
-7 |
64 |
152 |
87 |
144 |
171 |
241 |
24 |
79 |
194 |
340 |
83 |
-48 |
YoY |
– |
– |
360.3% |
51.3% |
– |
– |
163.8% |
58.7% |
-72.0% |
-45.2% |
13.3% |
40.6% |
240.4% |
– |
Segment profit margin |
-1.4% |
-0.5% |
3.8% |
6.8% |
4.3% |
5.1% |
5.6% |
6.8% |
0.7% |
2.0% |
4.4% |
7.1% |
1.8% |
-1.0% |
Entertainment business |
517 |
700 |
936 |
923 |
930 |
975 |
978 |
783 |
1,036 |
1,155 |
1,014 |
1,008 |
844 |
774 |
YoY |
-28.9% |
-8.0% |
5.0% |
57.9% |
79.9% |
39.3% |
4.5% |
-15.2% |
11.4% |
18.5% |
3.6% |
28.8% |
-18.5% |
-33.1% |
Segment profit margin |
14.5% |
17.9% |
23.0% |
22.5% |
22.9% |
21.4% |
20.9% |
17.9% |
21.5% |
22.2% |
20.7% |
20.6% |
18.1% |
16.7% |
Note: * The provisional accounting treatment for the business consolidation was finalized in the fourth quarter of FY2023/3 and is reflected in the operating profit of the Corporate and Enterprise Business. In addition, the sub-segmentation of Enterprise Business was changed from FY2023/3. Total and overall segment totals may not match due to sales and operating profit adjustments.
Source: Omega Investment, based on company data
Financial data II
2021/3 |
2022/3 |
2023/3 |
2024/3 |
|||||||||||
Q1 |
Q2 |
Q3 |
Q4 |
Q1 |
Q2 |
Q3 |
Q4 |
Q1* |
Q2* |
Q3* |
Q4* |
Q1 |
Q2 |
|
[Statements of income] |
||||||||||||||
Net sales |
5,093 |
5,437 |
5,782 |
6,355 |
6,098 |
7,400 |
7,747 |
7,932 |
8,372 |
9,190 |
9,316 |
9,638 |
9,296 |
9,372 |
Cost of sales |
3,819 |
4,002 |
4,001 |
4,700 |
4,271 |
5,290 |
5,579 |
5,645 |
5,899 |
6,478 |
6,690 |
6,817 |
6,890 |
6,978 |
Gross profit |
1,273 |
1,437 |
1,781 |
1,655 |
1,827 |
2,109 |
2,167 |
2,287 |
2,472 |
2,713 |
2,625 |
2,820 |
2,406 |
2,394 |
SG&A expenses |
1,115 |
1,067 |
1,126 |
1,150 |
1,191 |
1,375 |
1,414 |
1,714 |
1,837 |
1,970 |
1,868 |
1,961 |
2,001 |
2,068 |
Operating profit |
158 |
369 |
655 |
725 |
636 |
733 |
753 |
572 |
634 |
738 |
752 |
875 |
404 |
325 |
Non-operating income |
38 |
10 |
24 |
5 |
38 |
31 |
12 |
30 |
5 |
150 |
78 |
-14 |
15 |
55 |
Non-operating expenses |
2 |
3 |
4 |
10 |
4 |
4 |
5 |
21 |
7 |
4 |
11 |
44 |
4 |
4 |
Ordinary profit |
194 |
376 |
675 |
720 |
670 |
760 |
759 |
582 |
632 |
889 |
824 |
800 |
415 |
377 |
Extraordinary income |
19 |
32 |
|
13 |
66 |
1 |
1 |
– |
– |
41 |
33 |
– |
– |
|
Extraordinary expenses |
82 |
13 |
16 |
415 |
2 |
42 |
32 |
35 |
– |
6 |
171 |
1,052 |
2 |
1,042 |
Net profit before income taxes |
113 |
381 |
691 |
318 |
681 |
785 |
730 |
547 |
632 |
882 |
694 |
-218 |
412 |
-665 |
Total income taxes |
38 |
122 |
224 |
145 |
189 |
281 |
233 |
35 |
198 |
306 |
216 |
418 |
79 |
108 |
Net profit attributable to owners of the parent |
99 |
256 |
438 |
180 |
487 |
429 |
445 |
415 |
413 |
533 |
450 |
-601 |
338 |
-774 |
[Balance Sheets] |
||||||||||||||
Current assets |
6,648 |
7,291 |
8,017 |
9,744 |
9,604 |
9,848 |
10,658 |
10,392 |
10,874 |
12,182 |
11,569 |
12,528 |
12,160 |
13,072 |
Cash and deposits |
3,027 |
3,482 |
4,085 |
5,076 |
4,911 |
5,435 |
5,746 |
5,208 |
5,573 |
6,850 |
5,948 |
6,456 |
6,240 |
6,997 |
Notes and accounts receivable |
2,889 |
3,099 |
3,201 |
4,097 |
||||||||||
Notes, accounts receivable andcontract assets |
4,161 |
3,872 |
4,372 |
4,411 |
4,614 |
4,672 |
4,930 |
5,377 |
5,120 |
5,414 |
||||
Non-current assets |
3,205 |
3,167 |
3,160 |
4,593 |
6,321 |
6,178 |
6,342 |
7,217 |
8,158 |
8,505 |
8,343 |
7,052 |
7,234 |
6,218 |
Tangible fixed assets |
560 |
549 |
565 |
598 |
602 |
623 |
621 |
693 |
1,067 |
1,077 |
1,100 |
1,169 |
1,259 |
1,335 |
Intangible fixed assets |
1,445 |
1,424 |
1,433 |
2,670 |
4,389 |
4,244 |
4,225 |
5,139 |
5,206 |
5,750 |
5,593 |
4,188 |
4,146 |
3,021 |
Goodwill |
1,032 |
991 |
950 |
2,467 |
4,175 |
4,042 |
3,945 |
4,588 |
4,812 |
5,301 |
5,082 |
3,468 |
3,411 |
2,423 |
Investments and other asset |
1,199 |
1,193 |
1,161 |
1,324 |
1,330 |
1,309 |
1,495 |
1,384 |
1,883 |
1,678 |
1,649 |
1,694 |
1,828 |
1,861 |
Total assets |
9,854 |
10,459 |
11,177 |
14,338 |
15,925 |
16,026 |
17,001 |
17,610 |
19,033 |
20,688 |
19,913 |
19,581 |
19,394 |
19,291 |
Current liabilities |
4,450 |
4,655 |
5,061 |
7,904 |
8,954 |
8,775 |
9,354 |
9,679 |
10,759 |
11,330 |
9.495 |
9,930 |
10,126 |
10,644 |
Short-term borrowings |
2,546 |
2,551 |
2,552 |
4,728 |
5,534 |
5,406 |
5,406 |
5,421 |
6,806 |
7,106 |
5,106 |
5,106 |
5,606 |
5,606 |
Non-current liabilities |
62 |
132 |
135 |
119 |
294 |
55 |
58 |
364 |
162 |
154 |
113 |
176 |
185 |
198 |
Long-term debt |
– |
66 |
65 |
63 |
236 |
– |
– |
169 |
– |
– |
– |
– |
– |
– |
Total liabilities |
4,513 |
4,788 |
5,196 |
8,024 |
9,249 |
8,830 |
9,413 |
10,044 |
10,921 |
11,485 |
9,608 |
10,107 |
10,311 |
10,842 |
Total net assets |
5,340 |
5,670 |
5,980 |
6,314 |
6,677 |
7,196 |
7,588 |
7,566 |
8,111 |
9,202 |
10,304 |
9,474 |
9,082 |
8,448 |
Shareholders’ equity |
4,841 |
5,172 |
5,460 |
5,642 |
5,983 |
6,436 |
6,719 |
6,774 |
7,030 |
7,779 |
8,838 |
8,283 |
8,061 |
7,310 |
Capital |
300 |
300 |
300 |
300 |
300 |
300 |
300 |
300 |
300 |
300 |
300 |
300 |
300 |
300 |
Legal capital reserve |
355 |
331 |
331 |
331 |
331 |
338 |
338 |
– |
– |
60 |
375 |
393 |
66 |
70 |
Retained earnings |
6,848 |
7,105 |
7,393 |
7,575 |
7,916 |
8,342 |
8,626 |
9,019 |
9,275 |
9,809 |
10,031 |
9,427 |
9,532 |
8,757 |
Treasury shares |
-2,662 |
-2,565 |
-2,565 |
-2,565 |
-2,565 |
-2,545 |
-2,546 |
-2,545 |
-2,545 |
-2,391 |
-1,868 |
-1,838 |
-1,838 |
-1,818 |
Stock acquisition right |
13 |
13 |
13 |
13 |
– |
– |
– |
– |
– |
10 |
6 |
6 |
– |
– |
Total liabilities and net assets |
9,854 |
10,459 |
11,177 |
14,338 |
15,925 |
16,026 |
17,001 |
17,610 |
19,033 |
20,688 |
19,913 |
19,581 |
19,394 |
19.291 |
[Statements of cash flows] |
||||||||||||||
Cash flow from operating activities |
101 |
1,416 |
1,703 |
3,077 |
1,430 |
2,850 |
1,156 |
|||||||
Net profit before taxes |
494 |
1,504 |
1,466 |
2,744 |
1,510 |
1,996 |
-252 |
|||||||
Cash flow from investing activities |
-261 |
-1,813 |
-1,682 |
-2,537 |
-1,496 |
-1,903 |
-592 |
|||||||
Cash flow from financing activities |
|
-90 |
|
1,730 |
|
316 |
-546 |
1,488 |
141 |
-200 |
||||
Free cash flow |
-160 |
-397 |
21 |
540 |
-66 |
947 |
564 |
|||||||
Net increase (decrease) in cash and cash equivalents |
-252 |
1,341 |
359 |
132 |
1,676 |
1,283 |
540 |
|||||||
Cash and cash equivalents at beginning of period |
3,704 |
3,704 |
5,041 |
5.041 |
5,173 |
5,173 |
6,454 |
|||||||
Cash and cash equivalents at end of period |
3,447 |
5,041 |
5,400 |
5,173 |
6,850 |
6,456 |
6,997 |
Note: In the fourth quarter of FY2023/3, the provisional accounting treatment for the business consolidation was finalized and reflected in operating profit in the PL. Other than this, no adjustments have been made for profits below ordinary profit, BS and CF, as they are not disclosed.
Source: Omega Investment, based on company data.
Financial data (full year basis )
FY2014/3 |
FY2015/3 |
FY2016/3 |
FY2017/3 |
FY2018/3 |
FY2019/3 |
FY2020/3 |
FY2021/3 |
FY2022/3 |
FY2023/3 |
|
[Statements of income] |
||||||||||
Net sales |
10,137 |
13,285 |
15,011 |
15,444 |
17,353 |
19,254 |
21,138 |
22,669 |
29,178 |
36,517 |
YoY (%) |
– |
31.0 |
13.0 |
2.9 |
12.4 |
11.0 |
9.8 |
7.2 |
28.7 |
25.2 |
Cost of sales |
6,653 |
9,336 |
10,690 |
10,938 |
12,394 |
13,791 |
15,566 |
16,235 |
20,787 |
25,885 |
Gross profit |
3,484 |
3,948 |
4,320 |
4,506 |
4,958 |
5,463 |
5,571 |
6,433 |
8,391 |
10,632 |
SG&A expenses |
1,703 |
2,431 |
2,356 |
2,599 |
3,222 |
3,857 |
4,177 |
4,524 |
5,695 |
7,631 |
Operating profit |
1,780 |
1,517 |
1,963 |
1,906 |
1,735 |
1,605 |
1,394 |
1,908 |
2,696 |
3,000 |
YoY (%) |
– |
14.8 |
29.4 |
-2.9 |
-9.0 |
-7.5 |
-13.2 |
36.9 |
41.3 |
11.3 |
Operating profit margin (%) |
17.6 |
11.4 |
13.1 |
12.3 |
10.0 |
8.3 |
6.6 |
8.4 |
9.2 |
8.2 |
Non-operating income |
22 |
66 |
43 |
128 |
57 |
109 |
22 |
80 |
112 |
220 |
Non-operating expenses |
15 |
57 |
49 |
37 |
10 |
63 |
44 |
13 |
34 |
68 |
Ordinary profit |
1,788 |
1,525 |
1,958 |
1,997 |
1,782 |
1,651 |
1,372 |
1,975 |
2,774 |
3,152 |
Extraordinary income |
18 |
|
9 |
17 |
2 |
733 |
|
55 |
83 |
75 |
Extraordinary expenses |
14 |
|
835 |
573 |
151 |
51 |
75 |
526 |
112 |
1,231 |
Net profit before income taxes |
1,792 |
1,525 |
1,132 |
1,441 |
1,632 |
2,333 |
1,296 |
1,504 |
2,749 |
1,996 |
Total income taxes |
700 |
975 |
734 |
641 |
503 |
745 |
499 |
530 |
739 |
1,109 |
Net profit attributable to owners of the parent |
1,087 |
539 |
361 |
795 |
1,200 |
1,575 |
792 |
974 |
1,778 |
799 |
YoY (%) |
– |
-50.4 |
-33.0 |
119.7 |
51.0 |
31.3 |
-49.7 |
23.0 |
82.7 |
-55.0 |
Net profit margin (%) |
10.7 |
4.1 |
2.4 |
5.1 |
6.9 |
8.2 |
3.7 |
4.3 |
6.1 |
2.2 |
[Supplementary data] |
||||||||||
EPS |
45.96 |
22.61 |
15.72 |
35.58 |
55.14 |
72.13 |
36.31 |
45.15 |
82.25 |
36.50 |
ROE (%) |
33.6 |
13.8 |
10.5 |
29.2 |
40.0 |
38.6 |
16.3 |
18.4 |
28.0 |
10.1 |
ROA (%) |
29.8 |
19.8 |
26.5 |
28.2 |
22.0 |
17.9 |
13.4 |
15.8 |
17.4 |
17.0 |
Dividend |
16.00 |
34.00 |
38.00 |
23.00 |
11.50 |
13.00 |
14.00 |
14.00 |
15.00 |
21.00 |
Dividend payout ratio (%) |
16.3 |
37.6 |
60.4 |
32.3 |
20.9 |
18.0 |
38.6 |
31.0 |
18.2 |
57.5 |
[Balance Sheets] |
||||||||||
Current assets |
5,549 |
5,756 |
5,064 |
6,221 |
6,732 |
7,403 |
7,453 |
9,744 |
10,392 |
12,528 |
Cash and deposits |
3,693 |
3,058 |
2,197 |
3,344 |
3,894 |
4,197 |
3,739 |
5,076 |
5,208 |
6,456 |
Notes and accounts receivable |
1,483 |
2,374 |
2,230 |
1,942 |
2,480 |
2,724 |
2,985 |
4,097 |
||
Notes, accounts receivable andcontract assets |
4,411 |
5,377 |
||||||||
Non-current assets |
1,611 |
2,516 |
1,469 |
1,430 |
1,842 |
2,428 |
6,178 |
6,342 |
7,217 |
7,052 |
Tangible fixed assets |
323 |
368 |
299 |
298 |
473 |
558 |
579 |
598 |
693 |
1,169 |
Intangible fixed assets |
695 |
1,505 |
580 |
238 |
286 |
763 |
1,379 |
2,670 |
5,139 |
4,188 |
Goodwill |
595 |
1,169 |
437 |
201 |
150 |
481 |
1,027 |
2,467 |
4,588 |
3,468 |
Investments and other assets |
592 |
642 |
589 |
893 |
1,082 |
1,107 |
1,225 |
1,324 |
1,384 |
1,694 |
Total assets |
7,160 |
8,272 |
6,533 |
7,651 |
8,575 |
9,832 |
10,637 |
14,338 |
17,610 |
19,581 |
Current liabilities |
3,372 |
3,823 |
3,374 |
3,759 |
3,929 |
4,192 |
5,134 |
7,904 |
9,679 |
9,930 |
Short-term borrowings |
1,610 |
1,603 |
1,299 |
1,630 |
1,600 |
1,704 |
2,546 |
4,728 |
5,421 |
5,106 |
Non-current liabilities |
20 |
280 |
69 |
1,033 |
1,075 |
627 |
63 |
119 |
364 |
176 |
Long-term debt |
12 |
216 |
46 |
2 |
– |
50 |
– |
63 |
169 |
– |
Total liabilities |
3,393 |
4,104 |
3,444 |
4,793 |
5,005 |
4,819 |
5,198 |
8,024 |
10,044 |
10,107 |
Total net assets |
3,766 |
4,168 |
3,089 |
2,858 |
3,570 |
5,012 |
5,438 |
6,314 |
7,566 |
9,474 |
Shareholders’ equity |
3,687 |
4,036 |
2,773 |
2,590 |
3,340 |
4,763 |
4,898 |
5,642 |
6,774 |
8,283 |
Capital |
300 |
300 |
300 |
300 |
300 |
300 |
300 |
300 |
300 |
300 |
Legal capital reserve |
300 |
300 |
368 |
277 |
331 |
366 |
355 |
331 |
– |
393 |
Retained earnings |
3,086 |
3,435 |
3,604 |
4,164 |
5,113 |
6,408 |
6,904 |
7,575 |
9,019 |
9,427 |
Treasury shares |
0 |
0 |
-1,499 |
-2,152 |
-2,405 |
-2,311 |
-2,662 |
-2,565 |
-2,545 |
-1,838 |
Stock acquisition right |
|
14 |
14 |
|
|
13 |
13 |
13 |
– |
6 |
Total liabilities and net assets |
7,160 |
8,272 |
6,533 |
7,651 |
8,575 |
9,832 |
10,637 |
14,338 |
17,610 |
19,581 |
Equity Ratio (%) |
51.9 |
49.5 |
43.1 |
34.4 |
39.3 |
48.7 |
46.3 |
39.7 |
39.7 |
45.0 |
BPS |
155.63 |
171.30 |
125.80 |
119.96 |
154.61 |
219.06 |
228.62 |
263.32 |
323.21 |
395.65 |
[Statements of cash flows] |
||||||||||
Cash flow from operating activities |
1,561 |
870 |
1,080 |
1,825 |
1,436 |
889 |
1,086 |
1,416 |
3,077 |
2,850 |
Net profit before taxes |
1,792 |
1,525 |
1,132 |
1,441 |
1,632 |
2,333 |
1,296 |
1,504 |
2,744 |
1,996 |
Cash flow from investing activities |
-368 |
-568 |
-17 |
-610 |
-618 |
62 |
-1,018 |
-1,813 |
-2,537 |
-1,903 |
Cash flow from financing activities |
308 |
-950 |
-1,913 |
-69 |
-250 |
-693 |
-515 |
1,730 |
-546 |
141 |
Free cash flow |
1,193 |
302 |
1,063 |
1,215 |
818 |
951 |
68 |
-397 |
540 |
947 |
Cash and cash equivalents at end of period |
1,508 |
-634 |
-860 |
1,146 |
564 |
258 |
-458 |
1,341 |
132 |
1,283 |
Cash and cash equivalents at beginning of period |
2,184 |
3,693 |
3,058 |
2,197 |
3,344 |
3,894 |
4,162 |
3,704 |
5,041 |
5,173 |
Cash and cash equivalents at end of period |
3,693 |
3,058 |
2,197 |
3,344 |
3,894 |
4,162 |
3,704 |
5,041 |
5,173 |
6,456 |
Note: In Q4 of FY03/2023, the provisional accounting treatment for the business combination was finalized and reflected in the operating income on the financial statements. No revisions have been made for ordinary income and below, BS, and CF, as they are not disclosed.
Source: Omega Investment, based on company data.