2026-04-02
Home
Japanese

Omega Investment Co., Ltd.
Sportsfield (Company note – 1Q update)

| Share price (6/17) | ¥791 | Dividend Yield (24/12 CE) | 2.4 % |
| 52weeks high/low | ¥947/603 | ROE(23/12 act) | 56.1 % |
| Avg Vol (3 month) | 20 thou shrs | Operating margin (23/12) | 25.4 % |
| Market Cap | ¥5.8 bn | Beta (5Y Monthly) | N/A |
| Enterprise Value | ¥4.1 bn | Shares Outstanding | 7.36 mn shrs |
| PER (24/12 CE) | 8.2 X | Listed market | TSE Growth |
| PBR (23/12 act) | 4.2 X |
| Click here for the PDF version of this page |
| PDF Version |
1Q financial results for FY12/2024 continue to show high growth. Record highs in both sales and profits
◇ Results for 1Q FY12/2024: continued high growth.
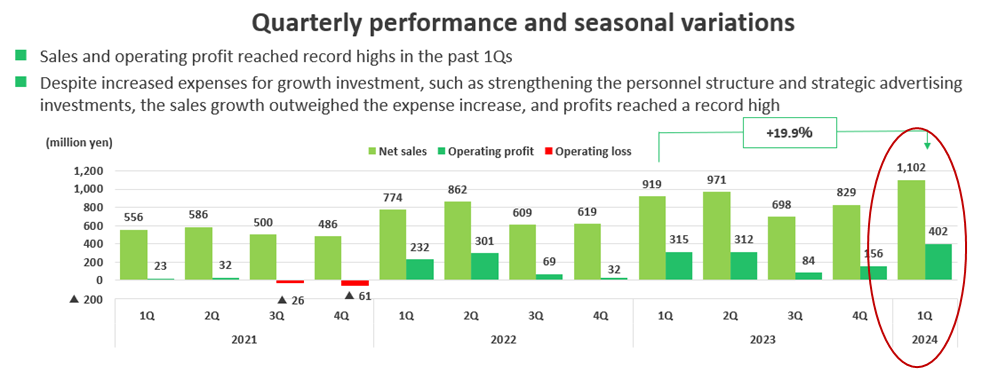
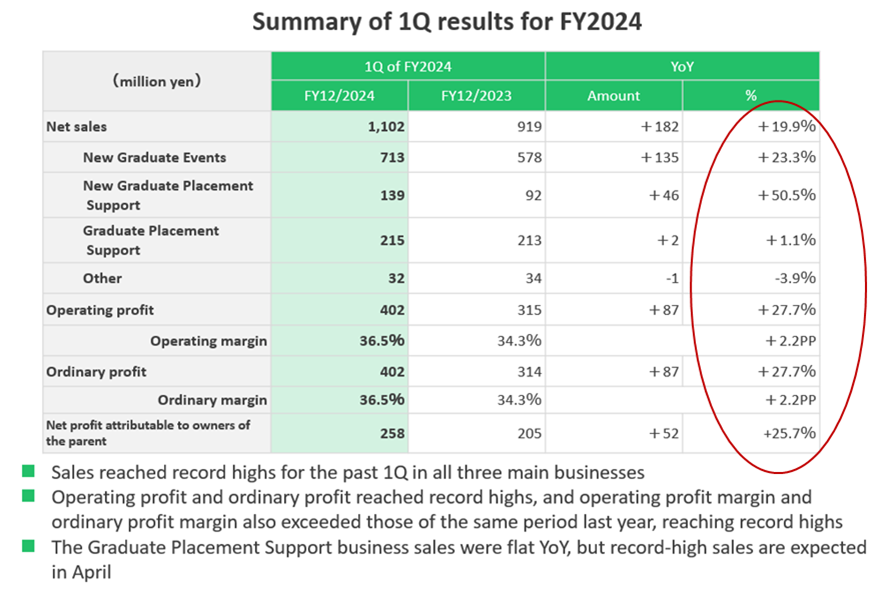
Sportsfield’s 1Q FY12/2024 results, announced after the close on 13 May 2024, continued to show positive results. Net sales were 1.1 billion yen (+19% YoY), operating profit was 0.4 billion yen (+27% YoY), ordinary profit was 0.4 billion yen (+27% YoY), and net profit attributable to owner of the parent was 0.25 billion yen (+25% YoY). Sales, operating profit, ordinary profit and net profit attributable to owner of parent all reached record highs. All three main businesses have increased their sales and delivered high profit growth while implementing measures such as increasing personnel and strengthening advertising. This indicates that demand for human capital, particularly amongst new graduates, is strong, and the company is capturing this well into its business.
The progress ratio against the company’s full-year forecasts is high: 29% for sales and around 44% each for operating profit, ordinary profit, and net profit attributable to owner of parent.
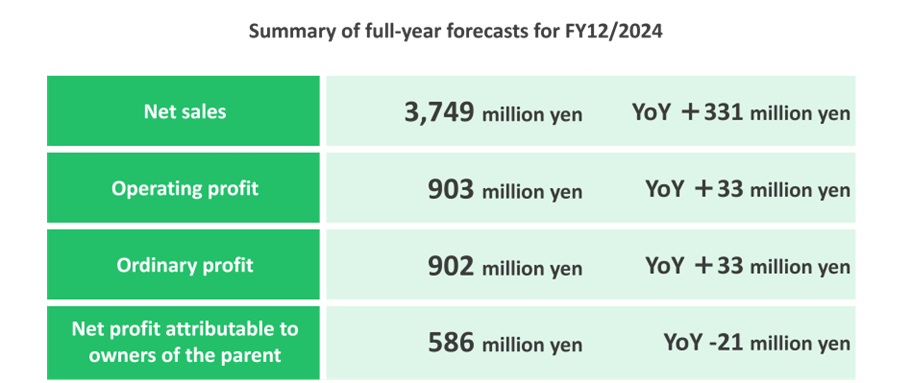
◇ FY12/2024 company forecasts: no change.
The company does not disclose forecasts for the first two quarters. The company has maintained the full-year forecast announced at the beginning of the fiscal year, although the 1Q progress ratio is high.
The year-end dividend per share is set at 16 yen, considering the stock split at the end of March 2024, and remains unchanged.
KPIs are discussed below, and they are generally running on track.
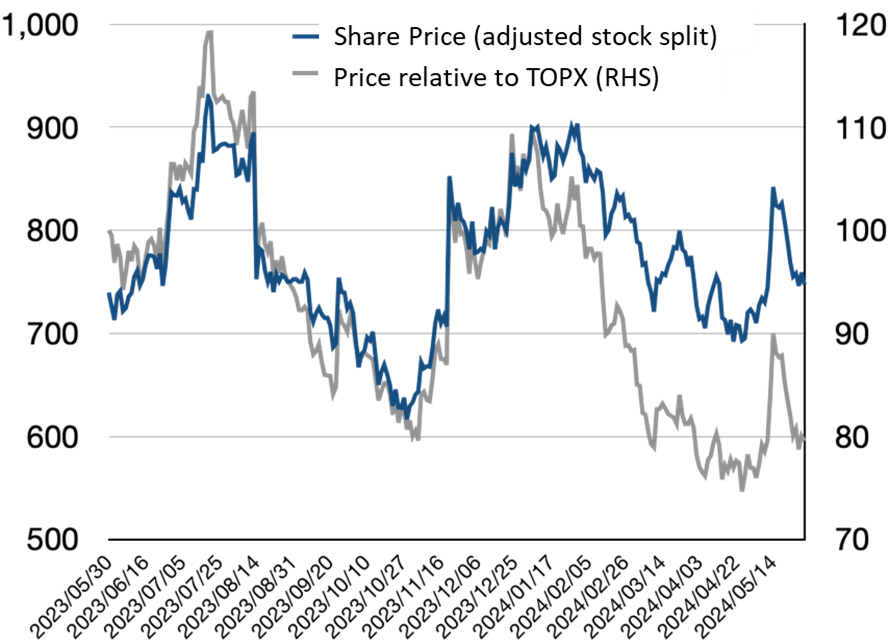
◇ Share price and future highlights:
The share price, which had been in the low 600s to mid-700s yen in April, rose to 850s on positive 1Q results. However, it failed to reach the 52-week high of 947 yen and has since been slowly falling back to the low 700s. However, it has not fallen below the April low (i.e., the low since the beginning of the year).
This can be understood as the stock market appreciating the good 1Q results and the start of the dividend from March 2024 but awaiting upward revisions to full-year results and catalysts on medium-term growth potential.
Given the seasonality of the company’s performance, the forthcoming 2Q results will bring more certainty about the full-year earnings, and from around 3Q, the order stream, which will determine the performance of the next financial year, will become clear. If the company’s earnings potential for the current financial year and the direction of its medium-term management plan for the next financial year and beyond become visible, there should be considerable scope for a re-valuation of the forecast PER, which is currently below 10x. In that case, the 52-week high of 947 yen and the all-time high of 1,098.75 yen would interest investors.
The outlook and plans for the company’s stage-up from the TSE Growth Market to the Prime Market are also interesting.
Table of contents
| Summary | 1 |
| Key financial data | 2 |
| Financial results for 1Q of FY2024 | 3 |
| Company forecasts for FY12/2024 | 10 |
| Share price and future highlights | 11 |
| Financial results | 12 |
| Useful information | 14 |
Key financial data
| Fiscal Year | 2017/12 | 2018/12 | 2019/12 | 2020/12 | 2021/12 | 2022/12 | 2023/12 | |
| Net sales | 1,106,727 | 1,516,370 | 1,917,813 | 1,883,269 | 2,130,256 | 2,866,214 | 3,418,218 | |
| Ordinary profit | 60,171 | 113,916 | 192,045 | 32,016 | -35,298 | 634,239 | 869,134 | |
| Net income | 41,031 | 72,809 | 132,965 | 17,055 | -79,133 | 412,318 | 608,172 | |
| Capital stock | 10,300 | 10,300 | 92,680 | 92,712 | 92,869 | 93,079 | 93,513 | |
| Total number of shares issued |
Ordinary shares (shares) Class A shares (shares) |
20,000 400 |
20,400 – |
881,600 – |
882,560 – |
897,400 – |
1,808,080 – |
3,681,440 – |
| Net asset | 59,396 | 132,205 | 429,932 | 446,826 | 368,007 | 780,524 | 1,389,498 | |
| Total asset | 418,961 | 735,377 | 1,106,275 | 1,488,182 | 1,540,544 | 2,127,327 | 2,310,947 | |
| Book value per share*1 (Yen) | 9.10 | 20.25 | 60.96 | 63.29 | 51.27 | 107.94 | 188.74 | |
| EPS*1 (Yen) | 6.29 | 11.16 | 20.34 | 2.42 | -11.10 | 57.22 | 83.73 | |
| Equity to asset (%) | 14.2 | 18.0 | 38.9 | 30.0 | 23.9 | 36.7 | 60.1 | |
| ROE (%) | 100.6 | 76.0 | 47.3 | 3.9 | -19.4 | 71.8 | 56.1 | |
| Cash flow from operating activities | 108,208 | 82,994 | 198,181 | -88,974 | 53,789 | 609,537 | 448,887 | |
| Cash flow from investing activities | -32,962 | -75,085 | -24,984 | -32,077 | -67,943 | -7,100 | -68,115 | |
| Cash flow from financing activities | -82,366 | 191,526 | 149,891 | 396,399 | 18,139 | -120,077 | -371,385 | |
| Cash and cash equivalents at end of period | 163,792 | 363,227 | 686,315 | 961,663 | 965,648 | 1,448,007 | 1,457,392 | |
| Number of employees | 118 | 164 | 201 | 233 | 266 | 242 | 272 | |
*1: A 40-for-1 split of ordinary shares was carried out on 4 October 2019, a 2-for-1 split of ordinary shares on 1 July 2022, 1 April 2023 and 1 April 2024. Book value per share and EPS in the table are calculated assuming such splits were carried out at the beginning of the year ended 31 December 2017.
(Unit: Thousand yen)
Source: company materials
Financial results for 1Q of FY2024
Sportsfield’s 1Q FY12/2024 (Jan-Mar) results, announced after the close on 13 May 2024, continued to be positive.
Net sales were 1.1 billion (+19% YoY), operating profit was 0.4 billion (+27% YoY), ordinary profit was 0.4 billion (+27% YoY), and net profit attributable to owner of the parent was 0.25 billion (+25% YoY). Sales, operating profit, ordinary profit and net profit attributable to owner of parent all reached record highs. All three main businesses have seen their sales increase and achieved high profit growth while implementing measures such as headcount increase and bolstering advertising. This points to a strong demand for human capital, particularly amongst new graduates, and the company is very well turning this into its business.
The progress ratio against the company’s full-year forecasts is high: 29% for sales and around 44% each for operating profit, ordinary profit, and net profit attributable to owner of parent.
Source: company materials
Source: company materials
New Graduate Events Business
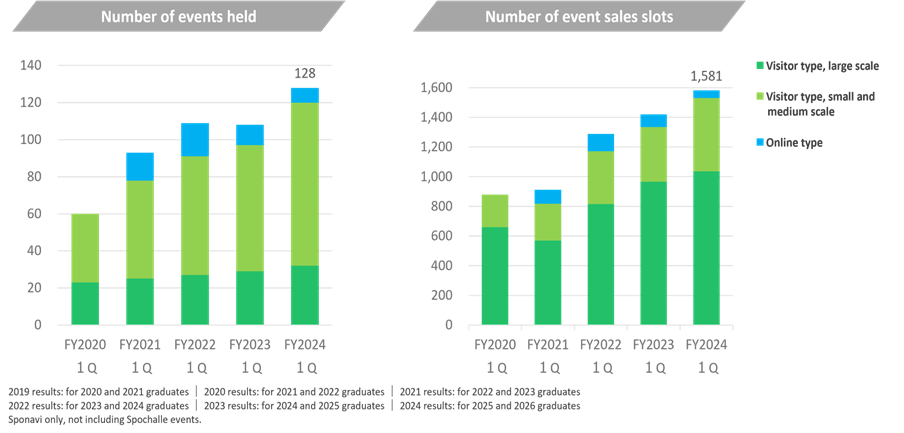
1Q FY12/2024 sales were 710 million yen (+23% YoY). The number of events held and event sales slots were higher YoY due to strong corporate demand for event stalls. In particular, the number of visitor events is growing.
Source: company materials
It should be noted that orders for the event business for March 2026 graduates are expected to begin substantially in 2Q. This is a leading indicator of the direction of performance from the end of the current financial year into the following year, and company disclosure from 2Q onwards will be of interest.
New Graduate Placement Support
1Q FY12/2024 sales were strong at 139 million yen (YoY +50%).
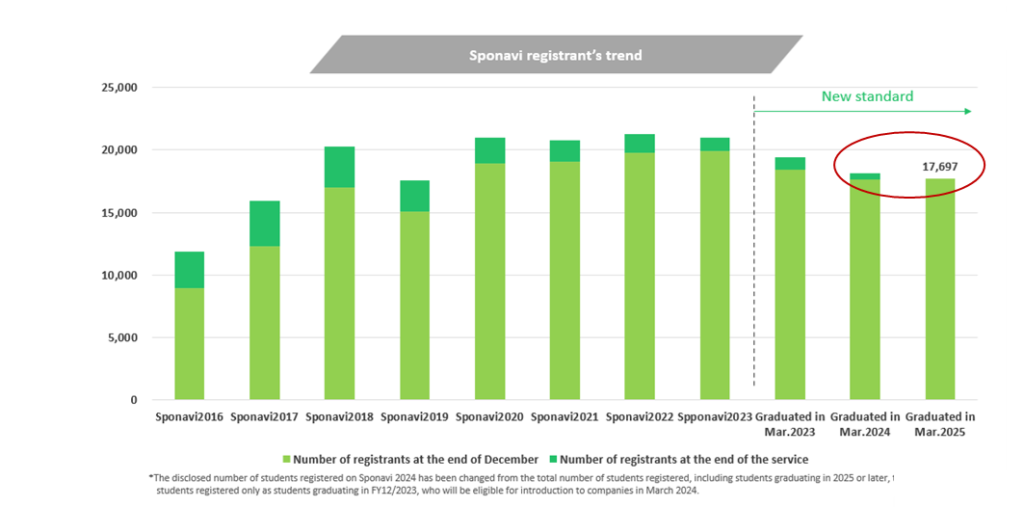
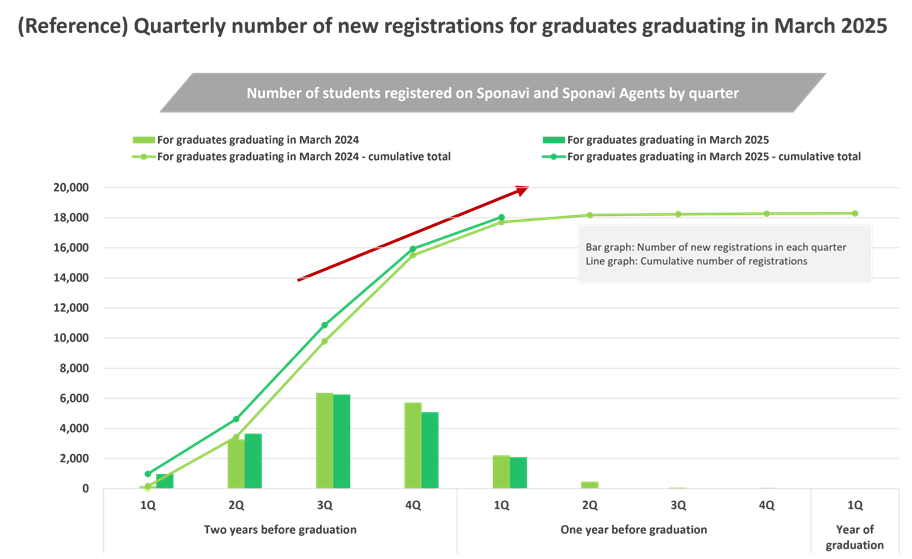
Firstly, the number of students registered on Sponavi (number of student-athletes registered), which serves as the population for business activities, has remained flat, with the number of students graduating in March 2025 slightly higher YoY than those graduating in March 2024. In response, the company has strengthened its staffing structure and is working to re-expand the number of registrations.
Source: company materials
Source: company materials
New Graduate Placement Support
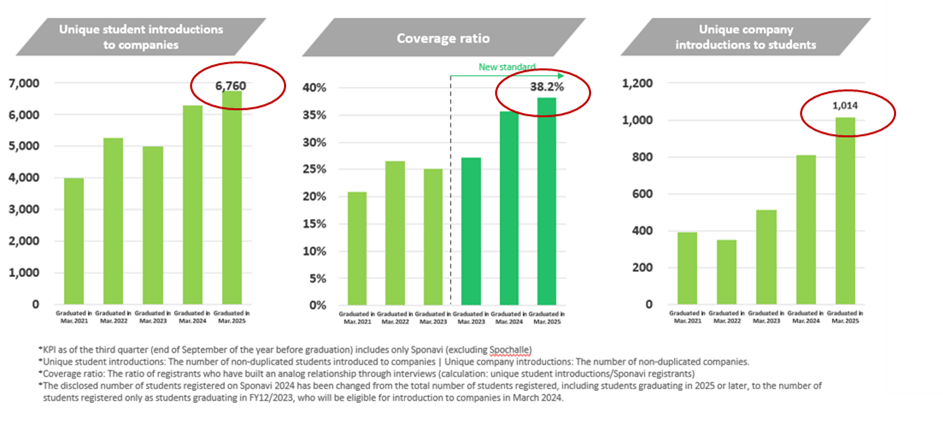
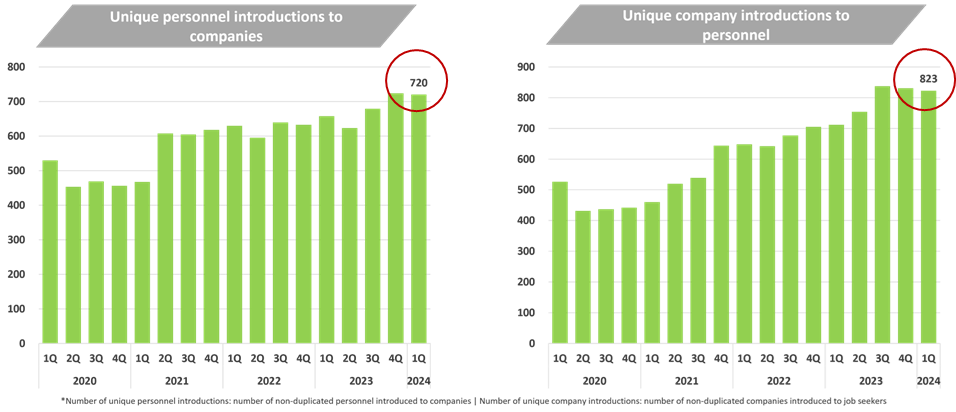
Next, the KPIs linked to sales have remained steady, indicating that the company is promoting solid sales support to its registrants.
Firstly, the number of unique student introductions for students graduating in March 2025 increased YoY in response to earlier recruitment and placement activities.
Next, the (sales) coverage ratio of Sponavi registrants with whom the company has established an analogue relationship has also improved YoY.
Furthermore, the number of unique company introductions increased YoY due to solid graduate recruitment needs.
Source: company materials
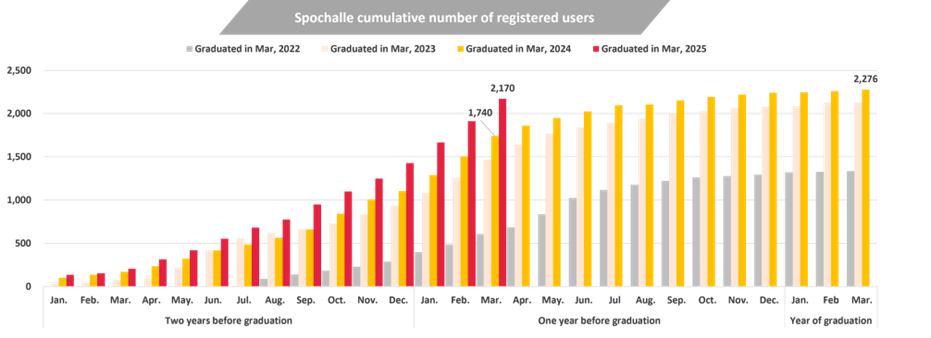
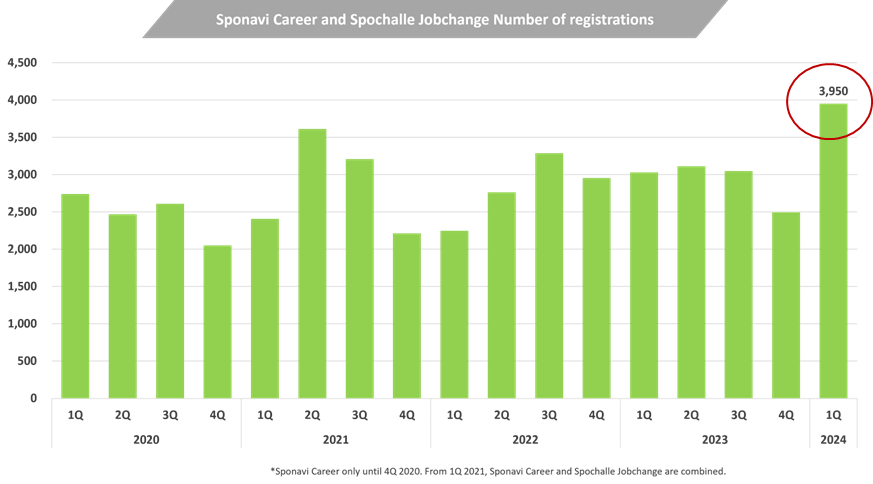
As a result of these activities, the company has achieved a significant increase in revenue since 1Q. In addition, Spochalle, which targets people with sports experience, has also steadily increased the number of registrations, contributing to revenue growth.
Going forward, we expect sales to build up without a break from 2Q to 3Q, reflecting companies’ strong desire to recruit, so we will keep a close eye on the company.
Source: company materials
New Graduate Placement Support
Source: company materials
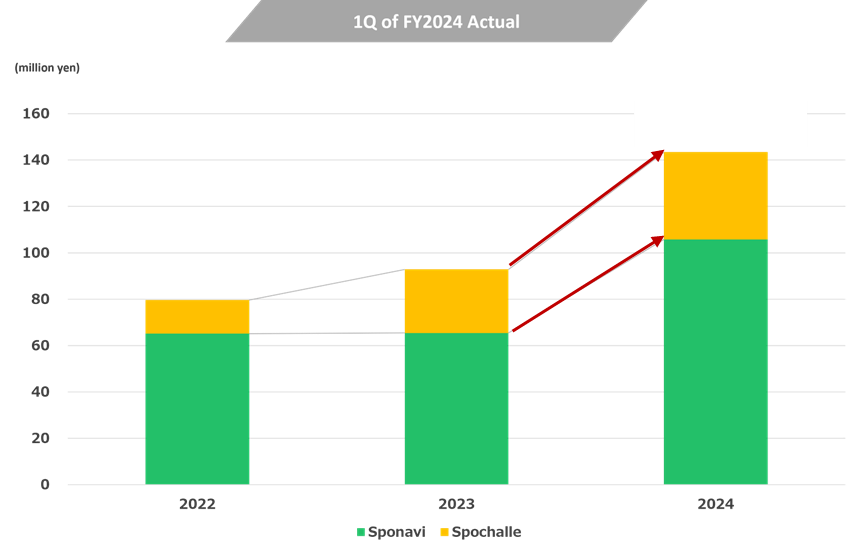
Graduate Placement Support
Sales in 1Q FY12/2024 increased slightly to 215 million yen (+1% YoY). However, the leading indicators, the number of unique human resources and unique company introductions, increased YoY. According to the company’s briefing material on the financial results, sales in April, part of 2Q, will be the highest ever, so the business is doing well.
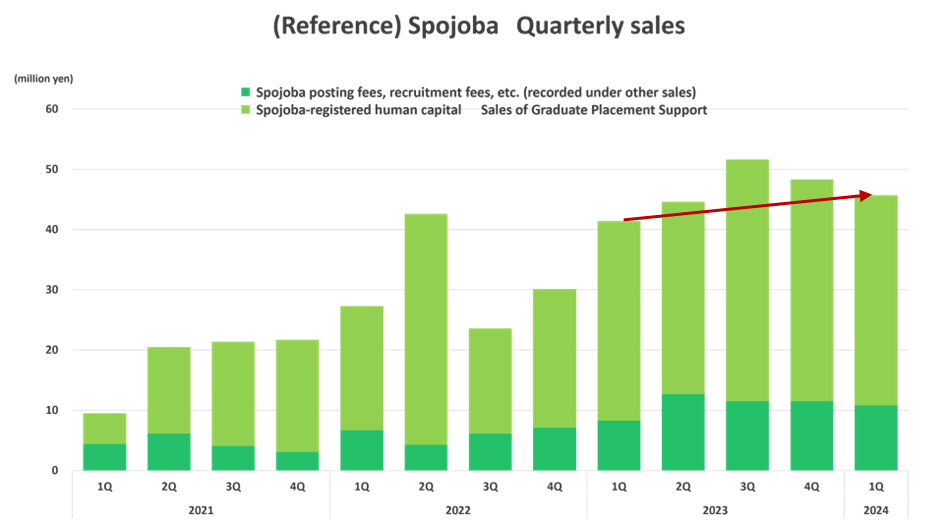
The increase in human resource referrals from Spojoba, a job placement and career change information website specialising in sports-related companies, has also increased the number of referrals.
Source: company materials
Source: company materials
Source: company materials
Company forecasts for FY12/2024
FY12/2024 company forecast: unchanged
The 1Q progress ratio against the full-year company forecast is high, at 29% for revenue and around 44% each for operating profit, ordinary profit and net profit attributable to owner of the parent.
However, the forecasts at the beginning of the year remain unchanged (the company does not disclose 2Q forecasts). The year-end dividend per share is set at 16 yen, considering the stock split at the end of March 2024, and remains unchanged.
As we have seen earlier, KPIs have remained strong, and it will be interesting to see whether results from 2Q onwards will suggest that the company will beat its full-year forecasts.
Source: company materials
Share price and future highlights
The share price, which had been in the low 600s to mid-700s in April, rose to 850s on positive 1Q results but failed to reach the 52-week high of 947 yen and has since been slowly falling back to the low 700s. However, it has yet to fall below the April low (i.e. the lowest price since the beginning of the year).
This can be understood as the stock market appreciating the good 1Q results and the start of the dividend from March 2024 but awaiting upward revisions to full-year results and catalysts on medium-term growth potential.
Given the seasonality of the company’s performance, the forthcoming 2Q results will bring more certainty about the full-year earnings, and from around 3Q, the order stream, which will determine the performance of the next financial year, will become clear. If the company’s earnings potential for the current financial year and the direction of its medium-term management plan for the next financial year and beyond become visible, there should be considerable scope for a re-valuation of the forecast PER, which is currently below 10x. In that case, the 52-week high of 947 yen and the all-time high of 1,098.75 yen would be of interest.
The outlook and plans for the company’s stage-up from the TSE Growth Market to the Prime Market are also interesting.
Financial results
Full-year financial results
Financial period |
FY12/2019 |
FY12/2020 |
FY12/2021 |
FY12/2022 |
FY12/2023 |
FY12/2024 |
Consolidated, Japanese GAAP |
(IPO) |
Company
|
||||
[Statements of income] |
||||||
Net sales |
1,918 |
1,883 |
2,130 |
2,866 |
3,418 |
3,749 |
Operating profit |
194 |
16 |
-32 |
637 |
869 |
903 |
Ordinary profit |
192 |
32 |
-35 |
634 |
869 |
902 |
Net profit before income taxes |
192 |
32 |
-81 |
634 |
869 |
|
Net profit attributable to owners of the parent |
133 |
17 |
-79 |
412 |
608 |
586 |
[Balance Sheets] |
||||||
Total assets |
1,106 |
1,488 |
1,541 |
2,127 |
2,311 |
|
Total liabilities |
676 |
1,041 |
1,173 |
1,347 |
921 |
|
Total net assets |
430 |
447 |
368 |
781 |
1,389 |
|
Total borrowings |
334 |
731 |
749 |
630 |
259 |
|
[Statements of cash flows] |
||||||
Cash flow from operating activities |
198 |
-89 |
54 |
610 |
449 |
|
Cash flow from investing activities |
-25 |
-32 |
-68 |
-7 |
-68 |
|
Cash flow from financing activities |
150 |
396 |
18 |
-120 |
-371 |
|
Free cash flow |
173 |
-121 |
-14 |
602 |
381 |
|
Cash and cash equivalents at end of period |
686 |
962 |
966 |
1,448 |
1,457 |
|
[Efficiency] |
||||||
Ratio of ordinary profit to sales |
10.0% |
1.7% |
-1.7% |
22.1% |
25.4% |
24.1% |
ROA |
14.4% |
1.3% |
-5.2% |
22.5% |
27.4% |
|
ROE |
47.3% |
3.9% |
-19.4% |
71.8% |
56.0% |
|
[Per-share] Unit : Yen |
||||||
EPS (Adjusted for stock splits, etc.) |
41 |
5 |
-22 |
114 |
167 |
162 |
BPS (Adjusted for stock splits, etc.) |
122 |
127 |
103 |
216 |
377 |
|
DPS (Adjusted for stock splits, etc.) |
0 |
0 |
0 |
0 |
33 |
32 |
[Number of employees] |
||||||
Number of consolidated employees |
201 |
233 |
266 |
242 |
272 |
Source: Omega Investment from company materials.
The per-share indicators EPS and BPS are adjusted for the 1:2 share split carried out in March 2023.
A 1:2 share split is planned for the end of March 2024, which is not reflected in the EPS, BPS, and DPS above.
Quarterly results
2022
|
2022
|
2022
|
2022
|
2023
|
2023
|
2023
|
2023
|
2024
|
|
Net sales |
774 |
862 |
609 |
619 |
919 |
971 |
698 |
829 |
1,102 |
New Graduate Events |
507 |
267 |
61 |
292 |
578 |
267 |
64 |
455 |
713 |
New Graduate Placement support |
79 |
290 |
354 |
119 |
92 |
426 |
396 |
115 |
139 |
Graduate Placement Support |
158 |
277 |
164 |
176 |
213 |
247 |
204 |
228 |
215 |
Other |
28 |
26 |
29 |
31 |
34 |
30 |
32 |
30 |
32 |
Operating profit |
232 |
301 |
69 |
32 |
315 |
312 |
84 |
156 |
402 |
Ordinary profit |
231 |
301 |
68 |
31 |
314 |
312 |
84 |
156 |
402 |
Net profit attributable to owners of
|
148 |
196 |
45 |
23 |
205 |
202 |
53 |
148 |
258 |
Source: Omega Investment from company materials.
Useful information