2026-07-09
Home
Japanese

Omega Investment Co., Ltd.
Ricksoft (Investment Report – 1Q update)
| Share price (8/7) | ¥882 | Dividend Yield (26/2 CE) | 0.0 % |
| 52weeks high/low | ¥738/1,550 | ROE(25/2 act) | 12.3% |
| Avg Vol (3 month) | 6.2 thou shrs | Operating margin (TTM) | 5.1 % |
| Market Cap | ¥4.01 bn | Beta (5Y Monthly) | -0.01 |
| Enterprise Value | ¥0.61 bn | Shares Outstanding | 4.550 mn shrs |
| PER (26/2 CE) | 12.5 X | Listed market | TSE Growth |
| PBR (25/2 act) | 1.3 X |
| Click here for the PDF version of this page |
| PDF version |
A phase of structural transformation driven by cloud integration and contract balance; profit contraction as groundwork for renewed acceleration
◇ FY2/2026 Q1 financial highlights: Revenue reached a record high, while profitability temporarily declined; the increase in contract liabilities highlights a forward-looking investment posture.
Ricksoft Co., Ltd. (hereinafter referred to as “Ricksoft”) recorded consolidated net sales of 2,872 million yen (+40.3% YoY) in the first quarter of FY2/2026 (March–May 2025), achieving significant revenue growth. However, operating profit was 129 million yen (-11.9% YoY), ordinary profit was 97 million yen (-36.9% YoY), and net income attributable to owners of the parent was 74 million yen (-35.5% YoY), resulting in a profit decline.
On the revenue side, the core Technology Solutions segment grew significantly to 2,355 million yen (+41.5% YoY), and Professional Services reached 335 million yen (+73.1% YoY), reflecting the success of the sales division’s cross-selling and upselling strategies under a robust demand environment. Contract expansions among enterprise clients were particularly notable, and the low churn rate and rising LTV underscore the strengthening of the Company’s earnings base.
On the other hand, profits temporarily declined. Gross profit increased slightly to 625 million yen (+1.3% YoY), but gross profit margin declined 8.4pt to 21.8% from 30.2% in the same quarter last year. The main factor behind this margin decline is a change in sales composition. Starting in Q2 of the previous fiscal year, the Company revised its service structure and began selling support services separately, which had previously been included in license sales. The limited growth in support service revenue compared to license revenue was the primary reason. Another contributing factor was the slight decline in revenue from in-house products, a high-value-added domain.
Selling, general, and administrative expenses were well-controlled at 495 million yen (+5.4% YoY), with the SG&A ratio improving to 17.2% from 23.0% a year earlier. However, this was not enough to offset the decline in gross profit margin, resulting in a year-on-year decrease in operating profit. Furthermore, factors such as foreign exchange effects and some valuation losses were observed below the operating line, contributing to the decline in quarterly net income.
However, forward-looking indicators for future earnings were favorable. Notably, contract liabilities increased by approximately 1 billion yen from 2.3 billion yen at the end of the previous fiscal year to 3.3 billion yen. As unrealized revenue that will be recorded as sales in the future, this provides medium- to long-term support for performance. Financial stability also remains intact, with total assets reaching 7,365 million yen (+10.3% YoY) and an equity ratio of 42.0%.
Given the current phase of growth investment, the Company’s strategy to tolerate a temporary decline in profit margin can be viewed as a strategic decision. Alongside the advancement of the “Reignite 2030” structural reform, the accumulation of backlogs and the strengthening of the recurring revenue model are expected to lead to mid-term profit improvement.
Although the structure of higher sales and lower profits may appear negative at first glance, the steady accumulation of contract liabilities and the move toward higher value-added services are steadily progressing. The current decline in profit margin is within an acceptable range and should be regarded not as front-loading of earnings, but as an “accumulation of earnings.”
◇ Segment analysis: Progress in diversification of the earnings structure; core growth driven by synergistic expansion of Technology Solutions and Professional Services
Ricksoft’s earnings structure is organized into three service categories: “Technology Solutions,” “Professional Services,” and “In-house Products.”
An overview of each segment and its revenue composition is as follows (figures in parentheses indicate revenue share and YoY change):
•Technology Solutions (82.0%, +41.5%)
This segment includes license provision centered on Atlassian products, cloud migration support, and assistance in implementing AI and RPA. It is the Company’s core business, with Q1 FY2/2026 revenue of 2,355 million yen. Cross-selling and upselling initiatives proved effective, leading to an expansion in implementation projects, particularly among enterprise clients. The foundation is being established for this to become a source of recurring revenue going forward.
•Professional Services (11.7%, +73.1%)
Characterized by support that goes beyond simple IT implementation assistance, this segment includes business process design and post-deployment utilization support. It consists of multiple elements such as SI services, paid training, and managed services. Revenue nearly doubled YoY to 335 million yen. The need for hands-on, post-implementation support is growing, and the Company is increasingly positioned as an IT consultant.
•In-house Products (6.3%, -3.4%)
This segment comprises internally developed business support tools, platforms, and AI-enabled products. Revenue declined YoY to 181 million yen, as the Company continues to pursue selection and concentration of new development projects. While its current contribution to revenue is limited, this segment holds future growth potential through integration with existing services and strengthened partner-based sales.
With this structure, Technology Solutions and Professional Services together accounted for a full 94% of the 2,872 million yen in revenue in Q1 FY2/2026, driving the Company’s revenue growth. Notably, cross-selling-based sales have taken root, and transaction value per client has been increasing.
Although In-house Products posted a slight decline on a quarterly basis, it achieved rapid growth of 27% in the previous fiscal year and 29% the year before that. Given its high profitability as a high-value-added offering, the Company intends to continue focusing on this area. Overall, while the license business remains the nucleus, Professional Services—offering both recurring characteristics and specialized expertise—is emerging as the next growth driver.
◇ Earnings forecast: Focus on progress in the mid-term plan and “transformation of the revenue model”; signs of enhanced recurring revenue emerging from growth in contract liabilities
Ricksoft’s full-year earnings forecast for FY2/2026 calls for net sales of 10.168 billion yen (+12.4% YoY), operating profit of 411 million yen (-10.3% YoY), ordinary profit of 411 million yen (-10.9% YoY), and net income of 315 million yen (-11.1% YoY), representing higher revenue but lower profit. While the top line is growing steadily, the Company is in a structural transformation phase in which it deliberately tolerates a decline in profits.
Behind this lies the full-scale rollout of the medium-term management initiative “Reignite 2030.” The core of this initiative is the structural reform of the business model to provide customer-specific added value, and the redesign of the revenue model is underway. The accumulation of contract liabilities is indeed a positive indicator of future recurring revenue streams and is viewed favorably. However, most of these contract liabilities consist of license (Technology Solutions) revenue. Since “Reignite 2030” is focused on transforming the business model to deliver customer-specific added value, its main thrust is how to grow Professional Services. Thus, there is no direct causal relationship between contract liabilities and revenue model redesign.
In terms of revenue composition, Technology Solutions remains the mainstay, but in terms of profits, the expansion of Professional Services and In-house Products is playing an increasingly important role. In particular, the proportion of high-value-added projects involving post-implementation adoption support and operational support for business transformation is increasing, and these are expected to contribute to higher unit prices and improved profit margins.
The primary reason for the decline in profit is a decrease in gross profit. Since Q2 of the previous fiscal year, the Company has revised its service structure and started selling support services separately, which had previously been included in license sales. However, support service revenue has not grown as much as license revenue, resulting in lower gross profit.
At the same time, the current market environment is favorable. Corporate demand for DX remains robust, and there is rapid growth in demand for integration with generative AI and RPA, in addition to Atlassian’s product offerings. In response, the Company’s Professional Services are increasingly functioning as an integrated solution provider, with both project quality and unit prices trending upward.
From an analyst’s perspective, the current period is viewed as a “financial adjustment phase.” However, the 3.3 billion yen in contract liabilities is seen as a “pre-recognition of future cash flow,” and considering the Company’s cash-generating capability and ROIC level (above 11%), the prevailing view is that the profit decline is temporary. With the current PER around 12x and PBR at 1.2x, there remains ample room for revaluation once profit growth becomes more apparent.
While the Company may be in a financial holding pattern, the strength of its foundation is visible in the growth of contract liabilities and progress in its mid-term plan. Rather than a simple downturn in earnings, the current situation should be viewed as a “strategic decline in profit” that serves as a bridge to a profit recovery phase.
◇ Stock price trends and future focus: Contract backlog, joint venture, and executive compensation system as valuation factors; toward a reversal phase, aligning technicals and fundamentals
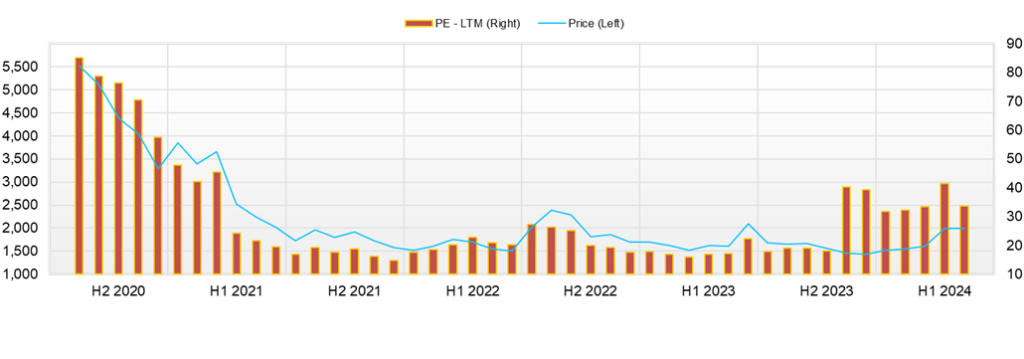
Starting from the lowest point of 738 yen on April 7, 2025, Ricksoft’s stock has shown a steady rebound trend over the past three months. It recovered to 819 yen at the end of April, 796 yen at the end of May, and 815 yen at the end of June, reaching 846 yen as of mid-July (as of July 18). This represents an increase of approximately +15% during the period, with earnings expectations in the Company’s primary sector and technical indicators aligning.
During this period, clear positive disclosures were limited. However, the Q1 financial results announced in July included the increase in contract liabilities (from approximately 2.3 billion yen to 3.3 billion yen), which has been positively received as a factor supporting future earnings. Despite the trade-off with profit decline, some investors shifted their focus toward the “future-oriented nature of earnings,” which helped support the stock’s lower bound.
In addition, the establishment of the joint venture “Altar Design Consulting, Inc. (ADC)” announced on July 2, 2025, has drawn attention as part of the Company’s growth strategy. The Company co-founded ADC with BlueMeme, High Availability Systems, and Serverworks Capital as a management support firm aimed at promoting “human-centered organization building in the AI era.” ADC will provide services such as low-code development, AI-based decision support, autonomous organizational design, and regional DX support. It is expected to contribute to the expansion of Ricksoft’s Professional Services domain and enhance its brand value.
Amid these developments, on May 29, 2025, the Company resolved to grant 20,000 shares (total value equivalent to 15.84 million yen) of restricted stock units (RSUs) to three directors without consideration. The disposal price was 792 yen per share, matching the closing price as of May 28. Rather than a short-term shareholder return measure, this is viewed as an enhancement of the mid-to-long-term performance-linked incentive system and was positively received in the market as a sign of alignment between management’s performance orientation and shareholder interests. It is also regarded as a proactive step in human capital management and corporate governance, and its alignment with ESG and the medium-term management plan is highly rated.
From a technical standpoint, the 25-day moving average (around 815 yen) and 75-day moving average (around 820 yen) served as support levels during April–May. The stock price has since remained above these averages. The 14-day RSI has shifted from the neutral zone of 30–60 toward the buy-side, and the stochastic %D is in the upper neutral range. The Bollinger Bands are steadily trending within the +1σ to +2σ range, indicating a typical pattern of upward trend formation.
Market sentiment has shifted since April, moving away from a “wait-and-see” stance toward appreciating forward-looking indicators such as contract backlog, the establishment of the joint venture, and the introduction of RSUs. However, the current stock price remains undervalued, with a PER around 12x and a PBR of approximately 1.22x. Considering capital efficiency metrics such as ROE of 12.3% and ROIC of 11.4%, there remains considerable room for upward revaluation.
Future focal points and conditions for an overweight assessment can be summarized as follows. First, key indicators will be the continued increase in contract liabilities and concrete improvement in profit margins in the Q2 financial results (scheduled for mid-October 2025). Second, new orders and alliance expansion in the low-code, AI support, and new Professional Services domains through ADC will be closely watched. Third, announcements such as upward revisions or shareholder return measures (dividend increases, additional share buybacks, etc.) may drive acceleration of the upward trend.
In the short term, a breakthrough of the 900-yen level will require these factors to materialize with accompanying trading volume. If so, the stock may shift into a breakout phase beyond the current technical resistance. On the other hand, if such developments are lacking or if negative surprises emerge in earnings, there is also a risk of stagnation due to a “buy-the-rumor, sell-the-fact” scenario.
In addition to the contract backlog and ADC, the introduction of long-term stock-based compensation aligned with shareholder interests signals progress in both growth and governance. Conditions for a break above the 900-yen level are gradually coming into place, and the next focus will be quantitative confirmation in the Q2 financial results.
Company profile
◇ A DX support company centered on Atlassian products, accelerating revenue diversification through professional services and proprietary products
Ricksoft Co., Ltd. was established in 2005 in Chiyoda-ku, Tokyo, and is currently listed on the TSE Growth Market. The Company has approximately 230 employees on a consolidated basis. It provides solutions that support operational efficiency and team productivity for corporate clients, with three main business pillars: “Technology Solutions,” “Professional Services,” and “In-house Products.”
The Company’s most distinctive feature is that it offers a one-stop solution centered on Atlassian tools such as Jira and Confluence, covering license sales, implementation support, operational consulting, and peripheral services. In particular, the Company has strong capabilities in Jira customization and internal adoption support. It has an extensive track record of deployments primarily among large enterprises, including IT firms and manufacturers.
In recent years, in response to increasingly diverse customer needs accompanying the advancement of digital transformation (DX) strategies, the Company has expanded its “Technology Solutions” segment to include cloud migration, RPA (robotic process automation), and AI implementation support, in addition to its traditional license and implementation services. It has also strengthened the “Professional Services” segment, including business process design and post-deployment utilization support. These efforts have led to deeper client relationships and the accumulation of recurring revenue.
In Q1 of FY2/2026, Technology Solutions accounted for 82.0% of sales, Professional Services for 11.7%, and In-house Products for 6.3%, with Technology Solutions comprising the vast majority of total revenue. The Company is also advancing a structural reform initiative titled “Reignite 2030,” aiming to reinforce its management foundation and improve profit margins over the medium to long term.
Key financial data
| Unit: million yen | 2021/2 | 2022/2 | 2023/2 | 2024/2 | 2025/2 | 2026/2 CE |
| Sales | 4,431 | 4,308 | 5,623 | 7,491 | 9,044 | 10,168 |
| EBIT (Operating Income) | 602 | 437 | 547 | 666 | 459 | 411 |
| Pretax Income | 601 | 450 | 567 | 350 | 462 | 411 |
| Net Profit Attributable to Owner of Parent | 446 | 327 | 424 | 269 | 356 | 315 |
| Cash & Short-Term Investments | 1,944 | 2,089 | 3,071 | 3,158 | 3,297 | |
| Total assets | 3,180 | 2,939 | 4,577 | 5,971 | 6,687 | |
| Total Debt | 0 | 0 | 0 | 0 | 0 | |
| Net Debt | -1,944 | -2,089 | -3,071 | -3,158 | -3,297 | |
| Total liabilities | 1,279 | 684 | 2,103 | 3,203 | 3,658 | |
| Total Shareholders’ Equity | 1,901 | 2,255 | 2,474 | 2,768 | 3,029 | |
| Net Operating Cash Flow | 478 | 161 | 978 | 100 | 377 | |
| Capital Expenditure | 9 | 61 | 25 | 30 | 95 | |
| Net Investing Cash Flow | -8 | -47 | -27 | -37 | -140 | |
| Net Financing Cash Flow | 19 | 23 | 18 | 7 | -91 | |
| Free Cash Flow | 469 | 110 | 968 | 86 | 298 | |
| ROA (%) | 17.47 | 10.69 | 11.28 | 5.10 | 5.62 | |
| ROE (%) | 26.70 | 15.73 | 17.92 | 10.26 | 12.27 | |
| EPS (Yen) | 103.6 | 74.5 | 94.4 | 59.2 | 78.6 | 70.5 |
| BPS (Yen) | 436.6 | 507.2 | 547.4 | 608.3 | 676.1 | |
| Dividend per Share (Yen) | 0.00 | 0.00 | 0.00 | 0.00 | 0.00 | 0.00 |
| Shares Outstanding (Million shares) | 4.29 | 4.37 | 4.51 | 4.55 | 4.55 |
Source: Omega Investment from company data, rounded to the nearest whole number.
Share price
Financial data (quarterly basis)
| Unit: million yen | 2024/2 | 2025/2 | 2026/2 | ||||||
| 1Q | 2Q | 3Q | 4Q | 1Q | 2Q | 3Q | 4Q | 1Q | |
| (Income Statement) | |||||||||
| Sales | 1,572 | 1,907 | 1,819 | 2,193 | 2,047 | 2,263 | 2,289 | 2,445 | 2,872 |
| Year-on-year | 0.6% | 62.5% | 50.3% | 30.8% | 30.2% | 18.7% | 25.8% | 11.5% | 40.3% |
| Cost of Goods Sold (COGS) | 1,056 | 1,383 | 1,258 | 1,553 | 1,429 | 1,703 | 1,711 | 1,826 | 2,247 |
| Gross Income | 515 | 525 | 561 | 641 | 617 | 560 | 577 | 619 | 625 |
| Gross Income Margin | 32.8% | 27.5% | 30.9% | 29.2% | 30.2% | 24.7% | 25.2% | 25.3% | 21.8% |
| SG&A Expense | 369 | 379 | 415 | 413 | 470 | 485 | 493 | 468 | 495 |
| EBIT (Operating Income) | 146 | 145 | 146 | 228 | 148 | 76 | 84 | 151 | 130 |
| Year-on-year | -13.2% | 30.7% | 37.0% | 42.0% | 0.7% | -48.0% | -42.3% | -33.5% | -11.9% |
| Operating Income Margin | 9.3% | 7.6% | 8.0% | 10.4% | 7.2% | 3.3% | 3.7% | 6.2% | 4.5% |
| EBITDA | 152 | 151 | 153 | 235 | 155 | 83 | 97 | 167 | 145 |
| Pretax Income | 145 | -209 | 179 | 236 | 155 | 77 | 85 | 145 | 97 |
| Consolidated Net Income | 103 | -142 | 131 | 177 | 115 | 62 | 68 | 111 | 74 |
| Minority Interest | 0 | 0 | 0 | 0 | 0 | 0 | 0 | 0 | 0 |
| Net Income ATOP | 103 | -142 | 131 | 177 | 115 | 62 | 68 | 111 | 74 |
| Year-on-year | -22.7% | -262.0% | 69.3% | 40.8% | 11.9% | -143.6% | -48.5% | -37.3% | -35.5% |
| Net Income Margin | 6.5% | -7.4% | 7.2% | 8.1% | 5.6% | 2.7% | 3.0% | 4.5% | 2.6% |
| (Balance Sheet) | |||||||||
| Cash & Short-Term Investments | 2,821 | 2,838 | 3,047 | 3,158 | 3,375 | 3,442 | 3,192 | 3,297 | 3,142 |
| Total assets | 4,983 | 4,788 | 5,830 | 5,971 | 6,291 | 6,588 | 6,004 | 6,687 | 7,365 |
| Total Debt | 0 | 0 | 0 | 0 | 0 | 0 | 0 | 0 | 0 |
| Net Debt | -2,821 | -2,838 | -3,047 | -3,158 | -3,375 | -3,442 | -3,192 | -3,297 | -3,142 |
| Total liabilities | 2,396 | 2,336 | 3,246 | 3,203 | 3,398 | 3,661 | 3,083 | 3,658 | 4,275 |
| Total Sharehjolders’ Equity | 2,588 | 2,452 | 2,585 | 2,768 | 2,893 | 2,927 | 2,921 | 3,029 | 3,090 |
| (Profitability %) | |||||||||
| ROA | 9.20 | 3.88 | 4.47 | 5.10 | 4.99 | 8.53 | 7.12 | 5.62 | 4.61 |
| ROE | 16.57 | 6.96 | 8.83 | 10.26 | 10.26 | 18.03 | 15.31 | 12.27 | 10.52 |
| (Per-share) Unit: JPY | |||||||||
| EPS | 22.7 | -31.2 | 28.8 | 38.9 | 25.3 | 13.6 | 15.1 | 24.8 | 16.6 |
| BPS | 568.7 | 538.9 | 568.0 | 608.3 | 635.7 | 643.9 | 652.0 | 676.1 | 689.7 |
| Dividend per Share | 0.00 | 0.00 | 0.00 | 0.00 | 0.00 | 0.00 | 0.00 | 0.00 | 0.00 |
| Shares Outstanding (million shares) | 4.54 | 4.55 | 4.55 | 4.55 | 4.55 | 4.55 | 4.55 | 4.55 | 4.55 |
Source: Omega Investment from company materials
Financial data (full-year basis)
| Unit: million yen | 2020/2 | 2021/2 | 2022/2 | 2023/2 | 2024/2 | 2025/2 |
| (Income Statement) | ||||||
| Sales | 3,089 | 4,431 | 4,308 | 5,623 | 7,491 | 9,044 |
| Year-on-year | 24.4% | 43.5% | -2.8% | 30.5% | 33.2% | 20.7% |
| Cost of Goods Sold | 1,904 | 2,868 | 2,779 | 3,759 | 5,249 | 6,670 |
| Gross Income | 1,184 | 1,563 | 1,529 | 1,864 | 2,242 | 2,374 |
| Gross Income Margin | 38.3% | 35.3% | 35.5% | 33.1% | 29.9% | 26.2% |
| SG&A Expense | 782 | 961 | 1,091 | 1,317 | 1,576 | 1,915 |
| EBIT (Operating Income) | 402 | 602 | 437 | 547 | 666 | 459 |
| Year-on-year | 8.3% | 49.6% | -27.3% | 25.0% | 21.7% | -31.1% |
| Operating Income Margin | 13.0% | 13.6% | 10.2% | 9.7% | 8.9% | 5.1% |
| EBITDA | 416 | 617 | 467 | 566 | 691 | 502 |
| Pretax Income | 403 | 601 | 450 | 567 | 350 | 462 |
| Consolidated Net Income | 289 | 446 | 327 | 424 | 269 | 356 |
| Minority Interest | 0 | 0 | 0 | 0 | 0 | 0 |
| Net Income ATOP | 289 | 446 | 327 | 424 | 269 | 356 |
| Year-on-year | 13.0% | 54.3% | -26.7% | 29.7% | -36.5% | 32.2% |
| Net Income Margin | 9.4% | 10.1% | 7.6% | 7.5% | 3.6% | 3.9% |
| (Balance Sheet) | ||||||
| Cash & Short-Term Investments | 1,458 | 1,944 | 2,089 | 3,071 | 3,158 | 3,297 |
| Total assets | 1,922 | 3,180 | 2,939 | 4,577 | 5,971 | 6,687 |
| Total Debt | 0 | 0 | 0 | 0 | 0 | 0 |
| Net Debt | -1,458 | -1,944 | -2,089 | -3,071 | -3,158 | -3,297 |
| Total liabilities | 484 | 1,279 | 684 | 2,103 | 3,203 | 3,658 |
| Total Shareholders’ Equity | 1,437 | 1,901 | 2,255 | 2,474 | 2,768 | 3,029 |
| (Cash Flow) | ||||||
| Net Operating Cash Flow | 316 | 478 | 161 | 978 | 100 | 377 |
| Capital Expenditure | 13 | 9 | 61 | 25 | 30 | 95 |
| Net Investing Cash Flow | -43 | -8 | -47 | -27 | -37 | -140 |
| Net Financing Cash Flow | 152 | 19 | 23 | 18 | 7 | -91 |
| Free Cash Flow | 303 | 469 | 110 | 968 | 86 | 298 |
| (Profitability %) | ||||||
| ROA | 16.97 | 17.47 | 10.69 | 11.28 | 5.10 | 5.62 |
| ROE | 23.80 | 26.70 | 15.73 | 17.92 | 10.26 | 12.27 |
| Net profit margin | 9.35 | 10.06 | 7.59 | 7.54 | 3.59 | 3.93 |
| Asset turnover ratio | 1.81 | 1.74 | 1.41 | 1.50 | 1.42 | 1.43 |
| Financial leverage | 1.40 | 1.53 | 1.47 | 1.59 | 2.01 | 2.18 |
| (Per-share) Unit: JPY | ||||||
| EPS | 68.5 | 103.6 | 74.5 | 94.4 | 59.2 | 78.6 |
| BPS | 336.0 | 436.6 | 507.2 | 547.4 | 608.3 | 676.1 |
| Dividend per Share | 0.00 | 0.00 | 0.00 | 0.00 | 0.00 | 0.00 |
| Shares Outstanding (million shrs) | 4.20 | 4.29 | 4.37 | 4.51 | 4.55 | 4.55 |
Source: Omega Investment from company materials