2026-07-15
Home
Japanese

Omega Investment Co., Ltd.
Waqoo (Investment report – Basic report)
| Share price (6/4) | ¥1,550 | Dividend Yield (26/9 CE) | 0.0 % |
| 52weeks high/low | ¥927/1,850 | ROE(25/9 act) | 2.1 % |
| Avg Vol (3 month) | 5.566 thou shrs | Operating margin (25/9 act) | 7.7 % |
| Market Cap | ¥5.68 bn | Beta (5Y Monthly) | 0.76 |
| Enterprise Value | ¥4.91 bn | Shares Outstanding | 3.663 mn shrs |
| PER (26/9 CE) | 21.9 X | Listed market | TSE Growth |
| PBR (25/9 act) | 2.5 X |
| Click here for the PDF version of this page |
| PDF version |
A shift in the valuation axis toward the Medical Support Business is beginning. Against the backdrop of PDF-FD growth and higher D2C profitability, a re-rating of the share price should be expected.
Investment conclusion
Growth in the Medical Support Business is driving an earnings turnaround. If improvement in PDF-FD KPIs continues, a re-rating of the share price should be expected.
Waqoo, Inc. (hereinafter, the Company) is a company listed on the Tokyo Stock Exchange Growth Market that operates the Medical Support Business and the D2C business. Previously, the Company had a strong image as a provider of D2C and subscription-type cosmetics and healthcare products, but the center of its current corporate value formation is shifting toward the Medical Support Business, centered on PDF-FD, a blood-derived processing service. In 2Q FY2026/9, net sales were 1,133 million yen, operating profit was 138 million yen, and interim profit attributable to owners of parent was 136 million yen, marking a major turnaround from a loss in the same period of the previous fiscal year. The Company has also revised its full-year plan to net sales of 2,500 million yen, operating profit of 400 million yen, and profit attributable to owners of parent of 250 million yen.
Our investment view is that this is a phase in which growth in the Medical Support Business is driving an earnings turnaround and, if improvement in PDF-FD KPIs continues, a re-rating of the share price can be expected. Over the past several years, the Company’s net sales and profits have both fluctuated due to changes in the D2C business environment, rising advertising media expenses, and a shift in its earnings structure. However, recently, the Medical Support Business has become the main driver of sales growth, while the D2C business has shifted its operating policy toward securing profit and cash despite lower sales. As a result, the Company stands at the threshold of a change in how the stock market views it, from a small consumer goods company centered on D2C to a medical support company centered on a network of medical institutions.
The appeal of the Company does not lie merely in the theme of regenerative medicine-related business. It lies in the fact that investors can confirm progress on growth on a quarterly basis through KPIs such as the number of partner clinics, the number of contract-processing cases, the average number of contract-processing cases, and the utilization rate. The number of PDF-FD partner clinics was 796 as of the end of 2Q FY2026/9, up 242 clinics year on year, and the cumulative number of contract processing cases was 19,897, up 8,632 cases year on year. The simultaneous increase in the number of partner clinics and contract-processing cases indicates that the Medical Support Business is not merely expectation-led but is beginning to translate into actual net sales and profits.
On the other hand, the utilization rate was 60.1%, down 4 percentage points year on year. The Company has stated that this was a temporary decline accompanying the leading expansion of new partner clinics, and expects a return to an upward trend over the medium term. This is the most important confirmation item in future investment decisions. Immediately after the number of partner clinics increases, it takes time for patient explanations and in-clinic operations to be established at new clinics, so the overall utilization rate tends to decline temporarily. From here, if use at existing clinics deepens and the number of contract-processing cases per clinic increases, not only sales growth but also profit margin improvement are likely to accompany it. Therefore, improvement in PDF-FD KPIs, especially a recovery in utilization rate, will be an important signal for a re-rating of the share price.
The current share price already factors in a certain level of growth expectations. Using a forecast PER of 32.2x, an actual PBR of 2.60x, an actual ROE of 2.08% for FY2025/9, a forecast EPS of 52.4 yen, and a forecast dividend of 0 yen, the share price is approximately 1,716 yen. Based on a PBR of 2.60x and an ROE of 2.08%, and assuming a cost of equity of 7%, the market’s implied expected EPS growth rate, calculated backward, is approximately 10.1% per annum. Assuming a sensitivity of the cost of equity to 6-8%, the embedded growth rate is approximately 8.4-11.7%. In contrast, EPS declined from 38.7 yen in FY2021/9 to 12.3 yen in FY2025/9, with an endpoint-based CAGR of -24.9% per annum. Looking only at past performance, the current share price is difficult to explain.
However, using the Company’s planned EPS of 68.62 yen after the upward revision on May 14, PER declines to approximately 23.8x based on the May 19 closing price of 1,636 yen. Using the forecast EPS of 52.4 yen before the upward revision, PER is in the 32x range, but the valuation changes significantly when viewed based on the profit level after the upward revision. As a small growth stock, a PER in the mid-20x range is not excessively high. Rather, if the growth of the Medical Support Business continues from 2H FY2026/9 into the following fiscal year, and investors recognize the operating profit of 400 million yen not as a one-time level but as a new profit level, a re-rating of the share price can be expected.
The signs for investors to consider holding or including the stock positively are, first, that the PDF-FD utilization rate bottoms out and re-enters an upward trend. Second, an increase in the number of partner clinics should lead to more contract-processing cases, and the segment profit margin of the Medical Support Business should improve. Third, the D2C business should maintain high profitability even with lower sales and continue to serve as a source of funds for growth investments. Fourth, the Other business should develop not into one-time project earnings but into a continuous source of revenue utilizing the medical institution network. If these points are confirmed, the Company’s shares will likely be evaluated not merely as a stock with strong results, but as a stock whose earnings structure has changed.
At this stage, rather than being overly cautious given past earnings fluctuations, we would like to evaluate changes in the Company’s image, combining growth in the Medical Support Business with highly profitable operations in the D2C business. In the short term, a phase in which the share price moves ahead in response to strong results and an upward revision is also conceivable, but if improvement in PDF-FD KPIs and the establishment of the profit level are confirmed, we believe the stock offers the potential to aim for meaningful returns even over an investment period of one to two years.
1. Business model and business structure
The valuation axis is shifting from a D2C company to a medical support company centered on a network of medical institutions.
The Company’s current businesses consist of the Medical Support Business, the D2C business, and Other. The Company lists the Medical Support Business and the D2C business as its business activities. However, when investors look at the Company, it should no longer be viewed solely as a D2C brand. While D2C remains a cash-generating function that utilizes the existing customer base, the main driver of corporate value creation is shifting to the Medical Support Business.
The core of the Medical Support Business is services related to regenerative medicine. The Company processes patients’ blood and adipose tissue collected at partner clinics at a cell processing center and provides the processed materials to each clinic. In its contract blood-derived processing services, the Company explains that it extracts and filters growth factors with self-tissue repair and anti-inflammatory effects from PRP obtained from patients’ blood entrusted by medical institutions, as a technology aimed at functional improvement. From the perspective of medical institutions, this makes it easier to provide regenerative medicine services to patients without having all specialized facilities and know-how in-house. From Waqoo’s perspective, increasing the number of partner clinics and contract-processing cases can expand contract revenue through its medical institution network.
This business structure has a revenue profile that differs significantly from that of a typical D2C business. D2C earnings are affected by advertising investment, customer acquisition cost, churn rate, LTV, and product gross margin. In contrast, the Medical Support Business is driven by the number of partner clinics, the number of processing cases per clinic, the utilization rate, the processing unit price, and the number of peripheral services introduced. The important point is that the Company’s center of gravity is shifting from a consumer-facing business affected by advertising investment to a BtoBtoC-type business centered on a medical institution network.
In 2Q FY2026/9, net sales in the Medical Support Business were 631 million yen, up 90.4% year on year, and segment profit turned positive at 88 million yen. The number of PDF-FD partner clinics was 796, up 242 clinics year on year, and the cumulative number of contract processing cases was 19,897, up 8,632 cases year on year, both exceeding the initial plan. The utilization rate was 60.1%, down 4 percentage points year on year, but the Company has stated that this was a temporary decline accompanying the leading expansion of new partner clinics, and expects a return to an upward trend over the medium term.
The meaning of this business in terms of corporate value formation is not limited to an increase in the number of contract processing cases. The number of partner clinics is the basis for future sales; the number of contract processing cases reflects the realized value of demand; and the utilization rate indicates the degree of deepening with existing partners and sales efficiency. In its approach to revenue growth, the Company emphasizes the number of partner clinics, products and services, contract and order cases, and utilization rate. If the Company can not only increase the number of partner clinics but also raise the frequency of use at existing clinics and cross-sell products and technologies other than PDF-FD, sales growth and profit margin improvement can proceed simultaneously.
Another feature of the Medical Support Business is that once it is incorporated into the operating flow of partner clinics, continuity tends to increase. For medical institutions to incorporate into their operations the flow of explaining services to patients, collecting blood and sending specimens, receiving processed materials, and performing treatment, a certain amount of educational and introductory support is required. In the initial introduction phase, the burden on sales and CS increases, but once operations are established, the clinic side’s experience level rises, and the accuracy of patient explanations and proposals improves. If the number of contract-processing cases per clinic increases here, Waqoo’s sales efficiency improves as well. Therefore, the essence of the Medical Support Business lies not only in the sales capability to increase the number of clinics, but also in the operational support capability to deepen use after introduction.
The positioning of the D2C business has shifted from a conventional growth engine to a cash-generating division that leverages the existing customer base. Regarding the D2C business, the Company states that, in response to rising advertising media expenses and changes in consumer behavior, it has shifted to operations that restrain new customer acquisition and emphasize maximizing profitability from the existing customer base. The main measures are cross-selling to existing customers, expanding sales through mall channels, which is a highly profitable model, and improving the efficiency of customer service operations through the introduction of AI bots.
Investors can positively evaluate this shift. D2C earnings tend to be affected by fluctuations in advertising expenses, and there are phases in which the more a company pursues sales, the more its profit is eroded. On the other hand, if the focus shifts to maximizing profitability from existing customers, this is likely to help stabilize profit and cash flow, even if sales growth is constrained. In fact, in 2Q FY2026/9, the D2C business posted net sales of 376 million yen, down 25.2% year on year, but segment profit was 162 million yen, up 13.4% year on year. The fact that the business achieved higher profits despite lower sales indicates that D2C has been redesigned as a defensive earnings source.
The Other business is an area in which the Company promotes the introduction and adoption of advanced overseas products and technologies, against the backdrop of the need for more advanced services at partner medical institutions. The Company states that, based on its medical institution network and data assets, it aims to develop multiple products and technologies cross-sectionally and evolve into a platform-type revenue model. Although the scale of this business is small at present, expanding peripheral revenue through the partner clinic network of the Medical Support Business has the potential to raise future profit margins.
Based on the above, the Company’s business structure is shifting from a single-product, mail-order, subscription-type D2C model to a medical institution network-type model centered on Medical Support. D2C is becoming less of the main driver of sales growth, but remains a source of profit contribution and marketing know-how. Medical Support is the main driver of growth, and Other business is being developed as an additional revenue stream on top of the medical institution network. This three-layer structure is the basis for understanding the Company.
2. Growth structure of the Medical Support Business
Expansion in the number of partner clinics, an increase in the number of contract-processing cases, and an improvement in the utilization rate will determine profit growth.
The growth structure of the Medical Support Business is relatively easy to understand. First, the Company increases the number of partner clinics. Next, it promotes the use of PDF-FD at partner clinics. Furthermore, it increases the number of contract processing cases per clinic and raises the utilization rate. Finally, it cross-sells products and technologies other than PDF-FD. If this flow functions, the Company can increase sales and profits by expanding the medical institution network and deepening the existing network.
The number of partner clinics is the base that determines the upper limit of business scale. The number of PDF-FD partner clinics at the end of 2Q FY2026/9 was 796, an increase of 242 clinics year-on-year. This indicates that the Company’s sales activities and sales routes, including its relationship with SBC Medical Group, are functioning. An increase in the number of partner clinics itself means that the gateway to future sales is widening. However, the number of partner clinics is only the gateway, and unless clinics use PDF-FD continuously, it will not lead to profit growth.
The number of contract-processing cases indicates whether the partner clinic network is being monetized. The cumulative number of contract processing cases was 19,897, an increase of 8,632 cases year-on-year. It is encouraging that the increase in the number of partner clinics and the increase in the number of contract-processing cases are progressing simultaneously. Note that the number of contract processing cases may lag behind an increase in the number of partner clinics. New clinics do not necessarily generate a large number of cases immediately after introduction. The number of cases increases only after doctors and staff understand the service content, patient explanations become established, and the service is incorporated into in-clinic operations. Therefore, when the number of partner clinics grows faster than other factors do, the utilization rate tends to decline in the short term.
The utilization rate is one of the most important KPIs for measuring the quality of this business. The utilization rate at the 2Q stage was 60.1%, down 4 percentage points year on year. The Company explains that this was a temporary decline accompanying the leading expansion of new partner clinics. This explanation is reasonable at a time when the number of partner clinics has increased substantially. Because new partners are introduced immediately, the number of contract processing cases tends to be lower than at existing clinics. Therefore, if the number of partner clinics increases rapidly, the overall average utilization rate tends to decline temporarily.
The issue is whether this decline is temporary or structural. If it is temporary, the utilization rate will recover over time through CS, sales follow-up, explanations to doctors and staff, and the penetration of proposals to patients. If that happens, the increase in the number of partner clinics will be reflected in the number of contract-processing cases and profit, with a lag. On the other hand, if the utilization rate does not recover, the increase in the number of partner clinics may not be sufficient to drive monetization. In that case, sales and CS costs will precede revenue, and profit margins are less likely to improve. Therefore, what should be emphasized most in the subsequent financial results is not the growth in the number of partner clinics itself, but whether the utilization rate bottoms out and begins to rise again.
The Company is promoting one-stop sales as part of service sophistication and operational efficiency improvements. This is a sales style in which one person is responsible for new contract acquisition to CS, replacing activities previously divided among multiple staff members, and it also includes activities to support the maximum use of PDF-FD. This initiative can be understood as aiming simultaneously to increase the number of partner clinics and to improve utilization rates among existing partners. From an investor’s perspective, profitability will be determined not by a simple increase in sales personnel, but by the operational capability to increase the number of contract-processing cases per clinic.
This one-stop sales approach is also related to an improvement in the Medical Support Business’s profit margin. If the Company focuses only on acquiring new partners, sales activities will expand, while follow-up after introduction becomes thin, making it difficult for the utilization rate to rise. Conversely, if a system in which new contracts and CS are handled in an integrated manner functions, it becomes easier to identify issues at each clinic early and to connect them to PDF-FD explanations, patient proposals, and improvements in in-clinic flows. This mechanism converts an increase in the number of clinics into an increase in cases and determines the profitability of the Medical Support Business.
The relationship with SBC Medical Group is also important in the growth structure of the Medical Support Business. SBC Medical Group is a Medical Services Organization that provides management support to medical institutions in Japan and overseas across a wide range of medical fields, including advanced cosmetic medicine, dermatology, orthopedics, infertility treatment, gynecology, dentistry, alopecia treatment, and ophthalmology, and was listed on NASDAQ in September 2024. For the Company, collaboration with the SBC Group can be a route to accelerating the introduction, sales, credit supplementation, and rollout of peripheral products and services for medical institutions, not merely a capital relationship.
However, expectations for collaboration with SBC will be reflected in corporate value only once they are reflected in KPIs. It is not sufficient for the number of partner clinics to increase solely because of the relationship with the SBC Group. At those clinics, the number of PDF-FD contract-processing cases must increase, the utilization rate must rise, and the introduction of other products and technologies must also advance. Therefore, while collaboration with SBC is a major share price catalyst, in investment decisions, it is important to confirm it by the number of partner clinics, the number of contract-processing cases, the utilization rate, and the net sales and profit of the Other business.
Because the Medical Support Business is related to medical care and regenerative medicine, the management burden also increases as the business grows. The business carries risks distinct from those of D2C, including quality and safety, compliance with laws and regulations, relationship management with medical institutions, and fluctuations in patient demand. Therefore, the Company’s strength depends not only on the pace of growth but also on its ability to maintain quality control and sales efficiency as the number of partner clinics increases. If the utilization rate remains low and does not recover even as the number of partner clinics increases, expanding the sales base will not easily lead to profit growth. Conversely, if the Company can recover the utilization rate while increasing the number of partner clinics, its model will become stronger.
For Waqoo today, the Medical Support Business is not merely new. It is not simply a business that offsets the slowdown in D2C growth but a core business that has begun to shift the Company’s valuation axis. If expansion in the number of partner clinics, an increase in the number of contract-processing cases, a recovery in the utilization rate, and the introduction of peripheral products are all achieved, the Company will likely be evaluated as a small but highly profitable service company for medical institutions.
3. Positioning of the D2C business
Contraction is not only negative. Its role is shifting from pursuing growth to emphasizing profit and cash.
The D2C business has been an important business foundation since the Company’s founding, and the Company develops proprietary brands such as HADA NATURE and CobodySlim+. The Company handles planning and operations, product development, wholesale and retail, sales and advertising strategies, and distribution on an integrated basis. The strength of D2C lies in the Company’s ability to directly retain customer data and develop sales metrics, product improvements, and cross-selling initiatives under its own initiative. On the other hand, the conventional D2C growth model has become more challenging than before due to rising advertising media costs, shifts in consumer behavior, intensified competition, and evolving market perceptions of subscription purchase models.
In response to these environmental changes, the Company has changed its operating policy for the D2C business. It has shifted to operations that restrain new customer acquisition and emphasize maximizing profitability from the existing customer base. The main measures are cross-selling to existing customers, expanding sales through mall channels, which is a highly profitable model, and improving the efficiency of customer service operations through the introduction of AI bots. This can be described as an initiative to change the business into one that secures profit and cash, rather than continuing to pursue sales growth.
In 2Q FY2026/9, the D2C business posted net sales of 376 million yen, down 25.2% year on year. At first glance, the contraction of D2C appears negative. However, segment profit was 162 million yen, up 13.4% year-on-year. The fact that profit increased despite lower sales indicates that operations have shifted toward more profitable ones through restraint in advertising investment, review of sales channels, measures for existing customers, and improved customer service efficiency. Therefore, the D2C business should not be evaluated only based on lower sales.
The current role of D2C is, first, to generate cash. The Medical Support Business requires investment in growth, and costs are incurred to expand the number of partner clinics and strengthen the CS structure. If D2C continues to generate profits, the Company can internally fund investment in the growth business. Second is the supply of marketing know-how. Through D2C, the Company has accumulated experience in customer acquisition, LTV management, cross-selling, data analysis, and customer service. This know-how can also be applied when providing information to medical institutions and patients, promoting use, and supporting the introduction of services in the Medical Support Business. Third is the absorption of fixed costs. If D2C sales contract too rapidly, the Company’s ability to absorb company-wide expenses declines, making it important to maintain a certain scale of profit.
When evaluating the D2C business, note the balance between lower sales and higher profit. If advertising investment is restrained, profit tends to emerge in the short term. However, if new customer acquisition is restrained too much, the existing customer base may shrink over time, and future sales and profits may decline. Therefore, with respect to the current D2C business, while evaluating the increase in profit despite lower sales, it is necessary to confirm whether the pace of sales decline does not become excessive. If D2C maintains high profit while contracting gradually, this will be positive for the Company’s overall earnings. Conversely, if the decline in sales is too rapid, attention will be needed to the sustainability of its profit contribution.
The profit margin of the D2C business is extremely high. The segment profit margin in 2Q was approximately 43.3%, making a significant contribution to the company’s overall profit. This profit margin is important for absorbing growth investment in the Medical Support Business. On the other hand, because the high D2C profit margin raises the overall company profit margin, it is also necessary not to overestimate the profitability of the Medical Support Business on a standalone basis. Investors should separate D2C’s high profitability from Medical Support’s growth potential and assess the quality of the company’s overall profits.
At present, contraction in the D2C business should be viewed not as a factor that impairs the Company’s investment appeal, but as part of the business portfolio transition. By shifting from a D2C business focused on sales growth to one that secures profit and cash, its role in supporting the Medical Support Business is strengthening. However, whether the D2C profit is only temporarily high or can be sustained over the long term must be confirmed in future quarters. In particular, the sales decline rate, segment profit, advertising investment level, sales composition of mall channels, and the effects of measures for existing customers will determine the investment evaluation of D2C.
4. Earnings analysis
Having moved beyond the loss phase, the earnings structure is improving, with Medical Support leading the way. The focus is on achieving the full-year plan and sustaining profit margins.
Looking at the Company’s long-term earnings, net sales contracted from 4,682 million yen in FY2021/9 to 1,960 million yen in FY2025/9. Changes in the environment for the D2C business, deterioration in advertising efficiency, and a transition in the business portfolio have reduced the sales scale. Operating profit has also fluctuated significantly, with 149 million yen in FY2021/9, a 39 million yen operating loss in FY2022/9, 277 million yen in FY2023/9, 56 million yen in FY2024/9, and 150 million yen in FY2025/9. The sales CAGR over the past five years was -19.6%, and based solely on past figures, it is difficult to describe the Company as a stable growth company.
However, the view emerging in 2Q FY2026/9 is changing. Net sales increased 35.8% year on year, and operating profit turned positive at 138 million yen from an operating loss of 52 million yen in the same period of the previous fiscal year. Because the Medical Support Business posted a sharp increase in sales and turned profitable, and the D2C business secured higher profit despite lower sales, the quality of earnings improved for the Company as a whole. If this structural change is not temporary, the Company’s valuation axis will shift from a D2C-dependent company to a highly profitable company centered on Medical Support.
By segment, the Medical Support Business posted net sales of 631 million yen and segment profit of 88 million yen, for a profit margin of approximately 13.9%. The D2C business posted net sales of 376 million yen and segment profit of 162 million yen, for a high profit margin of approximately 43.3%. The Other business posted net sales of 125 million yen and segment profit of 95 million yen, with a profit margin reaching approximately 75.9%. However, the Other business is in its start-up phase, and it is necessary to assess the nature and continuity of its projects. Adjustments were negative 208 million yen, and the operating profit margin after absorbing company-wide expenses was 12.2%.
What is important here is not to over-evaluate only the high profit margin of the D2C business. D2C can generate short-term profit relatively easily if advertising expenses are restrained, but if its sales base shrinks too much, its future cash-generating capacity will also decline. On the other hand, Medical Support grows by increasing the number of partner clinics and contract processing cases, and therefore requires short-term investment in sales, CS, and processing systems. Therefore, when looking at the overall company profit margin, D2C’s profit contribution and growth investment in Medical Support should be considered separately.
The high profit margin of the Other business also needs to be viewed carefully. At the 2Q stage, segment profit was 95 million yen, making a significant contribution to overall company profit, but the period for confirming whether the introduction and adoption of advanced overseas products and technologies will translate into continuous revenue is still short. If it is established as peripheral revenue through the medical institution network, it will be an important factor in raising the overall company profit margin. On the other hand, if one-time project earnings account for a large portion, it will be necessary to examine reproducibility from the following fiscal year onward carefully.
The full-year plan for FY2026/9 is net sales of 2,500 million yen, operating profit of 400 million yen, ordinary profit of 390 million yen, profit attributable to owners of parent of 250 million yen, and EPS of 68.62 yen. The progress rates at the 2Q cumulative stage are 45.3% for net sales, 34.5% for operating profit, and 54.6% for net profit. Sales may be weighted toward the second half, and operating profit appears somewhat conservative given progress at the 2Q stage, but the Company made an upward revision when announcing 2Q results, suggesting it has a certain level of confidence in the current business environment.
What is important in achieving the full-year plan is whether growth in the Medical Support Business continues in the second half. If the increase in the number of partner clinics continues, the number of contract processing cases grows, and the utilization rate bottoms out, the certainty of sales growth will rise. In addition, if the D2C business maintains high profit margins despite lower sales and the Other business continues to generate profit, achieving an operating profit of 400 million yen becomes more feasible. On the other hand, if the decline in the utilization rate of Medical Support continues, if the decline in D2C sales is larger than expected, or if profit in the Other business remains temporary, views on the full-year plan are likely to become cautious.
Future monitoring items are, first, the number of PDF-FD partner clinics. Whether new partnerships can continue will determine the base for future sales. Second is the number of contract processing cases. Even if only the number of partner clinics increases, monetization will be delayed unless actual contract processing accompanies it. Third is the utilization rate. At the 2Q stage, it declined to 60.1%, but the Company attributes this to a temporary decline due to the ongoing expansion of new partner clinics. If this recovers, sales growth and profit margin improvement are likely to proceed simultaneously. Fourth is the pace of decline in D2C sales. We would like to confirm whether D2C can maintain sufficient scale and profit as a cash-generating division. Fifth is the continuity of the Other business. If this becomes continuous revenue, the market’s view of the Company’s overall profit margin is likely to improve further.
5. Balance sheet, cash flow, and capital efficiency
Net cash is ample, but actual ROE is low. The market is beginning to look not at the past, but at the profit level after the structural transition
At the end of FY2025/9, the Company had cash and deposits of 1,302 million yen, interest-bearing debt of 731 million yen, and net cash of 571 million yen. At the end of 2Q FY2026/9, cash and deposits were 1,369 million yen, interest-bearing debt was 628 million yen, and net cash was 740 million yen, indicating a high level of financial safety. Total assets were 3,397 million yen, net assets were 2,243 million yen, and the equity ratio was 65.6%.
This financial structure is a reassuring factor in advancing growth investment. The Medical Support Business requires processing systems, quality control, sales and CS structures, and the construction of a medical institution network, and the depth of cash on hand supports business expansion. On the other hand, from a stock investment perspective, although profit remains small despite ample equity capital, the actual ROE for FY2025/9 remains at 2.08%. Given a PBR of 2.60x, the current share price is difficult to explain solely based on actual ROE.
For this reason, the Company’s PER appears high, or PBR is maintained at a high level despite low actual ROE, because the market is factoring in profit recovery from FY2026/9 onward rather than past performance. If the share price is in the 1,600 yen range, with EPS of 12.3 yen in FY2025/9, the actual PER exceeds 100x. However, if the Company’s plan’s EPS of 68.62 yen is assumed, PER declines to the mid-20x range. In other words, the market is looking ahead not to the results of the loss-making, low-profit period, but to a profit level driven by Medical Support.
In terms of ROIC, past results are not yet stable. As of FY2025/9, ROIC was below the cost of capital. This reflects the past contraction of D2C, business transition, and low profit level. However, assuming an operating profit of 400 million yen under the Company plan for FY2026/9, capital efficiency could improve significantly. Investors need not stop their evaluation at past ROIC, but should re-examine the relationship between the operating profit margin after the business transition and invested capital.
In terms of cash flow, operating cash flow in FY2025/9 was 136 million yen, and capital expenditures were 193 million yen, resulting in a negative simple free cash flow. The investment burden during the business transition phase remains, and at present, cash-generating capacity has not yet stabilized sufficiently. However, if advertising investment in D2C is restrained, the profitability of Medical Support and the high profit margin of the Other business can continue, and operating cash flow may improve from FY2026/9 onward. This is an important point to confirm in the subsequent financial results.
To improve capital efficiency, raising the profit level is most important. A high equity ratio can be evaluated from a safety perspective, but ROE will not rise if profits remain small. The forecast dividend is 0 yen, and at present, the Company is not at a stage where improvement in capital efficiency through shareholder returns can be expected. Therefore, what justifies the Company’s PBR is not return but profit growth. If the operating profit of 400 million yen is achieved and profit continues to accumulate thereafter, ROE will improve, making it easier to maintain a valuation in the 2x PBR range. Conversely, if profit recovery proves temporary, the low level of actual ROE may be observed again.
6. Shareholder distribution and supply-demand implications
The presence of stable shareholders is a source of support. On the other hand, the low free float ratio affects liquidity and the speed of re-rating
According to FactSet Ownership data, the Company’s free float ratio is 32.42%, and identifiable major shareholders hold 67.58%. Major shareholders include Yoshiyuki Aikawa at 27.17%, Hiroki Inoue at 14.99%, SBC Medical Group Holdings at 9.71%, MC at 4.95%, Daishi Fukudome at 3.05%, treasury shares at 2.75%, Toshihiko Maeda at 2.03%, and Bumpei Samata at 1.49%. SBC Medical Group Holdings’ shareholding indicates both expectations for business collaboration and capital stability.
The benefit of this shareholder structure is that stable shareholders are substantial in number, making a certain degree of downside resistance against short-term deterioration in supply and demand more likely to work. Because founders, related parties, and business-related parties hold a certain percentage, the share price is less likely to collapse significantly during the business transition phase due to the market’s short-term view. In addition, the relationship with the SBC Group differs from that of ordinary stable shareholders, as the growth story of the Medical Support Business and the shareholder structure are linked.
On the other hand, the low free float ratio also makes it difficult to attract large purchases from institutional investors. Because the market capitalization is small and liquidity is limited, even if earnings improve, it will take time for large institutional investors to increase their ownership ratios. Conversely, when positive catalysts emerge, the share price can rise sharply in the short term because few shares are available for sale. Therefore, the supply-demand dynamics for the Company’s shares are characterized by earnings catalysts and low liquidity acting simultaneously.
The point investors should confirm is how business collaboration with the SBC Group appears in actual KPIs. If it leads not merely to presence as a parent company or major shareholder, but to the number of partner clinics, the number of contract processing cases, the number of introductions of other products and technologies, and cross-selling of services for medical institutions, the shareholder structure will be evaluated as support for corporate value formation. Conversely, if only expectations for the capital relationship run ahead and KPI growth slows, the share price’s expectations will be prone to adjustment.
7. Share price trend and current valuation position
The share price is under pressure amid expectations for the business transition. The next focus is the connection from expectations to results
The Company’s shares have seen a major shift in their valuation axis amid the shift from D2C growth expectations after listing to a subsequent earnings slowdown and a business transition to Medical Support. In FY2021/9, net sales were 4,682 million yen, and EPS was 38.7 yen. In FY2022/9, the Company incurred a loss. In FY2023/9, it temporarily returned to profit. In FY2024/9, it again posted a net loss. In FY2025/9, it remained in a small profit. These earnings fluctuations are the background to medium-term instability in the share price.
We believe the share price trend over the past roughly five years has been driven more by changes in the evaluation of the business model than by earnings themselves. During the period when the Company was viewed as a D2C company, the main valuation axes were sales growth rate, advertising efficiency, and continuity of the subscription purchase model. However, as the D2C growth model slowed due to rising advertising costs and shifts in consumer behavior, the share price became prone to stagnation. In contrast, as the Medical Support Business begins to grow, the current share price has begun to factor in a view of the Company not as a contracting D2C company but as a medical support company with a network of medical institutions.
The reason the share price is not easily breaking upward all at once, despite the improvement in earnings, is that the confirmation period is still short. 2Q FY2026/9 marked a major turnaround to profit, and the full-year plan was also revised upward. However, from investors’ perspective, it is necessary to determine whether the number of PDF-FD partner clinics will continue to expand, whether the utilization rate will recover, whether the decline in D2C sales will remain within expectations, and whether the high profit margin of the Other business will continue. The current share price factors in part of the strong results, but we believe several more quarters of confirmation are needed for the Medical Support Business to be evaluated as a full-fledged growth business.
Assuming a forecast PER of 32.2x and a forecast EPS of 52.4 yen, the share price is approximately 1,716 yen. This level is high when viewed against the current ROE of 2.08% and no dividend. However, using the Company’s planned EPS of 68.62 yen after the upward revision on May 14, even at the same share price of 1,716 yen, PER is approximately 25.0x. At the May 19 closing price of 1,636 yen, it is approximately 23.8x. In other words, when viewed in terms of the profit level after the upward revision, the valuation cannot be considered excessively high.
However, the current share price factors in EPS growth expectations of approximately 8-12% per annum. The actual EPS CAGR over the past five years was negative, and the sales CAGR was also negative. What the market expects is not an extension of the past, but a new growth trajectory after the business transition. For this expectation to be justified, sales growth in the Medical Support Business, improvement in the utilization rate, maintenance of the operating profit margin, and cash generation by D2C must progress simultaneously.
8. Consideration of fair share price
The median of the three methods is around the current share price. If improvement in PDF-FD KPIs continues, an approach toward the upper range should be expected.
When estimating the fair share price using the three methods of PBR, DCF, and ROIC, we believe the current median is broadly around 1,700 yen, with a range of approximately 1,200-2,200 yen. The current share price in the 1,600 yen range is near the midpoint, and based on earnings following the upward revision, it is difficult to say it is overvalued. On the other hand, because actual ROE is still low and past earnings fluctuations have also been large, confirmation of results from 2H FY2026/9 onward will be important for the share price to move from the current level toward the upper range.
Under the PBR method, using an actual PBR of 2.60x and a BPS of approximately 660 yen as the basis, we set the fair PBR range at 1.8-3.2x, with a midpoint of around 2.5x. This approach factors in not only the actual ROE of 2.08% in FY2025/9, but also the improvement in ROE following the achievement of the Company plan for FY2026/9. As a result, the share price range under the PBR method is approximately 1,200-2,100 yen, and the median is around 1,650 yen. If only actual ROE is used, a PBR of less than 1x can also be explained, but that would not reflect the profit level after the upward revision. The current market valuation is not looking at the low ROE in FY2025/9, but at the improvement in ROE from FY2026/9 onward.
Under the DCF method, based on the operating profit of 400 million yen in the Company plan for FY2026/9, we simplified after-tax operating profit, working capital, and capital expenditures, and assumed normalized FCF of 200-280 million yen, WACC of 5.5-6.0%, and perpetual growth rate of 1.0-1.5%. Taking net cash of approximately 740 million yen into account, the share price range under the DCF method is 1,350-2,200 yen, with a median slightly below 1,800 yen. DCF is highly sensitive to assumptions, but if the Medical Support Business grows as planned and D2C maintains its cash-generating function, a level somewhat above the current share price is also justified.
Under the ROIC method, we factor in the improvement in ROIC following achievement of the Company plan for FY2026/9, while taking into account that the past actual ROIC was below WACC. If the Company is evaluated solely on past results, the share price may decline to around 1,200 yen. On the other hand, if the operating profit of 400 million yen is established and profit growth continues while increases in invested capital are restrained, ROIC will recover to a level above the cost of capital, making a valuation of approximately 1,700-2,200 yen possible. Therefore, under the ROIC method, the Company is currently at a turning point, and confirmation of actual results is highly important.
Layering the three methods, we see the fair share price range at 1,200-2,200 yen, with the median around 1,700 yen. The current share price in the 1,600 yen range is near this median and, as a post-results valuation, is broadly within a reasonable range. However, to move toward the upper end of the range, KPIs in the Medical Support Business must continue to improve, and the full-year operating profit of 400 million yen must be recognized not as a one-year upside but as the profit level for the following fiscal year and thereafter. Conversely, if recovery in the utilization rate is delayed, D2C sales decline significantly, and profit in the Other business remains temporary, the share price may adjust toward the lower end of the range.
9. Growth strategy and risks
Upside factors are recovery in PDF-FD utilization rate and collaboration with SBC. Downside factors are delays in monetization after the expansion of partner clinics.
The Company’s growth strategy centers on the Medical Support Business, increasing the number of partner clinics, expanding the number of contract-processing cases, and raising the utilization rate among existing partners. Collaboration with SBC Medical Group, introduction of advanced overseas products and technologies, and a platform-type revenue model utilizing the medical institution network are added to this. By developing multiple products and technologies across segments, the Company aims to strengthen the medical institution network, build an early customer base, establish a price advantage in high-value-added areas, and demonstrate technological leadership.
The first upside factor is the recovery in the PDF-FD utilization rate. At the 2Q stage, while the number of partner clinics increased substantially, the utilization rate declined to 60.1%. If this is a temporary decline as expected by the Company and the utilization rate rises from the second half onward, sales growth and profit margin improvement will proceed simultaneously. The second is the expansion of the medical institution network through collaboration with the SBC Group. If the SBC Group’s medical fields and Waqoo’s contract processing and product introduction functions are linked, peripheral services other than PDF-FD may also expand. The third is continuation of the high profit margin in the Other business. If the introduction of advanced overseas products and technologies is not a one-time event but becomes a continuous source of revenue, it will become a factor that pushes up the overall company profit margin.
The first downside factor is that monetization may not keep pace with the expansion in the number of partner clinics. Even if new partner clinics increase, if the number of contract-processing cases and the utilization rate do not grow sufficiently, sales and CS costs will take precedence, and the profit margin will decline. The second is quality and regulatory risk specific to medical-related services. Trust in safety and quality is important in contract processing services, and if trust is damaged even once, the impact on the business will be significant. The third is that contraction in the D2C business may exceed expectations. The positioning of D2C is shifting toward a cash-generating function, but if lower sales continue for too long, fixed cost absorption and profit contribution will weaken. The fourth is that the share price may anticipate growth expectations too far in advance. In phases when PER appears to be in the mid-20x to 30x range, even with strong results, if some KPIs show signs of slowing, the share price is prone to adjustment.
Items to confirm in the subsequent financial results are the number of partner clinics, the cumulative number of contract processing cases, the average number of contract processing cases and utilization rate, the segment profit margin of the Medical Support Business, the sales decline rate and profit amount of the D2C business, the continuity of the Other business, and operating cash flow. If all of these improve, the Company will be more likely to be evaluated as a medical support company with reproducible growth, rather than as a business transition company.
10. Final investment view
Improvements in PDF-FD KPIs and the establishment of a profit level will push up the share price valuation. This is a stock for which holding or inclusion should be considered positively.
Our investment view on the Company’s shares is that growth in the Medical Support Business is driving an earnings turnaround. If improvement in PDF-FD KPIs continues, a re-rating of the share price should be expected. The turnaround to profitability in 2Q FY2026/9 and the upward revision to the full-year plan indicate that the Company’s business portfolio transition is beginning to show in the numbers. Sales growth in the Medical Support Business, profit secured in the D2C business, and the start-up of the Other business are progressing simultaneously. The overall company operating profit margin is improving. Looking only at the earnings trend over the past five years, the Company appears to be an unstable, small-growth stock. However, the current investment issue is not the past centered on D2C, but the earnings power after the shift to Medical Support as the center.
The share price already factors in a certain level of expectations. The combination of an actual ROE of 2.08%, no dividend, and a PBR of 2.60x is difficult to explain solely on past results. On the other hand, assuming the Company’s planned EPS of 68.62 yen after the upward revision on May 14, PER at the current share price declines to the mid-20x range, which is not an excessive level for a growth company. The median fair share price across the three methods is also close to the current share price, and we view it as broadly within a reasonable range.
The condition for the share price to be evaluated further from here is that expansion in the number of PDF-FD partner clinics increases the number of contract-processing cases and that the utilization rate recovers. In addition, the operating profit of 400 million yen must be recognized by investors not as temporary, but as the profit level from the following fiscal year onward. If the D2C business continues to generate profits even with lower sales, and the Other business becomes established as a high-value-added revenue stream through the medical institution network, the Company’s valuation axis will improve further.
In the short term, the share price is likely to move ahead in response to strong results and the upward revision. In a sharp rise phase, expectations alone may rise before KPIs are confirmed, and a short-term correction may occur. On the other hand, if the number of partner clinics, the number of contract-processing cases, the utilization rate, and the operating profit margin all improve in the subsequent financial results, meaningful returns can be targeted even over a one- to two-year investment period. In conclusion, we do not view the current phase as one requiring excessive caution due to past earnings fluctuations, but rather as a time when holding or inclusion should be considered positively while confirming KPIs in the Medical Support Business.
Key financial data
| Unit: million yen | 2021/9 | 2022/9 | 2023/9 | 2024/9 | 2025/9 | 2026/9 CE |
| Sales | 4,682 | 2,731 | 1,726 | 1,943 | 1,961 | 2,500 |
| EBIT | 149 | -17 | 289 | 62 | 162 | |
| Pretax Income | 141 | -22 | 34 | 57 | 152 | |
| Net Profit Attributable to Owner of Parent | 116 | -57 | 28 | -17 | 44 | 250 |
| Cash & Short-Term Investments | 1,043 | 906 | 1,305 | 1,505 | 1,302 | |
| Total assets | 2,148 | 1,563 | 1,581 | 3,134 | 3,199 | |
| Total Debt | 777 | 646 | 636 | 783 | 731 | |
| Net Debt | -265 | -261 | -669 | -722 | -571 | |
| Total liabilities | 1,347 | 821 | 809 | 993 | 1,108 | |
| Total Shareholders’ Equity | 801 | 743 | 773 | 2,140 | 2,092 | |
| Net Operating Cash Flow | -128 | 169 | 456 | 49 | 136 | |
| Capital Expenditure | 10 | 0 | 0 | 80 | 193 | |
| Net Investing Cash Flow | -6 | -176 | -49 | -76 | -189 | |
| Net Financing Cash Flow | 703 | -129 | -8 | 112 | -150 | |
| ROA (%) | 6.98 | -3.08 | 1.80 | -0.74 | 1.39 | |
| ROE (%) | 24.14 | -7.41 | 3.74 | -1.19 | 2.08 | |
| EPS (Yen) | 38.7 | -19.0 | 9.4 | -5.0 | 12.3 | 70.6 |
| BPS (Yen) | 266.7 | 247.0 | 256.8 | 591.4 | 593.8 | |
| Dividend per Share (Yen) | 0.00 | 0.00 | 0.00 | 0.00 | 0.00 | 0.00 |
| Shares Outstanding (Million shares) | 3.00 | 3.01 | 3.01 | 3.61 | 3.63 |
Source: Calculated by Omega Investment based on FactSet’s standard criteria, rounded to the nearest whole number.
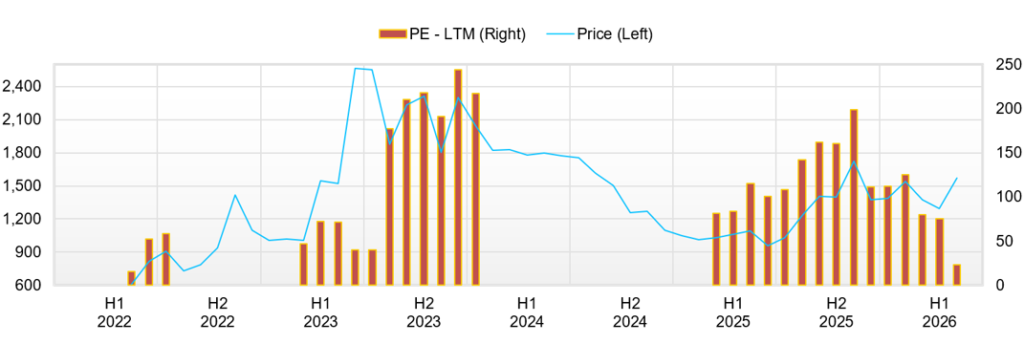
Share price
Financial data (quarterly basis)
| Unit: million yen | 2024/9 | 2025/9 | 2026/9 | ||||||
| 2Q | 3Q | 4Q | 1Q | 2Q | 3Q | 4Q | 1Q | 2Q | |
| (Income Statement) | |||||||||
| Sales | 488 | 490 | 519 | 408 | 427 | 482 | 644 | 408 | 726 |
| Year-on-year | 19.0% | 16.1% | 28.5% | -8.5% | -12.6% | -1.7% | 24.1% | -0.1% | 70.0% |
| Cost of Goods Sold (COGS) | 90 | 117 | 130 | 119 | 123 | 132 | 153 | 125 | 236 |
| Gross Income | 398 | 373 | 389 | 289 | 304 | 349 | 491 | 282 | 490 |
| Gross Income Margin | 81.5% | 76.1% | 75.0% | 70.8% | 71.2% | 72.5% | 76.2% | 69.2% | 67.6% |
| SG&A Expense | 372 | 350 | 268 | 335 | 311 | 330 | 307 | 316 | 318 |
| EBIT | 27 | 23 | 121 | -46 | -7 | 19 | 184 | -34 | 172 |
| Year-on-year | -80.0% | -55.8% | 490.8% | -59.7% | -125.5% | -14.7% | 51.4% | -25.9% | -2643.4% |
| Operating Income Margin | 5.4% | 4.7% | 23.4% | -11.2% | -1.6% | 4.0% | 28.5% | -8.3% | 23.7% |
| EBITDA | 29 | 56 | 159 | -12 | 27 | 53 | 218 | 1 | 206 |
| Pretax Income | 25 | 21 | 120 | -47 | -8 | 21 | 186 | -36 | 170 |
| Consolidated Net Income | -1 | 0 | 93 | -47 | -12 | -2 | 106 | -31 | 167 |
| Minority Interest | 0 | 0 | 0 | 0 | 0 | 0 | 0 | 0 | 0 |
| Net Income ATOP | -1 | 0 | 93 | -47 | -12 | -2 | 106 | -31 | 167 |
| Year-on-year | -100.4% | -100.3% | -374.4% | -57.3% | 1970.4% | -586.6% | 13.5% | -34.5% | -1491.3% |
| Net Income Margin | -0.1% | 0.1% | 17.9% | -11.6% | -2.8% | -0.5% | 16.4% | -7.6% | 23.1% |
| (Balance Sheet) | |||||||||
| Cash & Short-Term Investments | 1,495 | 1,431 | 1,505 | 1,424 | 1,305 | 1,238 | 1,302 | 1,257 | 1,369 |
| Total assets | 3,084 | 3,001 | 3,134 | 3,090 | 3,028 | 2,991 | 3,199 | 3,063 | 3,398 |
| Total Debt | 802 | 755 | 783 | 811 | 766 | 785 | 731 | 678 | 629 |
| Net Debt | -692 | -675 | -722 | -613 | -539 | -453 | -571 | -579 | -740 |
| Total liabilities | 1,039 | 951 | 993 | 996 | 964 | 993 | 1,108 | 993 | 1,154 |
| Total Shareholders’ Equity | 2,045 | 2,050 | 2,140 | 2,095 | 2,064 | 1,998 | 2,092 | 2,070 | 2,243 |
| (Profitability %) | |||||||||
| ROA | -12.46 | -6.50 | -0.74 | 1.98 | 1.13 | 1.05 | 1.39 | 1.96 | 7.46 |
| ROE | -19.59 | -10.11 | -1.19 | 3.32 | 1.67 | 1.56 | 2.08 | 2.90 | 11.13 |
| (Per-share) Unit: JPY | |||||||||
| EPS | -0.2 | 0.1 | 25.7 | -13.0 | -3.3 | -0.7 | 30.0 | -8.7 | 47.2 |
| BPS | 565.1 | 566.4 | 591.4 | 578.8 | 573.4 | 565.3 | 593.8 | 585.9 | 633.2 |
| Dividend per Share | 0.00 | 0.00 | 0.00 | 0.00 | 0.00 | 0.00 | 0.00 | 0.00 | 0.00 |
| Shares Outstanding (million shares) | 3.61 | 3.61 | 3.61 | 3.61 | 3.61 | 3.61 | 3.62 | 3.63 | 3.63 |
Source: Calculated by Omega Investment based on FactSet’s standard criteria, rounded to the nearest whole number.
Financial data (full-year basis)
| Unit: million yen | 2021 | 2022 | 2023 | 2024 | 2025 |
| (Income Statement) | |||||
| Sales | 4,682 | 2,731 | 1,726 | 1,943 | 1,961 |
| Year-on-year | 3.9% | -41.7% | -36.8% | 12.6% | 0.9% |
| Cost of Goods Sold | 909 | 808 | 421 | 494 | 527 |
| Gross Income | 3,774 | 1,923 | 1,306 | 1,449 | 1,434 |
| Gross Income Margin | 80.6% | 70.4% | 75.6% | 74.6% | 73.1% |
| SG&A Expense | 3,624 | 1,939 | 1,016 | 1,388 | 1,273 |
| EBIT | 149 | -17 | 289 | 62 | 162 |
| Year-on-year | 39.1% | -111.6% | -1762.4% | -78.6% | 161.8% |
| Operating Income Margin | 3.2% | -0.6% | 16.7% | 3.2% | 8.2% |
| EBITDA | 155 | -11 | 295 | 166 | 297 |
| Pretax Income | 141 | -22 | 34 | 57 | 152 |
| Consolidated Net Income | 116 | -57 | 28 | -17 | 44 |
| Minority Interest | 0 | 0 | 0 | 0 | 0 |
| Net Income ATOP | 116 | -57 | 28 | -17 | 44 |
| Year-on-year | 17.7% | -149.2% | -149.6% | -161.4% | -353.3% |
| Net Income Margin | 2.5% | -2.1% | 1.6% | -0.9% | 2.2% |
| (Balance Sheet) | |||||
| Cash & Short-Term Investments | 1,043 | 906 | 1,305 | 1,505 | 1,302 |
| Total assets | 2,148 | 1,563 | 1,581 | 3,134 | 3,199 |
| Total Debt | 777 | 646 | 636 | 783 | 731 |
| Net Debt | -265 | -261 | -669 | -722 | -571 |
| Total liabilities | 1,347 | 821 | 809 | 993 | 1,108 |
| Total Shareholders’ Equity | 801 | 743 | 773 | 2,140 | 2,092 |
| (Cash Flow) | |||||
| Net Operating Cash Flow | -128 | 169 | 456 | 49 | 136 |
| Capital Expenditure | 10 | 0 | 0 | 80 | 193 |
| Net Investing Cash Flow | -6 | -176 | -49 | -76 | -189 |
| Net Financing Cash Flow | 703 | -129 | -8 | 112 | -150 |
| (Profitability ) | |||||
| ROA (%) | 6.98 | -3.08 | 1.80 | -0.74 | 1.39 |
| ROE (%) | 24.14 | -7.41 | 3.74 | -1.19 | 2.08 |
| Net Margin (%) | 2.48 | -2.09 | 1.64 | -0.90 | 2.25 |
| Asset Turn | 2.82 | 1.47 | 1.10 | 0.82 | 0.62 |
| Assets/Equity | 3.46 | 2.40 | 2.08 | 1.62 | 1.50 |
| (Per-share) Unit: JPY | |||||
| EPS | 38.7 | -19.0 | 9.4 | -5.0 | 12.3 |
| BPS | 266.7 | 247.0 | 256.8 | 591.4 | 593.8 |
| Dividend per Share | 0.00 | 0.00 | 0.00 | 0.00 | 0.00 |
| Shares Outstanding (million shares) | 3.00 | 3.01 | 3.01 | 3.61 | 3.63 |
Source: Calculated by Omega Investment based on FactSet’s standard criteria, rounded to the nearest whole number.