2026-07-15
Home
Japanese

Omega Investment Co., Ltd.
Innovation Holdings (Investment report – basic)
| Share price (6/25) | ¥1,095 | Dividend Yield (27/3 CE) | 3.1 % |
| 52weeks high/low | ¥960/1,377 | ROE(26/3 act) | 30.3 % |
| Avg Vol (3 month) | 7.5 thou shrs | Operating margin (26/3 act) | 10.2 % |
| Market Cap | ¥19.35 bn | Beta (5Y Monthly) | 0.52 |
| Enterprise Value | ¥12.91 bn | Shares Outstanding | 17.674 mn shrs |
| PER (27/3 CE) | 14.4 X | Listed market | TSE Standard section |
| PBR (26/3 act) | 3.7 X |
| Click here for the PDF version of this page |
| PDF version |
Supported by high ROIC and recurring revenue from the store subleasing business, the Company is in a phase where a medium-term re-rating can be targeted.
Investment conclusion
Positioned to seek a medium-term revaluation, supported by high ROIC and the recurring revenue nature of store subleasing
Innovation Holdings CO., LTD. (the “Company”) is a commercial real estate group that combines the real estate trading business and the rent guarantee business with its core store subleasing business, which specializes in small store properties for restaurants and similar uses, mainly in the Tokyo metropolitan area. For the Company’s shares, we would like to evaluate whether it is achieving both net sales growth and high capital efficiency, driven by an increase in subleasing properties, expansion of the rent guarantee, and profit contribution from real estate trading. In FY3/2026, net sales were 20,012 million yen, operating profit was 2,041 million yen, and profit attributable to owners of parent was 1,355 million yen, with net sales increasing 20.1% YoY, operating profit increasing 50.5% YoY, and net income increasing 31.7% YoY, representing strong growth. The operating profit margin reached 10.2%, and ROE reached the 30% range. We believe the full-year results also confirmed the room for valuation as a high-ROIC, high-ROE company, as we pointed out in the previous 2Q update report.
Our investment view is that the shares are positioned to revalue over the medium- to long-term. In the short term, the Company’s FY3/2027 plan calls for higher net sales of 22,775 million yen, while planning lower operating profit of 1,953 million yen and net income of 1,276 million yen. Therefore, additional catalysts would likely be needed for the share price to return to a high multiple all at once. Nevertheless, this plan for lower profit appears to include the backlash from large, high-profitability real estate trading projects in the previous fiscal year, upfront costs for expanding the number of properties, and Rent guarantee, and the increasing trend in the number of store subleasing properties itself has not broken down. The Company formulates its medium-term management plan each fiscal year on a rolling basis and has set targets for FY3/2029 of net sales of 30,443 million yen, operating profit of 2,899 million yen, and 4,392 store subleasing properties at period-end, assuming steady accumulation from the 3,021 properties recorded in FY3/2026.
In the previous 2Q update, we judged that there was investment appeal in the room for correction of the excessive valuation adjustment. Subsequently, the full-year results became strong evidence supporting the view at the time of 2Q. On the other hand, because the Company’s FY3/2027 plan calls for lower profits, it cannot be said that this is simply a phase in which the upside can be aggressively chased based solely on earnings momentum. Therefore, in this Basic Report, while maintaining the previous view in a bullish direction, we reset the short-term focus to: 1) the pace of net increase in the number of store subleasing properties, 2) expansion of external sales and profitability in the rent guarantee business, 3) the reproducibility of real estate trading, and 4) dialogue with the capital markets regarding the parent-subsidiary listing, low free float, and transition to the Standard Market. The shares are that aim to capture the accumulation of corporate value over the medium- to long-term. Even with an investment period of 1-2 years, if the plan is conservative and profitability is maintained, we expect a revaluation from the current PER in the 14x range and PBR in the high 3x range.
1. Business model and business structure
Specializing in small, well-located, pre-furnished stores, expanding peripheral revenue with store subleasing as the core.
The Company’s mainstay is the store subleasing business, specializing in small-store properties for restaurants and similar uses. By leasing store properties from real estate owners and subleasing them to prospective tenants, the Company combines recurring revenue, such as rent and renewal fees, with Initial revenue, such as key money and the transfer of store fixtures. For restaurants, the burden of independently searching for a well-located property, negotiating directly with the owner, and preparing to open the store, including fixtures and interior work, is significant. By taking on part of this store-opening process, the Company captures demand for openings by small restaurants and accumulates revenue in a recurring manner.
In its mainstay store subleasing business, the Company is proceeding with the procurement of well-located, small, pre-furnished store properties to meet the strong demand for store openings among individuals and small restaurant operators. In addition, the Company is also beginning full-scale handling not only of restaurants but also of well-located upper floors, namely the third floor and above of buildings, occupied by non-restaurant stores such as clinics and gyms. This can be viewed as a move to expand the target domain beyond the conventional model centered on roadside restaurants to small commercial real estate across urban areas.
From an investor’s perspective, organizing the Company’s model reveals three sources of value. The first is the accumulation of property information. Compared with housing and offices, store real estate has stronger individuality for each property, and location, floor level, visibility, fixtures, restrictions on business types, the surrounding environment, and owner intentions greatly affect profitability. By specializing in small stores, the Company continuously accumulates information related to property owners, prospective tenants, real estate brokerage companies, and interior and fixture-related matters. The second is a mechanism for monetizing the store opening and closing cycle. Restaurants are a market in which openings and closings occur to some degree, and the turnover of openings and closings, often viewed as a risk, also presents revenue opportunities for the Company, including new contracts, successor contracts, transfers of store fixtures, and renewal fees. The third is that by combining rent guarantee and real estate trading, the Company can capture multiple revenue streams from store real estate rather than merely subleasing.
In the Company’s Store subleasing business, the main KPIs that drive earnings are the number of subleased properties at the end of the period, the number of new contracts, the number of successor contracts, the cancellation rate, vacancy period, and profit per contract. In FY3/2026, the combined number of new contracts and successor contracts was 607, and the number of store subleasing properties at period-end was 3,021, a net increase of 315 from the end of the previous fiscal year. This is important as the starting point toward 3,416 in FY3/2027, 3,876 in FY3/2028, and 4,392 in FY3/2029, as set out in the medium-term plan.
Another characteristic of the store subleasing business is the combination of recurring revenue and upfront revenue. Recurring revenue tends to increase steadily as the number of properties accumulates, thereby supporting the Company’s earnings base. Meanwhile, upfront revenue fluctuates depending on the number of new contracts and successor contracts, the value of fixtures, and the level of key money. It therefore becomes a factor that boosts profit in a growth phase. In phases when restaurant store-opening demand is strong and needs increase for well-located, small, pre-furnished properties, the Company’s functions in collecting and assessing property information, subleasing, and arranging successor contracts are likely to be reflected in earnings.
Subsidiary Asset Innovation CO., LTD. handles the Real estate trading business. The Company is proceeding to strengthen its sales force and develop existing employees into effective contributors, while focusing on commercial real estate development in the six central wards of Tokyo. In FY3/2026, amid a rising trend in commercial real estate prices in central Tokyo, the Company sold seven properties, acquired six, and held three at period-end. There were multiple sales of large, highly profitable properties, and the business grew substantially, with net sales of 2,209 million yen and segment profit of 492 million yen.
Unlike the Store subleasing business, the real estate trading business has profits in each fiscal year that are affected by the timing of sales and the profitability of each property. Therefore, it should not be overestimated as recurring revenue. However, given that the Company specializes in store real estate, the business differs in nature from general real estate trading by leveraging property information, location evaluation, tenant demand, and its network of prospective tenants. If the information network cultivated in Store subleasing works in procurement capabilities and exit strategies, Real estate trading can serve to expand the Company’s store real estate platform rather than be a one-off profit.
Safety Innovation CO., LTD, handles the rent guarantee business. Revenue from this business is included in the store subleasing business for reportable segment purposes. Rent guarantee is a business that enters into guarantee-entrustment agreements with lessees of commercial real estate, such as store-opening operators, and receives guarantee fees as consideration for guaranteeing payments to lessors. Within the Group, tenants that conclude sublease agreements with Tenpo Innovation CO., LTD. are, in principle, in a relationship in which they use the guarantee of Safety Innovation CO., LTD. However, this is not of a nature that directly supports property procurement or store operations, but is positioned as a credit-supplementation and risk-management function attached to sublease agreements. However, this is not intended to directly boost property sourcing or store operation support, but rather to be positioned as a credit enhancement and risk management function accompanying sublease agreements. On the other hand, the growth potential of this business is not limited to projects within the Group. The Company has indicated a policy of actively acquiring projects outside the Group through a rent-guarantee specialist in commercial real estate, and also proceeding with the opening of branches in major regions and strengthening its sales personnel. Therefore, the rent guarantee business should not be evaluated in the same operation as store subleasing or real estate trading, but is an area in which profitability and risk management capabilities should be confirmed as a growth domain, including the expansion of external sales, through the number of guarantee contracts, external sales ratio, accident rate, and recovery rate.
2. FY3/2026 results and medium-term plan
Full-year results were strong, but FY3/2027 is planned for lower profits, reflecting growth investments and the impact of trading.
The FY3/2026 results were strong in both net sales and profit. Net sales were 20,012 million yen, operating profit was 2,041 million yen, ordinary profit was 2,264 million yen, and profit attributable to owners of parent was 1,355 million yen, achieving a profit growth rate that exceeded the past growth trend. The gross profit margin rose to the 23% range, and the operating profit margin rose to the 10% range, improving from the 8% range in FY3/2025.
Operating cash flow also increased substantially, and the fact that profit growth was accompanied by cash generation is positive. The store subleasing business recorded net sales of 17,803 million yen and segment profit of 1,548 million yen, with net sales increasing 17.4% YoY and segment profit increasing 26.9% YoY. The increase in the number of subleased properties at the end of the period to 3,021 and the growth in sublease contracts to 607 supported earnings. The real estate trading business recorded net sales of 2,209 million yen and segment profit of 492 million yen, with net sales increasing 47.6% YoY and segment profit increasing 261.4% YoY, representing substantial growth. The FY3/2026 results can be understood as a period in which companywide profit was pushed up another level by the addition of high-margin projects in real estate trading, alongside stable growth in store subleasing.
On the other hand, the Company’s FY3/2027 plan calls for net sales of 22,775 million yen, operating profit of 1,953 million yen, ordinary profit of 1,986 million yen, and profit attributable to owners of parent of 1,276 million yen. Although net sales are expected to increase 13.8%, operating profit is expected to decline 4.3%, and net income is expected to decline 5.9%. On the surface, this appears to be a growth slowdown, but taking into account that multiple large and high-profitability projects contributed in real estate trading in FY3/2026 and that upfront costs accompanying the increase in personnel in charge of property management and in the Rent guarantee business, branch openings, and business expansion are expected, the Company’s plan should be viewed as a rolling plan that includes conservativeness.
Looking at the rolling medium-term plan figures, starting from the FY3/2026 results of net sales of 20,012 million yen and operating profit of 2,041 million yen, the Company has set targets of net sales of 22,775 million yen and operating profit of 1,953 million yen in FY3/2027, net sales of 26,225 million yen and operating profit of 2,360 million yen in FY3/2028, and net sales of 30,443 million yen and operating profit of 2,899 million yen in FY3/2029. Operating profit is planned to decline temporarily in FY3/2027, then expand again in FY3/2028 and FY3/2029. The number of subleased properties at the end of the period is also planned to increase from 3,021 to 3,416, 3,876, and 4,392, with the main driver of medium-term growth being the increase in the number of store subleasing properties.
What is important in viewing this medium-term plan is not to focus only on the profit decline in FY3/2027. The Company reviews its medium-term plan each fiscal year on a rolling basis, reflecting the FY3/2026 results and changes in the operating environment. In other words, the FY3/2027 plan is highly likely to be designed as an investment year that addresses the backlash from high-margin projects in the previous fiscal year while advancing the expansion of the number of store subleasing properties, the expansion of Rent guarantee, the division of labor in real estate trading, and improvements in reproducibility. What investors should watch is not the temporary decline in operating profit, but whether the net increase in the number of properties continues, whether the gross profit margin is maintained at a high level, whether external sales of Rent guarantee begin to contribute to earnings, and whether Real estate trading shifts from dependence on large projects to organizational reproducibility.
3. Earnings structure, major KPIs, and monitoring items
The number of properties, signed contracts, Rent guarantee, and the profit margin of real estate trading hold the key to share price valuation
The Company’s earnings structure is based on recurring revenue from the store subleasing business, with Real estate trading and rent guarantee pushing up profit growth. In the store subleasing business, the greater the number of subleased properties at the end of the period, the broader the revenue base becomes. If the number of new contracts and successor contracts increases, Initial revenue also increases. Tenant cancellations occur to some degree, but the Company has a model of continuing to monetize properties by replacing tenants with the next tenant through successor contracts, which differs in nature from the vacancy risk in general leasing businesses. Therefore, the Company’s most important KPIs are the number of subleased properties at the end of the period, the number of new contracts and successor contracts, the number of net increases, profit per contract, progress in successor contracts, and rent collection status.
In the FY3/2026 results, the number of subleased properties at the end of the period was 3,021, a net increase of 315 from the end of the previous fiscal year. In the medium-term plan, the Company plans 3,416 properties in FY3/2027, 3,876 in FY3/2028, and 4,392 in FY3/2029. This means the Company assumes a net increase of 395 properties in FY3/2027, 460 in FY3/2028, and 516 in FY3/2029. This plan includes some acceleration relative to past results, and achieving it will require simultaneous progress in expanding sales personnel, improving the efficiency of procurement and leasing, strengthening the property management structure, and executing procurement-area strategies.
In the store subleasing business, as the number of properties increases, stability increases. In contrast, the management burden also increases. Hiring personnel in charge of property management is viewed not merely as an increase in costs, but as an investment to protect operational quality as the number of properties expands. Whether the Company can smoothly handle prospective tenants, owners, property management, rent collection, contract renewals, and successor contracts at the time of cancellation will affect its profitability. This is an area in which the operation of store real estate itself becomes the competitive factor, rather than a general real estate leasing business.
Although the rent guarantee business is not yet disclosed as an independent segment, its importance is increasing in the Company’s growth model. Rent guarantee serves as a credit supplement for rent payments by store-opening operators and others and receives guarantee fees as consideration. In addition, if external sales extend beyond projects within the Group, the business may be evaluated as a revenue source independent of the store subleasing business. Branch openings and personnel increases in major regions tend to result in upfront costs in the initial stage, but if the guarantee balance, number of guarantee contracts, external sales ratio, accident rate, and recovery rate stabilize, the capital markets may have room to re-evaluate the Company as a platform company around store real estate.
The real estate trading business is both an upside driver for profits and a driver of earnings volatility. In FY3/2026, multiple large, highly profitable property sales substantially increased profit. On the other hand, the backlash from these high-margin projects is considered part of the background of the FY3/2027 plan, which calls for lower profit. The Company has a policy of separating procurement and sales, increasing the number of procurements and profit margins, expanding sales channels, and advancing an organizational response by sharing negotiation status and know-how. Investors need to confirm the number of properties sold, acquired, and held at period-end, the gross profit margin on trading, and the holding period.
Upside factors are: 1) the net increase in the number of store subleasing properties exceeding the medium-term plan, 2) external sales of rent guarantee starting up early, 3) high-margin projects being reproduced in Real estate trading, 4) handling of upper-floor and non-restaurant stores expanding opportunities for signed contracts and contributing to accumulation in the number of store subleasing properties, and 5) visibility on room for dividend increases in line with profit growth under the payout ratio policy of 30-40%. Downside factors are: 1) store-opening demand slowing due to deterioration in the restaurant market environment and other factors, causing the pace of signed contracts for new contracts and successor contracts and contract terms to fall below assumptions, 2) rent spread declining due to procurement competition for high-quality properties and increases in rent levels, 3) timing of sales and property profitability in Real estate trading falling below assumptions, 4) an increase in the accident rate or decline in the recovery rate in the rent guarantee business, and 5) personnel increases and branch-opening costs preceding expectations by more than assumed.
In subsequent earnings results, looking only at net sales and operating profit will not be sufficient. We would like to check the number of subleased properties at the end of the period, the number of sublease contracts, segment profit margins, the expansion status of rent guarantee, the number of properties sold and acquired in real estate trading, operating cash flow, changes in guarantee deposits and deposits received for guarantees, the equity ratio, and actual financial safety together. In particular, because FY3/2027 is a plan for lower profit, even if operating profit looks temporarily weak, if the KPIs for the number of properties and the guarantee business are strong, the medium-term growth scenario will be maintained. Conversely, if the net increase in the number of properties slows and profit margins also decline, market confidence in the Company’s high-ROIC model is likely to retreat.
4. Capital efficiency, cash flow, and shareholder distribution
High ROE and net cash are strengths. View together with the parent company’s stability and the constraints of low free float
The Company’s capital efficiency is high. In FY3/2026, ROE was in the 30% range, the operating profit margin was in the 10% range, and ROIC was also high. It can be confirmed that the business has earning power that greatly exceeds the cost of capital. Operating cash flow increased substantially, and free cash flow was also solid, with the recurring revenue from store subleasing and the profit contribution from real estate trading also contributing to cash generation.
That said, the Company’s balance sheet appears somewhat weak when viewed solely through the lens of the general equity ratio. The equity ratio at the end of FY3/2026 was in the 26% range. However, in the store subleasing business, guarantee deposits, deposits received for guarantees, and prepaid and unearned rent are large, and formal liabilities tend to expand. Therefore, when assessing financial risk, it is necessary to consider cash and deposits, net debt, the relationship between guarantee deposits and deposits received for guarantees, and operating cash flow. Cash and deposits at the end of FY3/2026 are substantial, and, at present, the financial position does not constrain growth.
In the shareholder distribution, CROPS CORPORATION is the largest shareholder, holding 56.83%, and is the Company’s parent company. As KDDI’s primary agent, CROPS CORPORATION has as its core business a mobile communications business that operates au Style, au shops, and UQ Spot stores mainly in the Tokai and Kanto regions, and is also a corporate group that engages in staffing, building maintenance, wholesale, overseas businesses, and other businesses. Currently, Innovation Holdings’ Store subleasing business, real estate trading business, and rent guarantee business are also part of the CROPS group’s business portfolio.
Looking at the background to becoming a parent company, Tenpo Innovation, the Company’s predecessor, was spun off from a restaurant store opening and closing support business, after which CROPS CORPORATION acquired all of its shares in July 2009, making it a consolidated subsidiary of CROPS CORPORATION. Subsequently, the Company expanded the Store subleasing business, became listed, transitioned to a Holdings company structure in October 2024, and changed its trade name to Innovation Holdings. In other words, CROPS CORPORATION is not a short-term financial investor but rather a parent company that has long supported the Company’s growth.
This shareholder composition has both merits and demerits. The positive aspect is that the parent company’s holding is large and, as a stable shareholder, it is likely to support medium- to long-term continuity of management. CROPS CORPORATION has formed a diversified business group, and the Company is positioned within it as a highly profitable real estate-related business. The fact that the Company can pursue business expansion without being affected by short-term market fluctuations is positive. On the other hand, the free-float ratio is low, making it difficult for institutional investors to take meaningful positions. Thin trading volume, difficulty attracting index-linked funds, and the market discount associated with the parent-subsidiary listing structure are likely to suppress upside in valuation.
The Company paid a dividend of 34 yen in FY3/2026 and also forecasts 34 yen in FY3/2027. The payout ratio was 42.1% in FY3/2026 and is forecast at 44.7% in FY3/2027, while the Company plans a payout ratio of 30-40% from FY3/2028 onward. As a high-ROE company, it has significant room to use internal reserves for growth investments. Nevertheless, given the low free float, parent-subsidiary listing, and thin liquidity, dividend continuity is important as support for the share price. Over the medium term, room for dividend increases, the policy on the use of treasury shares, and explanations regarding capital relationships with the parent company will affect valuation upside.
5. Transition to the Standard Market
A realistic choice based on liquidity criteria. Neutral to corporate value, but issues remain for share price valuation.
The Company changed its market segment from the TSE Prime market to the Standard Market as of March 24, 2026. The Tokyo Stock Exchange’s list of market segment changes also confirms that the Company transitioned from the Prime Market to the Standard Market as of the same date.
In connection with the approval of the market segment change to the Standard Market, the Company withdrew its plan for compliance with the listing maintenance criteria for the Prime Market. In its disclosure, the Company states that the impact of this transition on major business partners is minor and that it will continue to endeavor to enhance corporate value by expanding its main businesses.
This market change does not impair the business’s value. The Company’s fundamentals, such as the number of properties in the Store subleasing business, expansion of Rent guarantee, profitability of Real estate trading, and operating cash flow, do not change directly due to the market segment. Rather, for the Company, whose parent company holding is large and whose free float is limited, it is considered that there were certain constraints in continuing to satisfy the Prime Market criteria related to tradable shares. The transition to the Standard Market can be viewed as a choice to align the capital structure with the market segment.
On the other hand, from an equity investment perspective, this is likely to be received somewhat negatively in the short term. By leaving the Prime Market,the shares are more likely to fall outside the investment universe of funds and some institutional investors, potentially weakening its liquidity and supply-demand valuation. In particular, given the Company’s high parent-company holding ratio and a thin free float, concerns about liquidity due to the market change cannot be ignored.
Therefore, the transition to the Standard Market is neutral for corporate value but may remain a discount factor in share price valuation. However, this is not necessarily a permanent negative. If the Company, as a Standard Market-listed company, can make its policies regarding earnings growth, dividends, capital policy, relationship with the parent company, and liquidity improvement, and communicate those details to investors in an easy-to-understand manner, investors will likely place more emphasis on profitability and shareholder returns than on the market segment. Going forward, the important point affecting share price valuation will be not to treat the market segment change merely as a defensive issue, but to focus on how the Company will enhance shareholder value through management decisions as a high-ROE, high-ROIC company.
6. Share price trend and growth expectations factored in by the market
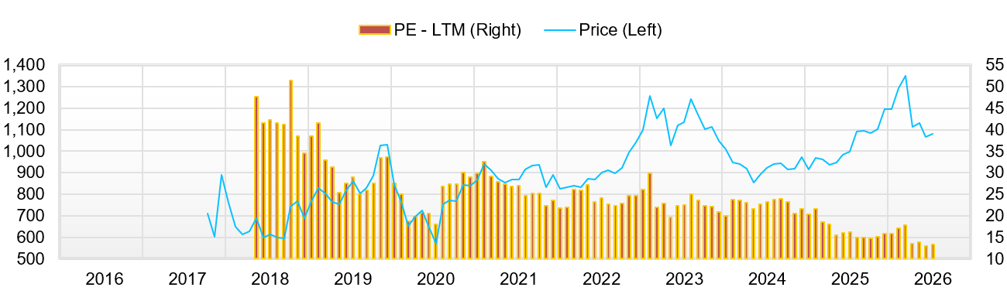
EPS growth is factored in, but expectations are not excessive
Looking at the Company’s shares over roughly the past five years, while business performance has grown substantially, the share price has not fully reflected that growth. EPS was 32.3 yen in FY3/2020 and rose to the 80-yen range in FY3/2026, increasing by about 2.5x over six years. This represents EPS growth in the 16% range on an annualized basis. Meanwhile, although the share price has risen from the 2020 low, since 2023 it has been limited to a range of around 1,000-1,200 yen, and recently the shares have traded around 1,080-1,100 yen. The main reason the share price has struggled relative to earnings growth is the decline in PER. Previously, there were phases when the shares were valued at a higher PER as a high-ROE small-cap growth stock, but now the forecast PER has declined to the 14x range.
The background to the lackluster share price includes, first, the fact that its attributes as a small-cap, real estate, and domestic-demand service name did not easily fit with the market led in recent years by large-cap, export, and semiconductor-related stocks. Second, with respect to the Store subleasing model, risks related to successor contract terms at the time of tenant replacement, rent spread, and deterioration in the restaurant market environment tend to be in focus. Third, the parent-subsidiary listing, low free float, thin trading volume, and caution toward MS warrants have suppressed upside in the fundamental evaluation. Fourth, the transition to the Standard Market reduced the liquidity premium for a Prime Market stock, which may also be a factor suppressing short-term valuation. Fifth, because FY3/2027 is a plan for lower profit, the strong FY3/2026 results have not been directly connected to expectations for higher profit in the following fiscal year.
On the other hand, the EPS growth expectations factored into the current share price are not excessively high. Assuming a forecast PER of 14.2x, an actual PBR of 3.75x, forecast ROE of 27.2%, forecast EPS of 76.1 yen, and forecast dividend of 34 yen, the payout ratio is approximately 44.7%, and the internal retention ratio is approximately 55.3%. Multiplying ROE of 27.2% by the internal retention ratio of 55.3% gives an estimated sustainable growth rate of approximately 15.0%. This is slightly below the EPS CAGR in the roughly 16% range from FY3/2021 to FY3/2026, and the market appears to be factoring in growth close to the Company’s past results to a certain degree, but not placing optimism that greatly exceeds that.
This point is important for the investment view. If the market were factoring in EPS growth above 20%, the FY3/2027 plan for lower profit would be prone to becoming a major disappointment. However, the current PER in the 14x range and PBR in the high 3x range are not extremely high levels for a high-ROE company, and should rather be viewed as levels that have factored in to a reasonable degree the low free float, parent-subsidiary listing, real estate-related risks, transition to the Standard Market, and the plan for lower profit in the next fiscal year. If re-growth in operating profit from FY3/2028 onward is confirmed in line with the medium-term plan, the share price will likely test the upside through both EPS growth and multiple recovery.
The short-term share price drivers are how profit progresses relative to the Company’s plan in Q1 and Q2 of FY3/2027. In particular, the market will likely seek to determine whether operating profit merely appears weak in line with the plan for lower profit, or whether there is a change in the number of properties, the guarantee, or the trading profit margin. If the increase in the number of properties is steady, the gross profit margin is maintained at a high level, and growth in rent guarantee becomes visible, the short-term decline in profit may be accepted as an investment for medium-term growth. Conversely, if the net increase in the number of properties slows, profit from real estate trading also declines, and only costs precede, the share price is likely to adjust more due to a decline in confidence in the business model than to PER.
7. Consideration of fair share price
The median of the three methods is around 1,300 yen. There is medium-term room for revaluation in the current share price.
The fair share price is confirmed by three methods: PBR, DCF, and ROIC. The details of the calculation process are omitted, but the assumptions and results are organized briefly.
Under the PBR method, using BPS at the end of FY3/2026 as the starting point, we set a range of 3.5-4.5x PBR for companies that continue to have high ROE. The current PBR of 3.75x is toward the lower end of this range, and assuming an ROE of 27-30% can be maintained, a valuation in the low 4x range for PBR can be adequately explained. The fair share price range under this method is approximately 1,030-1,320 yen, with a median of approximately 1,180 yen.
Under the DCF method, we assume free cash flow in FY3/2026 as the starting point, a medium-term growth rate of 6-10%, WACC of around 8%, a terminal growth rate of 1%, and net cash. Given the recurring-revenue nature of store subleasing and the growth potential of rent guarantee, the DCF method is likely to indicate higher shareholder value than the PBR method. The fair share price range under this method is approximately 1,670-1,940 yen, with a median of approximately 1,810 yen. However, because DCF is highly sensitive to the growth rate and the cost of capital, the upper value should be treated as a reference.
Under the ROIC method, assuming ROIC in the high 20% range, WACC of 7-9%, and invested capital, excess return is reflected in corporate value. Because the Company’s ROIC greatly exceeds WACC, PBR is theoretically unlikely to sink to around 1x, and a premium that reflects capital efficiency is justified. The fair share price range under this method is approximately 1,150-1,450 yen, with a median of approximately 1,300 yen.
Combining the three methods, the fair share price range is generally 1,030-1,940 yen, and the median of the three methods is approximately 1,300 yen. Considering that the current share price is around 1,080-1,100 yen, this suggests upside of slightly less than 20% relative to the median. Because the lower end of the range is near the current share price, the short-term downside risk is not negligible. But considering the high ROE, net cash, dividend yield, and accumulation of store subleasing properties, we would like to view the current share price as discounting risk factors to a reasonable degree, rather than fully factoring in medium-term growth.
The conditions for the share price to move from here toward 1,300 yen are: 1) the FY3/2027 plan for lower profit proving to be a temporary investment and trading backlash, 2) re-growth in operating profit from FY3/2028 onward becoming visible, 3) the net increase in the number of store subleasing properties following the medium-term plan line, 4) the expansion of external sales of Rent guarantee becoming profitable, and 5) progress in explanations of capital policy regarding the parent-subsidiary listing, free float, MS warrants, and use of treasury shares. Conversely, if the decline in operating profit is not temporary and is accompanied by a slowdown in property number growth or deterioration in the profitability of the rent guarantee, the valuation may return to a level close to the lower end of the PBR method.
8. Risks and points of focus going forward
How the Company passes through the FY3/2027 plan for lower profit is the first touchstone.
We would like to consider the Company’s risks by dividing them into business risk, earnings volatility risk, and capital market risk. Business risks include deterioration in the restaurant market environment, a decline in store-opening demand, procurement competition for high-quality properties, and deterioration in contract terms and rent spread at the time of successor contracts. In the store subleasing model, as the number of properties increases, the recurring revenue nature intensifies. If the operating environment for store-opening operators deteriorates, it is necessary to more carefully assess the profitability of new and successor contracts, the rent spread, and the rent collection status. However, tenant replacement can also be a revenue opportunity through successor contracts. Therefore, it should not be viewed the same way as vacancy and cancellation risk in general leasing businesses. In particular, during periods when increases in raw material, utility, and personnel costs put pressure on restaurant profitability, the Company’s tenant base may also be affected.
As an earnings volatility risk, there is profit volatility in the real estate trading business. In FY3/2026, multiple large, high-profitability property sales contributed, but the same profit margin level will not necessarily be replicated in every fiscal year. If real estate market conditions deteriorate, selling prices and turnover periods will be affected. Rising interest rates also affect property prices, buyers’ investment profitability, and the lending stance of financial institutions. The Company has a policy of advancing the procurement and sales division, expanding sales channels, and sharing know-how across the organization. The focus will be on whether these efforts increase the reproducibility of profit.
Regarding the rent guarantee business, while there is significant growth potential, the guarantee accident rate, recovery rate, and screening structure are important. Even if guarantee contracts increase, a rising accident rate will reduce the profit margin. Rent guarantee specialists in commercial real estate may have a different risk profile from that of residential guarantee specialists. As we expand external sales, we would like to confirm the balance among screening, recovery, and guarantee fee rates.
Capital market risks include the parent-subsidiary listing structure, low free float, thin trading volume, caution toward MS warrants, and changes in the investor base due to the transition to the Standard Market. Even if business performance is favorable, it tends to take time for shares for which investors find it difficult to secure sufficient liquidity to be re-rated. In addition, if explanations regarding dilution and the use of treasury shares are insufficient, caution on the supply-demand front will remain. Therefore, as a company, it is important to make management decisions that are informed by market evaluation, with respect not only to business strategy but also to capital policy, the relationship with the parent company, shareholder returns, and liquidity improvement, and to present these details to investors in an easy-to-understand manner.
Points of focus going forward are, first, the Q1 FY3/2027 results. Even if operating profit weakens in line with the plan for lower profit, if the number of properties, the number of signed contracts, and gross profit margin are strong, investors are likely to maintain confidence in medium-term growth. Second, progress in the Rent guarantee business. We would like to confirm how external sales, branch openings, and personnel increases will lead to net sales and profit. Third, the reproducibility of real estate trading. If the number of sales, the number of acquisitions, the number of properties held, and the profit margin stabilize, this business will be evaluated not merely as a one-off profit but as a driver of corporate value. Fourth, capital policy. In addition to the continuation of the 34 yen dividend, how profit growth and returns are balanced under the payout ratio policy of 30-40% from FY3/2028 onward will support the share price.
9. Final investment view
Seek a revaluation over the medium to long term. In the short term, confirm passage through the FY3/2027 plan for lower profit.
Our investment view on the Company’s shares is that they are positioned for a revaluation over the medium- to long-term. The FY3/2026 results were strong, with a 20.1% increase in net sales, a 50.5% increase in operating profit, and ROE in the 30% range, supported by an increase in the number of properties in the Store subleasing business, high-margin projects in real estate trading, and expansion of Rent guarantee. Operating cash flow also increased substantially, and net cash is also ample. Looking only at this, the Company is a high-ROE, high-ROIC, and sustainably growing company that could receive a higher valuation than the current PER in the 14x range and PBR in the high 3x range.
On the other hand, FY3/2027 is a plan for lower profit. It would not be appropriate to ignore this and take a uniformly bullish stance. Investors need to determine how far the high-margin real estate trading in FY3/2026 was one-off in nature and whether the cost increase in FY3/2027 will lead to future expansion in the number of properties and growth in rent guarantee. Therefore, in the short term, this is a phase to confirm progress versus the plan and KPIs in the Q1 and Q2 results. However, we would like to position this not as a defensive wait-and-see stance, but as a holding and revaluation phase accompanied by reconfirmation of the medium-term growth scenario.
The median fair share price under the three methods is approximately 1,300 yen, indicating an upside of slightly less than 20% from the current share price of around 1,080-1,100 yen. DCF indicates an even higher value, but taking into account the parent-subsidiary listing, low free float, volatility in real estate trading, transition to the Standard Market, and the FY3/2027 plan for lower profit, we believe around 1,300 yen is a realistic revaluation level first. Thereafter, if re-growth in operating profit from FY3/2028 onward, progress toward 4,000 properties, expansion of external sales of rent guarantee, and strengthened explanations of capital policy all come together, the valuation range may expand further upward.
In conclusion, the Company is not a short-term theme stock but a name that accumulates corporate value over the medium- to long-term, as a niche revenue company specializing in commercial real estate. The FY3/2027 plan for lower profits is a factor suppressing short-term upside in the share price. However, as long as growth in the number of properties and high ROIC are maintained, the current share price level continues to appeal for medium-term returns. Going forward, the center of the investment view on the Company’s shares will be to follow the figures in the Company’s rolling medium-term plan not merely as net sales and profit targets, but by breaking them down into execution KPIs consisting of the number of store subleasing properties, rent guarantee, the reproducibility of real estate trading, and progress in capital policy.
【Appendix 1: Major news over the past 12 months】
| Date | Disclosure/news | Content | View for investment decision |
| June 25, 2025 | Matters Concerning Controlling Shareholders, etc. | Disclosed the relationship with the controlling shareholder, with CROPS CORPORATION as the parent company. The extent of the parent company’s holding was confirmed again. | The presence of a stable shareholder contributes to downside resilience, while a liquidity discount stemming from the parent-subsidiary listing and low free float persists. |
| June 26, 2025 | Corporate Governance Report | Updated information on the governance structure, relationship with the controlling shareholder, protection of minority shareholders, etc. | For the Company, which has a parent-subsidiary listing structure, explanations of minority shareholder protection and independence will remain an ongoing IR issue. |
| July 14, 2025 | IR discussion video released. | Released an IR discussion video with the investment influencer “Mousou Suru Kessan.” | With more than 660,000 views, this helped improve investor recognition and business understanding, particularly among individual investors. |
| August 8, 2025 | FY3/2026 Q1 financial results and financial results presentation materials | Announced Q1 results. Expansion in the number of properties and improvement in profitability in the store subleasing business were confirmed. | Initial confirmation material for favorable full-year results. The number of properties, gross profit margin, and operating profit margin became key focus areas for investors. |
| September 9, 2025 | Receipt of Dividends from Consolidated Subsidiary | Received dividends from a subsidiary. Recorded as non-operating income in non-consolidated results. | The direct impact on consolidated results is limited, but this is material, showing profit accumulation within the Group and its ability to recover funds. |
| September 12, 2025 | IR discussion video released. | Released an IR discussion video with strategist Tomohiro Okawa and freelance announcer Hiroko Ohashi. | Part of IR strengthening, including for individual investors. As a low-liquidity stock, improving recognition is important. |
| November 13, 2025 | FY3/2026 Q2 financial results | Announced cumulative Q2 results. Both net sales and profit were trending above plan. | Results confirming improved profitability and the sustainability of high ROIC. They became a basis for the revaluation of the share price. |
| November 13, 2025 | Difference from Q2 Earnings Forecast, Revision of Full-Year Earnings Forecast, and Year-End Dividend Forecast | Interim results exceeded the plan, and the Company revised its full-year earnings forecast and year-end dividend forecast upward. | Positive material showing both earnings momentum and a shareholder return stance. This supported the previous update’s bullish view. |
| November 18, 2025 | Extension of Exercise Restriction Period for Third Series of Stock Acquisition Rights | Extended the exercise restriction period for stock acquisition rights issued through third-party allotment utilizing treasury shares. | Although there is flexibility in financing and the use of treasury shares, the market is likely to view this as dilution and supply-demand concerns. |
| November 19, 2025 | Q2 financial results presentation materials released. | Released financial results presentation materials. Explained the progress of store subleasing, real estate trading, and rent guarantee. | Materials that organize and present the Company’s growth drivers to investors. They serve as basic materials for the business explanation in the Basic Report text. |
| December 26, 2025 | IR discussion video released. | Released an IR discussion video with professional soccer player Masato Morishige and freelance announcer Shiho Sada. | Continuation of awareness-raising measures. These measures are intended to contribute to broadening the base of individual investors, rather than targeting institutional investors. |
| February 12, 2026 | FY3/2026 Q3 financial results | Announced cumulative Q3 results. Ordinary profit and profit increased substantially on a cumulative April-December basis. | Results that further increased expectations for full-year upside. Expansion in the number of properties and profit contribution from Real estate trading became catalysts for the share price. |
| February 12, 2026 | Q3 financial results presentation materials released. | Released Q3 financial results presentation materials. | Material for confirming KPI progress toward achievement of the medium-term plan. The focus is on the number of properties, the number of contracts, and the reproducibility of trading projects. |
| March 2, 2026 | Monthly Exercise Status of Third Series of Stock Acquisition Rights | Disclosed the monthly exercise status of the stock acquisition rights. | Because this relates to share-price supply and demand, the market watches exercise progress and potential selling pressure. |
| March 17, 2026 | Approval of Market Segment Change to the Standard Market and Withdrawal of Plan for Compliance with Prime Market Listing Maintenance Criteria | The transition from the Prime Market to the Standard Market was approved, and the plan for compliance with Prime Market listing maintenance criteria was withdrawn. | Neutral to business value, but a short-term discount factor in terms of liquidity and investor base. We view this as a realistic choice to align with a capital structure in which the parent company holding is large. |
| March 24, 2026 | Market segment changed to the Standard Market | Transitioned from the TSE Prime market to the Standard Market. | While the shares are more likely to fall outside the scope of Prime-linked funds, the evaluation will, going forward, center on profitability, dividends, and the explanatory power of capital policy. |
| April 1, 2026 | Monthly Exercise Status of Third Series of Stock Acquisition Rights | Continued to disclose the exercise status of the stock acquisition rights. | This is a phase in which the market factors in dilution concerns and supply-demand factors. It could become a factor suppressing share price upside. |
| May 13, 2026 | FY3/2026 financial results | Announced net sales of 20,012 million yen, operating profit of 2,041 million yen, ordinary profit of 2,264 million yen, and profit attributable to shareholders of the parent company of 1,355 million yen. Results landed with substantial increases in net sales and profit. | FY3/2026 results were very strong. Expansion of Store subleasing, high-margin projects in Real estate trading, and contribution from Rent guarantee were confirmed. |
| May 13, 2026 | Notice Regarding Medium-Term Management Plan and Dividend Forecast | Reviewed the medium-term plan on a rolling basis. Plans net sales of 30,443 million yen, operating profit of 2,899 million yen, and 4,392 store subleasing properties at period-end in FY3/2029. The FY3/2027 dividend forecast is 34 yen. | FY3/2027 is a plan for lower profits, but it shows re-growth starting in FY3/2028. From a medium-term investment perspective, the focus is on the feasibility of expanding the number of properties and profit re-growth. |
| May 15, 2026 | Notice Regarding Dividends of Surplus | Resolved the year-end dividend. | The implementation of the 34 yen dividend confirmed the shareholder-return stance. For a low-liquidity Standard Market stock, the share price support effect of dividends is important. |
| May 21, 2026 | FY3/2026 financial results presentation materials released | Supplemented the explanation of full-year results, FY3/2027 earnings forecasts, the Medium-Term Management Plan, and progress by main business. | While confirming the highly profitable landing in FY3/2026, FY3/2027 is a plan for lower profit. This is a phase to assess the accumulation of store subleasing properties and the likelihood of executing the medium-term plan, rather than focusing on short-term profit. |
【Appendix 2: Shareholder distribution】
| Category | Holding ratio | Number of shares held | View |
| CROPS CORPORATION | 56.83% | 10,044.4 thousand shares | Parent company. While it contributes to downside resilience as a stable shareholder, it also becomes a factor behind the parent-subsidiary listing and low free-float discount. |
| Treasury shares | 5.10% | 900.6 thousand shares | Explanations of capital policy, including the use of treasury shares and the relationship with stock acquisition rights, affect share price valuation. |
| Directors and employee shareholding association, etc. | 3.59% | 634.1 thousand shares | Holdings by management and employees indicate a certain alignment of interests. |
| Other identifiable institutional investors, etc. | 0.03% | 4.9 thousand shares | Institutional investor holdings are extremely limited. Constraints remain on liquidity and the speed of re-rating. |
| Free float and others | 34.46% | — | Portion that can be traded in the market. |
| Total | 100.00% | — | Stable-type shareholder composition with a large parent company holding. |
Key financial data
| Unit: million yen | 2022/3 | 2023/3 | 2024/3 | 2025/3 | 2026/3 | 2027/3 CE |
| Sales | 11,415 | 13,070 | 14,264 | 16,659 | 20,012 | 22,775 |
| EBIT (operating profit) | 910 | 1,200 | 960 | 1,356 | 2,041 | 1,953 |
| Pretax Income | 987 | 1,267 | 992 | 1,489 | 2,262 | |
| Net Profit Attributable to Owner of Parent | 662 | 886 | 666 | 1,029 | 1,356 | 1,276 |
| Cash & Short-Term Investments | 3,468 | 3,501 | 3,331 | 4,284 | 5,791 | |
| Total assets | 11,912 | 12,882 | 13,710 | 15,666 | 18,664 | |
| Total Debt | 0 | 0 | 0 | 103 | 548 | |
| Net Debt | -3,468 | -3,501 | -3,331 | -4,181 | -5,243 | |
| Total liabilities | 8,584 | 9,687 | 10,386 | 11,649 | 13,701 | |
| Total Shareholders’ Equity | 3,328 | 3,195 | 3,319 | 4,013 | 4,944 | |
| Net Operating Cash Flow | 1,124 | 1,074 | 455 | 1,020 | 2,024 | |
| Capital Expenditure | 260 | 12 | 73 | 14 | 667 | |
| Net Investing Cash Flow | -269 | -22 | -83 | 177 | -537 | |
| Net Financing Cash Flow | -296 | -1,018 | -542 | -244 | 20 | |
| Free Cash Flow | 867 | 1,073 | 405 | 1,013 | 1,375 | |
| ROA (%) | 5.93 | 7.14 | 5.01 | 7.01 | 7.90 | |
| ROE (%) | 21.06 | 27.15 | 20.45 | 28.07 | 30.27 | |
| EPS (Yen) | 37.4 | 50.3 | 39.6 | 61.4 | 80.8 | 76.1 |
| BPS (Yen) | 188.3 | 187.7 | 197.9 | 239.2 | 294.1 | |
| Dividend per Share (Yen) | 12.00 | 16.00 | 20.00 | 28.00 | 34.00 | 34.00 |
| Shares Outstanding (Million shares) | 17.67 | 17.67 | 17.67 | 17.67 | 17.67 |
Source: Calculated by Omega Investment based on FactSet’s standard criteria, rounded to the nearest whole number.
Share price
Key stock price data
Financial data (quarterly basis)
| Unit: million yen | 2024/3 | 2025/3 | 2026/3 | ||||||
| 4Q | 1Q | 2Q | 3Q | 4Q | 1Q | 2Q | 3Q | 4Q | |
| (Income Statement) | |||||||||
| Sales | 3,742 | 3,789 | 4,500 | 4,174 | 4,197 | 4,817 | 4,590 | 5,203 | 5,403 |
| Year-on-year | 17.1% | 11.1% | 22.0% | 21.9% | 12.2% | 27.1% | 2.0% | 24.6% | 28.7% |
| Cost of Goods Sold (COGS) | 3,026 | 3,099 | 3,645 | 3,346 | 3,331 | 3,681 | 3,531 | 4,096 | 4,043 |
| Gross Income | 716 | 690 | 854 | 828 | 866 | 1,135 | 1,059 | 1,106 | 1,360 |
| Gross Income Margin | 19.1% | 18.2% | 19.0% | 19.8% | 20.6% | 23.6% | 23.1% | 21.3% | 25.2% |
| SG&A Expense | 462 | 418 | 441 | 454 | 542 | 581 | 615 | 655 | 769 |
| EBIT (operating profit) | 248 | 270 | 411 | 369 | 306 | 555 | 444 | 451 | 591 |
| Year-on-year | 30.9% | 11.7% | 47.6% | 92.2% | 23.7% | 105.4% | 8.0% | 22.4% | 93.0% |
| Operating profit Margin | 6.6% | 7.1% | 9.1% | 8.8% | 7.3% | 11.5% | 9.7% | 8.7% | 10.9% |
| EBITDA | 263 | 284 | 425 | 383 | 320 | 565 | 455 | 463 | 603 |
| Pretax Income | 231 | 274 | 424 | 387 | 405 | 578 | 499 | 559 | 626 |
| Consolidated Net Income | 147 | 183 | 285 | 255 | 305 | 394 | 326 | 364 | 287 |
| Minority Interest | -0 | -1 | -1 | 1 | 0 | 7 | 2 | 1 | 5 |
| Net Income ATOP | 147 | 184 | 286 | 255 | 305 | 387 | 324 | 363 | 282 |
| Year-on-year | -5.2% | -2.7% | 48.6% | 84.6% | 107.6% | 110.2% | 13.5% | 42.5% | -7.5% |
| Net Income Margin | 3.9% | 4.9% | 6.4% | 6.1% | 7.3% | 8.0% | 7.1% | 7.0% | 5.2% |
| (Balance Sheet) | |||||||||
| Cash & Short-Term Investments | 3,331 | 3,256 | 3,461 | 3,562 | 4,284 | 4,179 | 4,577 | 4,839 | 5,791 |
| Total assets | 13,710 | 13,626 | 14,158 | 14,562 | 15,666 | 15,547 | 16,232 | 17,342 | 18,664 |
| Total Debt | 0 | 0 | 0 | 0 | 103 | 153 | 145 | 421 | 548 |
| Net Debt | -3,331 | -3,256 | -3,461 | -3,562 | -4,181 | -4,026 | -4,432 | -4,418 | -5,243 |
| Total liabilities | 10,386 | 10,454 | 10,701 | 10,850 | 11,649 | 11,606 | 11,965 | 12,711 | 13,701 |
| Total Shareholders’ Equity | 3,319 | 3,168 | 3,453 | 3,708 | 4,013 | 3,930 | 4,254 | 4,617 | 4,944 |
| (Profitability %) | |||||||||
| ROA | 5.01 | 5.03 | 5.56 | 6.27 | 7.01 | 8.45 | 8.36 | 8.64 | 7.90 |
| ROE | 20.45 | 22.01 | 23.27 | 25.32 | 28.07 | 34.71 | 32.97 | 33.12 | 30.27 |
| (Per-share) Unit: JPY | |||||||||
| EPS | 8.8 | 11.0 | 17.0 | 15.2 | 18.2 | 23.1 | 19.3 | 21.6 | 16.8 |
| BPS | 197.9 | 188.8 | 205.9 | 221.1 | 239.2 | 234.3 | 253.6 | 275.3 | 294.1 |
| Dividend per Share | 20.00 | 0.00 | 0.00 | 0.00 | 28.00 | 0.00 | 0.00 | 0.00 | 34.00 |
| Shares Outstanding (milion shares) | 17.67 | 17.67 | 17.67 | 17.67 | 17.67 | 17.67 | 17.67 | 17.67 | 17.67 |
Source: Calculated by Omega Investment based on FactSet’s standard criteria, rounded to the nearest whole number.
Financial data (full-year basis)
| Unit: million yen | 2019/3 | 2020/3 | 2021/3 | 2022/3 | 2023/3 | 2024/3 | 2025/3 | 2026/3 |
| (Income Statement) | ||||||||
| Sales | 8,229 | 9,985 | 10,343 | 11,415 | 13,070 | 14,264 | 16,659 | 20,012 |
| Year-on-year | 23.0% | 21.3% | 3.6% | 10.4% | 14.5% | 9.1% | 16.8% | 20.1% |
| Cost of Goods Sold | 6,681 | 8,051 | 8,526 | 9,343 | 10,551 | 11,690 | 13,422 | 15,352 |
| Gross Income | 1,548 | 1,934 | 1,817 | 2,072 | 2,519 | 2,574 | 3,238 | 4,661 |
| Gross Income Margin | 18.8% | 19.4% | 17.6% | 18.2% | 19.3% | 18.0% | 19.4% | 23.3% |
| SG&A Expense | 815 | 1,149 | 1,085 | 1,162 | 1,307 | 1,600 | 1,856 | 2,620 |
| EBIT (Operating Income) | 734 | 784 | 732 | 910 | 1,200 | 960 | 1,356 | 2,041 |
| Year-on-year | 84.8% | 6.8% | -6.6% | 24.3% | 31.8% | -20.0% | 41.3% | 50.5% |
| Operating Income Margin | 8.9% | 7.8% | 7.1% | 8.0% | 9.2% | 6.7% | 8.1% | 10.2% |
| EBITDA | 903 | 963 | 891 | 1,089 | 1,236 | 1,010 | 1,411 | 2,085 |
| Pretax Income | 714 | 818 | 842 | 987 | 1,267 | 992 | 1,489 | 2,262 |
| Consolidated Net Income | 510 | 564 | 576 | 662 | 886 | 666 | 1,028 | 1,371 |
| Minority Interest | 0 | 0 | 0 | 0 | 0 | -0 | -1 | 15 |
| Net Income ATOP | 510 | 564 | 576 | 662 | 886 | 666 | 1,029 | 1,356 |
| Year-on-year | 116.1% | 10.7% | 2.0% | 15.1% | 33.7% | -24.8% | 54.5% | 31.7% |
| Net Income Margin | 6.2% | 5.7% | 5.6% | 5.8% | 6.8% | 4.7% | 6.2% | 6.8% |
| (Balance Sheet) | ||||||||
| Cash & Short-Term Investments | 1,862 | 2,543 | 2,909 | 3,468 | 3,501 | 3,331 | 4,284 | 5,791 |
| Total assets | 8,587 | 10,233 | 10,430 | 11,912 | 12,882 | 13,710 | 15,666 | 18,664 |
| Total Debt | 0 | 0 | 0 | 0 | 0 | 0 | 103 | 548 |
| Net Debt | -1,862 | -2,543 | -2,909 | -3,468 | -3,501 | -3,331 | -4,181 | -5,243 |
| Total liabilities | 6,480 | 7,687 | 7,468 | 8,584 | 9,687 | 10,386 | 11,649 | 13,701 |
| Total Shareholders’ Equity | 2,107 | 2,546 | 2,961 | 3,328 | 3,195 | 3,319 | 4,013 | 4,944 |
| (Cash Flow) | ||||||||
| Net Operating Cash Flow | 435 | 923 | 666 | 1,124 | 1,074 | 455 | 1,020 | 2,024 |
| Capital Expenditure | 315 | 56 | 130 | 260 | 12 | 73 | 14 | 667 |
| Net Investing Cash Flow | -325 | -118 | -140 | -269 | -22 | -83 | 177 | -537 |
| Net Financing Cash Flow | 67 | -125 | -160 | -296 | -1,018 | -542 | -244 | 20 |
| Free Cash Flow | 125 | 892 | 538 | 867 | 1,073 | 405 | 1,013 | 1,375 |
| (Profitability ) | ||||||||
| ROA (%) | 6.55 | 6.00 | 5.57 | 5.93 | 7.14 | 5.01 | 7.01 | 7.90 |
| ROE (%) | 28.03 | 24.26 | 20.90 | 21.06 | 27.15 | 20.45 | 28.07 | 30.27 |
| Net Margin (%) | 6.19 | 5.65 | 5.57 | 5.80 | 6.77 | 4.67 | 6.18 | 6.77 |
| Asset Turn | 1.06 | 1.06 | 1.00 | 1.02 | 1.05 | 1.07 | 1.13 | 1.17 |
| Assets/Equity | 4.28 | 4.05 | 3.75 | 3.55 | 3.80 | 4.08 | 4.01 | 3.83 |
| (Per-share) Unit: JPY | ||||||||
| EPS | 29.7 | 31.7 | 32.3 | 37.4 | 50.3 | 39.6 | 61.4 | 80.8 |
| BPS | 118.2 | 142.8 | 166.1 | 188.3 | 187.7 | 197.9 | 239.2 | 294.1 |
| Dividend per Share | 7.00 | 9.00 | 9.00 | 12.00 | 16.00 | 20.00 | 28.00 | 34.00 |
| Shares Outstanding (million shares) | 17.69 | 17.82 | 17.82 | 17.67 | 17.67 | 17.67 | 17.67 | 17.67 |
Source: Calculated by Omega Investment based on FactSet’s standard criteria, rounded to the nearest whole number.