2026-10-23
Home
Japanese

Omega Investment Co., Ltd.
Human Creation Holdings (Investment report – Basic report)
| Share price (7/14) | ¥1,150 | Dividend Yield (26/9 CE) | 3.7 % |
| 52weeks high/low | ¥1,120/1,430 | ROE(25/9) | 28.0 % |
| Avg Vol (3 month) | 6.6 thou shrs | Operating margin (25/9) | 8.8 % |
| Market Cap | ¥4.31 bn | Beta (5Y Monthly) | 0.37 |
| Enterprise Value | ¥3.81 bn | Shares Outstanding | 3.573 mn shrs |
| PER (26/9 CE) | 8.6 X | Listed market | TSE Growth |
| PBR (25/9 act) | 2.6 X |
| Click here for the PDF version of this page |
| PDF version |
Expansion of second-half profit as the starting point for correcting the low PER
1. Investment conclusion
Expansion of second-half profit and results in the strategic domains will be the focus for correcting the low PER
The investment conclusion for Human Creation Holdings, Inc. (hereinafter, the Company) is that, as a medium- to long-term small-cap growth stock, it should be positioned as a stock for which we would like to see a reappraisal of its share price valuation, premised on confirmation of progress toward profit expansion in the second half and achievement of the full-year plan. The current share price remains at a forecast PER of 9.3x, and it is difficult to say that capital efficiency, with ROE of 27.6% and ROIC of 10.7%, has been sufficiently factored in. On the other hand, although the Company recorded higher sales but lower profit in the first half of FY9/2026, this was largely due to the concentration of the annual investment plan in the first half, as well as the impact of optimizing sales recognition for large-scale projects, for which orders and project progress are proceeding smoothly, in the third quarter and beyond. For the Company’s share price valuation to rise in earnest, sales recognition for large-scale projects from the third quarter onward, improvement in the operating margin, and confirmation of progress in BaaS investments will be necessary.
The low level of the Company’s share price cannot be explained solely by the decline in first-half profit. System Engineering Service (SES), classification as a company, the small-cap discount, and liquidity constraints overlap, creating a situation in which share price formation is unlikely to progress sufficiently. The market still views the Company as a labor-intensive SES company, but in reality, the Company is advancing a transition to a high-value-added model that combines consulting, contracted development, maintenance and operations, M&A support, AI, and BaaS. If this transition is confirmed as profit growth, the low PER may be corrected.
In the first half of FY9/2026, net sales were 4.477 billion yen and operating profit was 120 million yen. On a year-on-year basis, net sales were 110.0%, while operating profit was 31.8%, resulting in higher sales but lower profit. However, the Company explains that the main factors were the optimization of sales recognition for large-scale projects to the third quarter and beyond, the full execution of 65 million yen in upfront investments for BaaS at ACF in the first half, and the achievement of performance bonuses at HCFA. Therefore, it is not appropriate to judge this as a structural slowdown based solely on profit progress in the first half.
In the full-year plan, the Company forecasts net sales of 10.005 billion yen, operating profit of 785 million yen, net income attributable to owners of parent of 436 million yen, and EPS of 141.08 yen. Given the forecast PER of 9.3x, ROE of 27.6%, and ROIC of 10.7%, if expansion of operating profit through sales recognition for large-scale projects in the second half and the completion of the investment burden is confirmed, there is potential for a reappraisal of the share price. On the other hand, if sales recognition for large-scale projects is delayed in the third quarter, or if monetization of BaaS investments remains elusive, short-term downward pressure on the share price will persist.
The investment time horizon is designed to target returns from PER correction and EPS expansion over one to two years, while looking ahead to the expansion of the strategic domains three to four years from now. At present, we view the Company’s shares as a value-growth stock for which the transition to the strategic domains has not yet been fully reflected in the share price. The next focus points are improvement in the operating margin from the third quarter onward, profit contribution from large-scale projects, progress in BaaS investments, and profit generation in the strategic domains.
2. Company overview and business model
Creating room for corporate value expansion in the strategic domains on a foundation of stable earnings from SES
The Company is a solutions integrator that seeks to address clients’ management issues, with IT as its core. Under a pure holding company structure, it has operating subsidiaries engaged in businesses such as engineering staffing, contracted development and operations, consulting, AI solutions, and M&A advisory. The company positions the SES business as a stable earnings base and the strategic domains business as a business growth base. It aims to evolve into a next-generation management issue consulting company that provides answers.
The Company’s corporate value formation lies in a structure in which it steadily builds up utilization rates and contract unit prices in SES, and uses those customer touchpoints and its human capital base to shift its earnings mix toward higher-value-added strategic domains. SES is not merely the supply of human resources; it is an entry point to customer touchpoints and a training base for advancing young and mid-level engineers into upstream processes. Whether the company can develop projects from this base into consulting, contracted development, maintenance and operations, AI solutions, and M&A support will affect the Company’s medium- to long-term share price valuation.
In the first half of FY9/2026, the sales composition was 2.747 billion yen in the SES business and 1.730 billion yen in the strategic domains business, out of net sales of 4.477 billion yen. On a year-on-year basis, the SES business was 103.6%, and the strategic domains business was 121.9%, indicating that, compared with SES, the stable base, growth in the strategic domains is driving overall company growth. In terms of accounting reportable segments, following the consolidation of HC Financial Advisor as a subsidiary in April 2025, the segments have been changed to two categories: the system solution service business and the management consulting service business.
The Company’s distinctive feature lies in its one-stop structure, in which it creates customer touchpoints through M&A advisory and management consulting, and then connects them to IT consulting, development, maintenance, and operations, as well as BPO. Asset Consulting Force handles upstream processes; Human Base handles the ERP domain; Brain Knowledge Systems handles design and development; Sailing handles maintenance and operations; Cosmopia handles the support desk and BPO; TARA handles AI solutions; and HC Financial Advisor handles M&A and business succession support. This makes it easier to create a cycle of identifying customer issues, development, maintenance, operations, and additional development, rather than ending with one-off human resource provision.
Growth potential lies in the rollout of common products, including BaaS, to the SMB (Small and Medium Business: small and medium-sized businesses, including mid-sized companies) market, and the shift of SES human capital to upstream processes. However, the conditions for realization are that orders in the strategic domains can materialize as profit contribution, BaaS (Backend as a Service: a cloud service that provides server-side functions required for app development, such as authentication and databases, via APIs) investments can turn into recurring projects, and recruitment and training of personnel can lead to higher unit prices. In subsequent earnings results, we would like to confirm not only the growth in sales in the strategic domains, but also the improvement in the operating margin, SES unit prices, utilization rate, and the timing of sales recognition for large-scale projects.
Regarding overseas business, the Company is not at a stage where it should be factored in as an independent growth driver at present. In the past, the Company established Jizhanli Information Technology (Weihai) Co., Ltd. to train IT engineers in China, but the Company was liquidated in June 2020. Therefore, the Company’s main battlefields are domestic IT and DX demand, the SES human capital base, and the expansion of strategic domains. Rather than the overseas sales ratio or sensitivity to foreign exchange, we would like to emphasize the BaaS rollout in the domestic SMB market, cross-selling from consulting to maintenance and operations, and the monetization of strategic domains, including HCFA.
3. Earnings structure by business segment
SES is the pillar of sales; profit contribution from the strategic domains is the key to raising the share price valuation
The Company’s earnings structure is easier to understand by looking at the combination of the SES business, which supports sales scale, and the strategic domains business, which has a high growth rate. Net sales in the first half of FY9/2026 were 4.477 billion yen, consisting of 2.747 billion yen in the SES business and 1.730 billion yen in the strategic domains business. On a year-on-year basis, the Company overall was 110.0%, the SES business was 103.6%, and the strategic domains business was 121.9%, indicating that the recent increase in sales is mainly driven by growth in the strategic domains.
The SES business is the base business that supports the Company’s sales and utilization-based earnings. The main KPIs that drive earnings are the number of engineers, utilization rate, and average contract unit price. In FY9/2025, the number of engineers was 773, the utilization rate was 98.6%, and the average contract unit price was 667,000 yen. The utilization rate is already high, and future profit improvement is likely to depend on net increase in headcount, higher unit prices, and the shift of personnel to upstream processes. We view SES not so much as a business aimed at rapid growth, but as a foundation that supports stable earnings and the supply of human resources to the strategic domains.
The strategic domains business is the area responsible for sales growth and reappraisal of the share price valuation. In the first half of FY9/2026, sales increased to 121.9% year on year. However, on the profit side, expenses came first due to the optimization of sales recognition for large-scale projects, for which orders and project progress are proceeding smoothly, to the third quarter and beyond; the full execution in the first half of 65 million yen in upfront investments for BaaS at ACF in line with the annual investment plan; and the recording of performance achievement bonuses at HCFA. As a result, operating profit in the first half was 120 million yen, or 31.8% year on year. However, the impact of upfront expenses and the timing of sales recognition were significant, and the current situation can be characterized as progress in line with the full-year plan. What is important for investors is not the expansion of sales in the strategic domains themselves, but whether large-scale projects will contribute sequentially as sales and profit from the third quarter onward.
The new BaaS product is positioned as a platform that flexibly provides contract management, SFA, ERP, finance and accounting, AI agents, and other functions to the SMB market. By linking the solutions of each group company and combining them according to customer issues, the Company aims to restrain the labor-intensive nature of individual contracted development and make it easier to roll out proposals, implementation, and maintenance and operations horizontally. If BaaS generates recurring revenue, the Company’s share price valuation will move closer to that of a solution company with a DX platform for SMBs, rather than that of a conventional SES company.
The factors incorporated into the Company plan are sales recognition for large-scale projects in the second half, the upfront burden of BaaS investments, and the consolidated contribution from HCFA. Upside factors are higher project unit prices in the strategic domains, expansion in BaaS implementation customers, and an increase in successful M&A advisory deals. Downside factors are delays in sales recognition for large-scale projects, delays in recovery of BaaS investments, and a slowdown in SES unit price increases. In the next earnings results, we would like to prioritize confirming improvements in the operating margin, profit contribution from large-scale projects, progress in BaaS business negotiations, and SES unit prices and utilization rates, rather than the sales growth rate in the strategic domains.
4. Medium-term management policy and growth strategy
Advancing high-value-added services through BaaS and group collaboration, starting from the SMB market
The core of the Company’s medium-term strategy is to advance business transformation by using the strategic domains as a growth lever while maintaining stable earnings from the SES business. The Company has set targets of EPS of 1,000 yen and ROE of over 30% in FY9/2030. The EPS of 1,000 yen is the figure before the stock split adjustment, and the Company explains that after accounting for it, the figure is 500 yen. The 2nd Stage through FY9/2027 is positioned as a period for accelerating business transformation, with rollout to the SMB market, group collaboration centered on BaaS, and expansion of the strategic domains through M&A as the main themes.
The center of the strategy is DX support for the SMB market. The Company defines SMBs as small and medium-sized businesses, including mid-sized companies, and has indicated a policy of providing services from DX consulting to implementation. What becomes important here is the HCH platform, namely BaaS. The company has presented a concept to modularize the group’s capabilities and combine contract management, SFA, workflow management, finance, accounting, ERP for SMBs, AI agents, AI cameras, and other functions to address customer issues.
In its sales strategy, the Company will share customer touchpoints among group companies and promote cross-selling using BaaS as a common platform. The aim is not simply to acquire new customers but to deepen relationships with existing customers and improve the group’s overall value at the same time. The conditions for realization are accurately identifying company-specific issues through consulting, lowering barriers to BaaS implementation, and connecting this to maintenance, operations, and additional development.
Another pillar supporting medium-term growth is M&A. The consolidation of HC Financial Advisor as a subsidiary added a new contact point for management issues, beginning with M&A and business succession support. This creates the possibility of horizontal rollout from the customer base obtained through M&A advisory to IT and DX projects, business improvement, and BaaS implementation. The ability to integrate M&A support and IT solutions within the same group is a distinctive feature of the Company’s expansion into strategic domains.
The risk is that BaaS may not be sufficiently standardized as a product, and that customized responses for each project may increase. In that case, recovery of upfront investments would be delayed, and improvement in profit margins would become difficult to see. In addition, if the shift of human capital from SES to upstream processes does not progress, the expansion of the strategic domains is unlikely to lead to higher unit prices or improved profit margins. The evaluation axis for the medium-term management policy is not the size of the target figures, but whether the Company can maintain its high ROE while shifting the earnings mix from SES to the strategic domains.
Items to confirm in subsequent earnings results are BaaS implementation customers, the number of cross-selling projects, gross margin improvement in the strategic domains, sales recognition for large-scale projects, and the shift of human capital from SES to upstream processes. We would like to judge the effectiveness of the mid-term management plan not only by sales growth, but also by whether DX support for SMBs can be transformed into a reproducible profit model.
5. Earnings trends and full-year outlook
Sales are steadily expanding; the focus is on profit expansion in the second half, as planned.
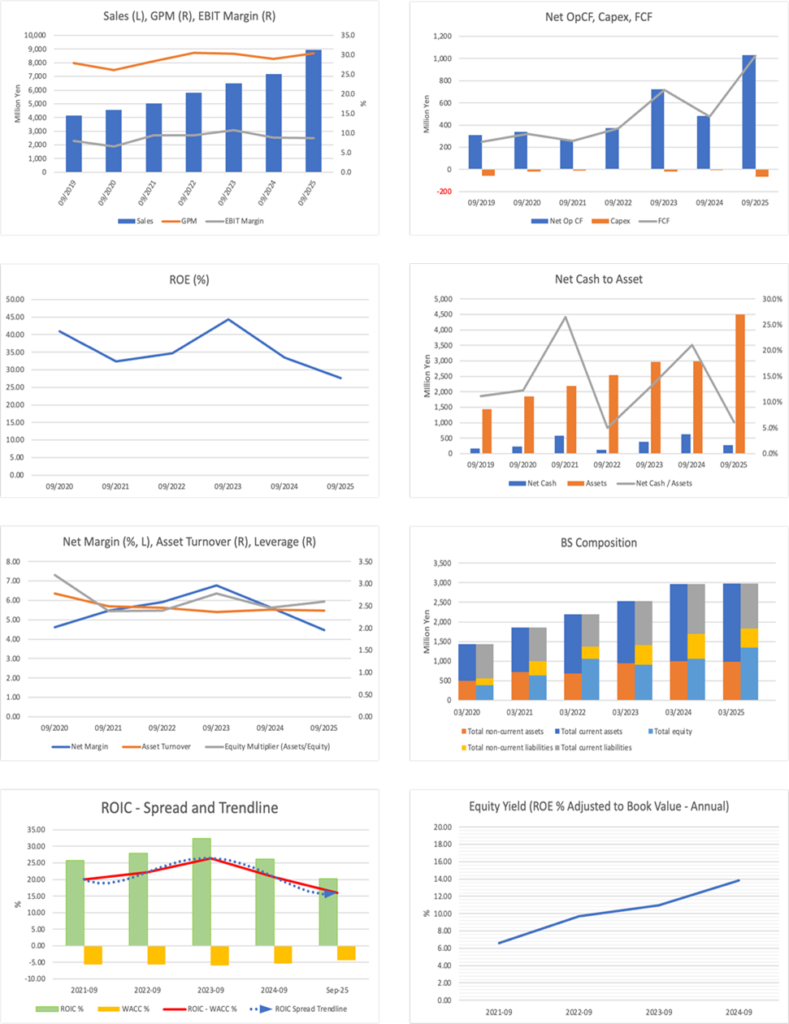
The Company’s long-term performance has evolved, with sales growth leading, while profit has been influenced by M&A, upfront investments, and the business mix. Net sales expanded from 5.035 billion yen in FY9/2021 to 5.803 billion yen in FY9/2022, 6.486 billion yen in FY9/2023, 7.165 billion yen in FY9/2024, and 8.945 billion yen in FY9/2025. The CAGR of net sales from FY9/2021 to FY9/2025 was approximately 15.4%, driven by demand for IT personnel and the expansion of strategic domains.
On the other hand, net income attributable to owners of parent increased from 276 million yen in FY9/2021 to 398 million yen in FY9/2025, with a CAGR of approximately 9.6% over the same period. We believe that the somewhat moderate profit growth relative to sales expansion is one reason the company’s share price has struggled to rise. From a business perspective, the growth in sales in the strategic domains should be noted. Sales in this area expanded from 1.042 billion yen in FY9/2021 to 3.642 billion yen in FY9/2025, indicating that the transformation of the earnings mix has progressed at least in terms of sales.
In the most recent first half of FY9/2026, net sales were 4.477 billion yen, operating profit was 120 million yen, and interim net income attributable to owners of parent was 17 million yen. On a year-on-year basis, net sales were 110.0%, operating profit was 31.8%, and interim net income attributable to owners of parent was 9.8%. The main factors behind the decline in profit in the first half were the optimization of sales recognition for large-scale projects, for which orders and project progress are proceeding smoothly, to the third quarter and beyond; the full execution in the first half of 65 million yen in upfront investments for BaaS at ACF in line with the annual investment plan; and the recording of performance achievement bonuses at HCFA. The Company views these factors as within expectations, and the current figures should be regarded as progress in line with the full-year plan.
The full-year plan for FY9/2026 calls for net sales of 10.005 billion yen, EBITDA of 1.022 billion yen, operating profit of 785 million yen, net income attributable to owners of parent of 436 million yen, and EPS of 141.08 yen. Compared with the previous fiscal year, the Company forecasts net sales of 111.8%, EBITDA of 107.2%, operating profit of 100.5%, and net income attributable to owners of parent of 109.5%. By business segment, the Company plans net sales of 5.484 billion yen in SES and 4.520 billion yen in the strategic domains, and the strategic domains’ sales ratio is expected to rise to 45.2%.
First-half progress was 44.8% for net sales and 15.3% for operating profit. Progress in operating profit appears low, but this largely reflects the impact of expense recognition coming first in the first half. From the third quarter onward, the Company expects to recognize sales from large-scale projects in the strategic domains sequentially and to accelerate profit growth with the completion of upfront investments. The issue at this point is not whether the sales plan can be reached, but how much operating profit can be built up in the second half, taking into account the concentration of the annual investment plan in the first half and the shift of the timing of sales recognition for large-scale projects to the second half.
Working backward from market expectations, the forecast EPS of 141.08 yen and forecast PER of 9.3x imply a share price of approximately 1,313 yen. Assuming a forecast dividend of 45 yen, the dividend payout ratio is approximately 31.9%, and the dividend yield is approximately 3.4%. If the cost of shareholders’ equity is set at 5%-6%, EPS growth expectations, as reflected in the share price from a dividend discount perspective, remain in the low single digits. Considering the net sales CAGR of approximately 15.4% over the past five years, the net income CAGR of approximately 9.6%, and the fact that the Company’s planned EPS of 141.08 yen for FY9/2026 exceeds EPS of 125.96 yen for FY9/2025, the market’s expectation level remains conservative.
The factors incorporated into the Company plan are moderate growth in SES, sales recognition of large-scale projects in the strategic domains, the upfront burden of BaaS investments, and the full-year contribution from HCFA. Upside factors include sales recognition for large-scale projects contributing more than expected to profit margins; BaaS moving from business negotiations to implementation and generating recurring revenue; and an increase in M&A projects at HCFA, leading to cross-selling into IT and DX projects. Downside factors include delays in sales recognition of large-scale projects, delays in the recovery of BaaS investments, a slowdown in SES hiring and unit price increases, and M&A-related expenses. In future earnings results, we would like to focus on confirming improvement in the operating margin, actual profit contribution from large-scale projects, the status of BaaS implementation, SES unit prices, and the sales ratio and profit contribution of the strategic domains.
6. Finance, cash flow, and capital efficiency
High ROE is an evaluation factor; operating cash flow and maintenance of ROIC are the next points to confirm
The Company’s balance sheet reflects a degree of financial soundness for a small-cap IT services company pursuing growth through M&A. At the end of the first half of FY9/2026, total assets were 3.982 billion yen, net assets were 1.499 billion yen, and the equity ratio was 36.9%. Cash and deposits were 853 million yen, goodwill was 1.193 billion yen, and, in terms of asset composition, cash and goodwill associated from M&A accounted for a large share. Total interest-bearing debt, consisting of short-term debt of 259 million yen and long-term debt of 664 million yen, was 924 million yen, and net cash was approximately negative 70 million yen.
Although leverage is not excessively high, profit expansion and cash generation from the second half onward will be important for sustaining investments in strategic domains and M&A. Cash flow was weak in the first half. Operating cash flow was an outflow of 190 million yen, investing cash flow was an outflow of 70 million yen, and financing cash flow was an outflow of 302 million yen, resulting in a decrease in cash and cash equivalents of 564 million yen from the end of the previous fiscal year to 853 million yen. The negative operating cash flow reflected a decrease in other payables, an increase in trade receivables, and income tax payments, despite recording an interim profit before income taxes of 114 million yen. In financing cash flow, repayment of long-term borrowings of 219 million yen and dividend payments of 83 million yen were the main factors.
In capital allocation, the company sets a total payout ratio of over 30% as a guideline and advocates stable and continuous shareholder returns. The forecast year-end dividend for FY9/2026 was raised from 44 yen to 45 yen, in anticipation of sales recognition for large-scale projects and earnings expansion in the second half. The dividend increase despite lower profit in the first half can be read as a sign of confidence in second-half earnings. However, because this is not a phase in which cash on hand is accumulating significantly, managing the balance among growth investments, debt repayment, and dividends will become more important.
Capital efficiency is high for a small-cap IT services company. Currently, ROA is 10.5%, ROE is 27.6%, and ROIC is 10.7%, indicating that the Company has a strong ability to generate profit using shareholders’ equity. At the end of the first half of FY9/2026, the equity ratio was 36.9%, and shareholders’ equity was 1.470 billion yen, indicating that the Company does not have an inefficient financial structure characterized by excessive accumulation of shareholders’ equity. A PBR of 2.4x may seem high at first glance, but assuming an ROE in the 27% range, it can also be interpreted as a level where the high level of capital efficiency is reflected to a certain extent in the stock valuation. On the other hand, the fact that the forecast PER remains at 9.3x indicates that the market does not yet have sufficient confidence in the sustainability of the Company’s high ROE.
ROIC of 10.7% is likely to exceed WACC. Given a beta of 0.5 and low share price volatility, the Company’s cost of shareholders’ equity is not considered as high as that of high-beta growth stocks. Net cash is approximately negative 70 million yen, which is near neutral territory, and the structure is not one in which ROE is excessively pushed up by financial leverage. Therefore, the current difference between ROIC and WACC is positive, indicating that the Company is creating economic value. However, maintaining this state is premised on connecting sales growth in the strategic domains to improvement in profit margins.
What investors should confirm is not financial safety itself, but whether investments in strategic domains will improve operating cash flow. Upside factors include profit recognition from large-scale projects, recovery of BaaS investments, and improved cash-generation capacity through earnings contributions from HCFA. Downside factors are increases in trade receivables, delays in investment recovery, and increases in borrowings due to additional M&A. We would like to confirm a return to positive operating cash flow, cash and deposits, interest-bearing debt, goodwill, the sustainability of dividend sources, and the maintenance of ROIC.
7. Shareholder composition and stock supply and demand
Treasury shares, the employee stock ownership plan, and Hikari Tsushin support supply and demand, while liquidity remains a constraint
According to FactSet Ownership data, the Company has 3,573 thousand shares outstanding, the total ownership ratio of identifiable shareholders is 49.03%, and the floating share ratio is 51.70%. The major shareholders are the Company’s treasury shares at 13.43%, Hikari Tsushin at 9.61%, the HCH Group employee stock ownership plan at 6.94%, NS Solutions at 4.39%, Kuniaki Tominaga at 3.25%, and Advanced Media at 3.11%. In particular, Hikari Tsushin is shown to have increased its holdings by 151 thousand shares over six months, a noteworthy change in both supply and demand and in market recognition for a small-cap stock with a market capitalization of around 4.0 billion yen.
From the perspective of equity investment, the presence, to a certain extent, of treasury shares, the employee stock ownership plan, business-company shareholders, and founding and management-related shareholders is likely to contribute to supply and demand stability in normal times. Treasury shares of 13.43% may be treated as options in capital policy, such as future cancellation, use in M&A, or incentive design. In addition, the employee stock ownership plan at 6.94% and Mr. Tominaga at 3.25% can be viewed as factors that, to some extent, align management and employee interests with shareholder value. The presence of business-company shareholders such as NS Solutions and Advanced Media also suggests stable holding characteristics that differ from those of purely financial investors.
The issue in terms of supply and demand is liquidity. Although the floating share ratio is 51.70%, the market capitalization is small, making it difficult for institutional investors to build sufficient ownership ratios. The holding by Sumitomo Mitsui DS Asset Management remains at 0.73%, with a decrease of 33 thousand shares over six months. At present, a structure in which continuous buying by institutional investors drives up the share price is still taking shape. This is considered to be one factor behind the Company’s low PER and small-cap discount.
In portfolio management, while viewing the increase in Hikari Tsushin’s holdings as a positive supply-demand shift, a step-by-step reappraisal of the share price valuation that accounts for liquidity constraints is realistic. Items to confirm going forward include whether Hikari Tsushin makes additional purchases, the policy on the use of treasury shares, an increase in the institutional investor ratio, and expansion of the investor base through stronger IR. If profit expansion in the second half and earnings contribution from the strategic domains are confirmed, and if long-term shareholders increase on the supply-demand side at the same time, this may lead to a narrowing of the small-cap discount.
8. Share price trends and valuation
The median of the three methods exceeds the current share price, but realizing upside will require confirmation of planned profit expansion.
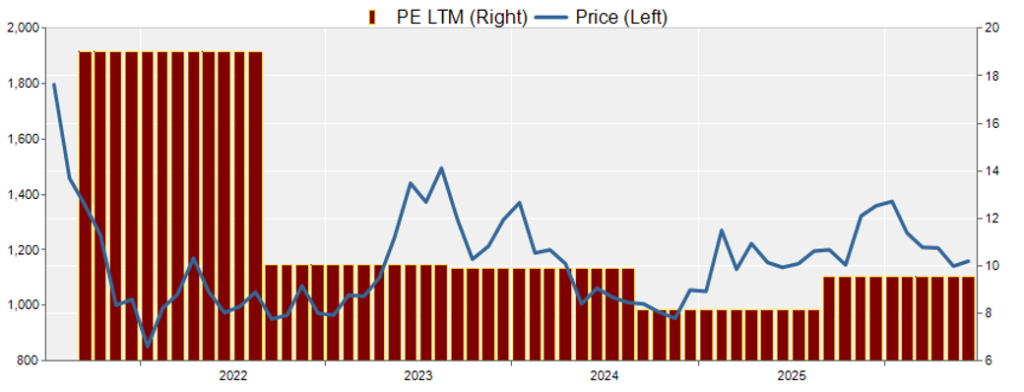
Looking at the Company’s shares over the past five years or so, the share price has declined from the high immediately after listing, and currently its valuation continues to reflect a small-cap discount. According to the securities report for FY9/2025, the high share price was 4,555 yen in FY9/2021, 2,731 yen in FY9/2022, 2,990 yen in FY9/2023, 2,764 yen in FY9/2024, and 1,408 yen in FY9/2025 on a post-stock-split basis, while the low share price in FY9/2025 was 987 yen. Over the past year, the year-to-date high in 2026 was 1,430 yen, the year-to-date low was 1,120 yen, and the share price has adjusted from the high range.
In terms of performance, net sales expanded from 5.035 billion yen in FY9/2021 to 8.945 billion yen in FY9/2025, and sales in the strategic domains also grew significantly. However, the share price has not straightforwardly factored in this growth. In the background is the fact that the Company still tends to be classified as an SES company, and the transition to a non-labor-intensive model, including strategic domains and BaaS, has not been sufficiently confirmed to drive profit growth. In addition, as a small-cap stock with a market capitalization of around 4.0 billion yen, liquidity constraints that make it difficult for institutional investors to build meaningful positions are also considered a reason for the low PER.
In quantitative terms, market capitalization is 4.0 billion yen; forecast PER is 9.3x; trailing PBR is 2.4x; ROA is 10.5%; ROE is 27.6%; ROIC is 10.7%; net cash is approximately negative 70 million yen; and beta is 0.5. Despite high ROE and ROIC, the forecast PER is in the single-digit range, and we believe the share price reflects the market’s view that it recognizes high capital efficiency but is not yet confident in the sustainability of profit growth. The reason the share price is sluggish despite strong performance is that the market places greater emphasis on the reproducibility of profit margins, profit contribution from strategic domains, and liquidity improvements than on sales growth.
The appropriate share price is confirmed using three methods: PBR, DCF, and ROIC. The current share price, calculated backward from 3,573 thousand shares outstanding in FactSet Ownership data and a market capitalization of 4.0 billion yen, is approximately 1,120 yen. Under the PBR method, accounting for an ROE of 27.6%, the decline in profit in the first half, and small-cap liquidity, we set the appropriate PBR range at 2.2x to 3.0x. Based on this, the appropriate share price is approximately 1,010 yen to 1,380 yen, with a median of approximately 1,200 yen. The current share price of approximately 1,120 yen falls within the PBR range but is slightly below the median.
Under the DCF method, based on the Company’s FY9/2026 plan of operating profit of 785 million yen and net income attributable to owners of the parent of 436 million yen, we incorporate normalized free cash flow and net cash of approximately negative 70 million yen. We estimate the appropriate share price range at 1,200-1,780 yen, with a median of 1,490 yen. If sales recognition for large-scale projects in the second half and the completion of BaaS investments are confirmed, the DCF-based valuation will exceed the current share price.
Under the ROIC method, which assumes ROIC of 10.7% remains above the cost of capital, we set the appropriate share price range at approximately 1,250-1,650 yen, with a median of approximately 1,450 yen. For ROIC to be maintained, sales growth in the strategic domains must be linked to improvements in profit margins. The medians of the three methods are approximately 1,200 yen under the PBR method, 1,490 yen under the DCF method, and 1,450 yen under the ROIC method, with the simple median at approximately 1,450 yen. Compared with the current share price of approximately 1,120 yen, this suggests upside potential of approximately 30%.
However, this upside potential will not materialize automatically. The short-term risk is that confirmation of planned second-half profit expansion will be delayed. If sales recognition for large-scale projects and an improvement in the operating margin cannot be sufficiently confirmed in the third quarter, the market’s confidence in the Company’s explanation for concentrating the annual investment plan in the first half and shifting the timing of sales recognition to the second half will weaken. The share price may again test the vicinity of the year-to-date low. On the other hand, if profit contribution from large-scale projects, progress in BaaS investments, and continuity of dividend increases are confirmed, the possibility remains that correction of the low PER will progress.
9. Summary of investment conclusion and future points of attention
A phase to seek a reappraisal of the share price valuation through profit generation in the strategic domains, while facing the constraint of human capital dependence
The final investment conclusion for the Company’s shares is that, as a medium- to long-term small-cap growth stock, the Company should be positioned for a reappraisal of the share price valuation, premised on confirmation of profit expansion in the second half. In the first half of FY9/2026, net sales were 4.477 billion yen and operating profit was 120 million yen, resulting in higher sales but lower profit. However, the Company explains that the main factors were the optimization of sales recognition for large-scale projects to the third quarter and beyond, upfront investments for BaaS at ACF, and performance achievement bonuses at HCFA. The full-year plan has been left unchanged at net sales of 10.005 billion yen, operating profit of 785 million yen, net income attributable to owners of parent of 436 million yen, and EPS of 141.08 yen. At this point, it is difficult to judge that the second-half-weighted profit plan has broken down.
The reason why the Company’s growth tends to struggle to accelerate is that the SES business forms the foundation of earnings. Even when demand is strong, SES requires the Company to build up human capital recruitment and training, increase unit prices, and shift to upstream processes one by one. Hence, sales and profits are unlikely to grow rapidly. With the utilization rate already high, future growth is more likely to depend on a shift to higher-value-added projects and an increase in contract unit prices, rather than simply improving utilization. This is the reverse side of stability, but in the share price, it also becomes a factor that makes growth acceleration difficult to see.
In addition, during the phase of transition to the strategic domains, sales growth may come first, while profit contribution appears skewed toward the second half. In the first half of FY9/2026, although sales increased, profit decreased on a year-on-year basis. However, orders and project progress for large-scale projects were steady, and the main factors were the optimization of sales recognition from the third quarter onward, the concentration of the annual investment plan for BaaS in the first half, and the recording of performance achievement bonuses at HCFA. The Company explains these as within expectations, and the current figures can be organized as progress in line with the full-year plan. On the other hand, from the market’s perspective, this is a phase to confirm whether the expansion of the strategic domains will lead to improved profit margins from the second half onward. This uncertainty is in the background of the low PER and small-cap discount.
Even so, the Company deserves evaluation because, while maintaining SES, which has stable earnings, it is expanding earnings opportunities into consulting, contracted development, maintenance and operations, M&A support, and BaaS. If the Company can leverage its existing human capital base and customer touchpoints to shift into higher-unit-price, higher-value-added areas, this will lead not only to sales growth but also to the maintenance of ROE and ROIC. In addition, the Company has raised its dividend forecast for FY9/2026 to 45 yen, and its stance of balancing growth investments and shareholder returns is also an evaluation factor.
In comparing the appropriate share price across three methods, the median is approximately 1,200 yen under the PBR method, 1,490 yen under the DCF method, and 1,450 yen under the ROIC method, yielding a central value of approximately 1,450 yen across the three methods. If the current share price is approximately 1,120 yen, based on the market capitalization of 4.0 billion yen and 3,573 thousand shares outstanding, the upside potential of approximately 30% is suggested. However, the conditions are that large-scale projects be recognized as sales and that profit from the third quarter onward becomes visible, and that profit margins in the strategic domains improve.
The Company’s stock price is unlikely to move up in a straight line in the short term. There will remain phases in which human capital dependence, the timing of project recognition, investment recovery, and liquidity constraints restrain the upside of the share price. On the other hand, if profit contribution from large-scale projects is confirmed in the second half and the strategic domains lead to improvement in profit margins, there is a possibility that the low-PER valuation will be reappraised. In the next earnings results, we would like to confirm an improvement in the operating margin, profit contribution from the strategic domains, progress in BaaS implementation, operating cash flow, and the sustainability of the dividend source.
Key stock price data
Key financial data
| Unit: million yen | 2021 | 2022 | 2023 | 2024 | 2025 | 2026 CE |
| Sales | 5,035 | 5,803 | 6,487 | 7,166 | 8,946 | 10,005 |
| EBIT (Operating Income) | 478 | 545 | 698 | 631 | 782 | 785 |
| Pretax Income | 464 | 546 | 701 | 630 | 684 | |
| Net Profit Attributable to Owner of Parent | 276 | 343 | 438 | 404 | 398 | 436 |
| Cash & Short-Term Investments | 846 | 673 | 1,020 | 1,003 | 1,417 | |
| Total assets | 2,192 | 2,536 | 2,963 | 2,978 | 4,496 | |
| Total Debt | 266 | 546 | 641 | 376 | 1,143 | |
| Net Debt | -580 | -127 | -379 | -627 | -274 | |
| Total liabilities | 1,128 | 1,620 | 1,901 | 1,625 | 2,965 | |
| Total Shareholders’ Equity | 1,064 | 916 | 1,062 | 1,353 | 1,530 | |
| Net Operating Cash Flow | 268 | 373 | 723 | 481 | 1,030 | |
| Capital Expenditure | 11 | 3 | 17 | 7 | 64 | |
| Net Investing Cash Flow | -52 | -335 | -169 | -3 | -896 | |
| Net Financing Cash Flow | 44 | -212 | -206 | -496 | 282 | |
| Free Cash Flow | 257 | 370 | 717 | 475 | 1,023 | |
| ROA (%) | 13.63 | 14.51 | 15.95 | 13.60 | 10.66 | |
| ROE (%) | 32.43 | 34.65 | 44.34 | 33.47 | 27.64 | |
| EPS (Yen) | 71.6 | 94.6 | 132.4 | 123.1 | 126.0 | 140.1 |
| BPS (Yen) | 276.2 | 265.6 | 324.1 | 415.9 | 494.8 | |
| Dividend per Share (Yen) | 24.49 | 25.00 | 25.50 | 26.00 | 27.00 | 45.00 |
| Shares Outstanding (Million shares) | 3.85 | 3.85 | 3.85 | 3.57 | 3.57 |
Source: Calculated by Omega Investment based on FactSet’s standard criteria, rounded to the nearest whole number.
Share price
Financial data (quarterly basis)
| Unit: million yen | 2024/9 | 2025/9 | 2026/9 | ||||||
| 2Q | 3Q | 4Q | 1Q | 2Q | 3Q | 4Q | 1Q | 2Q | |
| (Income Statement) | |||||||||
| Sales | 1,770 | 1,845 | 1,902 | 2,013 | 2,058 | 2,227 | 2,647 | 2,246 | 2,231 |
| Year-on-year | 9.3% | 10.4% | 16.6% | 22.1% | 16.3% | 20.7% | 39.2% | 11.6% | 8.4% |
| Cost of Goods Sold (COGS) | 1,262 | 1,295 | 1,346 | 1,421 | 1,473 | 1,566 | 1,769 | 1,611 | 1,688 |
| Gross Income | 508 | 550 | 557 | 592 | 585 | 661 | 879 | 635 | 543 |
| Gross Income Margin | 28.7% | 29.8% | 29.3% | 29.4% | 28.4% | 29.7% | 33.2% | 28.3% | 24.3% |
| SG&A Expense | 373 | 369 | 383 | 380 | 419 | 492 | 644 | 501 | 557 |
| EBIT (Operating Income) | 135 | 180 | 173 | 212 | 166 | 169 | 235 | 134 | -14 |
| Year-on-year | -27.9% | -4.5% | -1.8% | 51.7% | 22.7% | -6.4% | 35.7% | -36.9% | -108.2% |
| Operating Income Margin | 7.6% | 9.8% | 9.1% | 10.6% | 8.1% | 7.6% | 8.9% | 6.0% | -0.6% |
| EBITDA | 166 | 212 | 206 | 245 | 199 | 221 | 291 | 190 | 42 |
| Pretax Income | 135 | 182 | 174 | 212 | 87 | 166 | 219 | 124 | -10 |
| Consolidated Net Income | 92 | 110 | 113 | 132 | 42 | 92 | 133 | 53 | -35 |
| Minority Interest | 0 | 0 | 0 | 0 | 0 | 0 | 0 | 0 | 0 |
| Net Income ATOP | 92 | 110 | 113 | 132 | 42 | 92 | 133 | 53 | -35 |
| Year-on-year | -23.4% | -12.9% | 22.4% | 48.3% | -54.4% | -16.6% | 17.3% | -60.2% | -184.7% |
| Net Income Margin | 5.2% | 6.0% | 6.0% | 6.6% | 2.0% | 4.1% | 5.0% | 2.3% | -1.6% |
| (Balance Sheet) | |||||||||
| Cash & Short-Term Investments | 995 | 1,122 | 1,003 | 938 | 1,200 | 1,159 | 1,417 | 957 | 853 |
| Total assets | 2,997 | 3,035 | 3,051 | 3,004 | 3,365 | 4,355 | 4,511 | 4,052 | 3,983 |
| Total Debt | 574 | 425 | 376 | 326 | 702 | 1,322 | 1,143 | 994 | 924 |
| Net Debt | -420 | -697 | -627 | -612 | -499 | 163 | -274 | 36 | 71 |
| Total liabilities | 1,788 | 1,764 | 1,698 | 1,602 | 2,013 | 2,948 | 2,980 | 2,547 | 2,483 |
| Total Shareholders’ Equity | 1,209 | 1,271 | 1,353 | 1,402 | 1,352 | 1,408 | 1,530 | 1,505 | 1,500 |
| (Profitability %) | |||||||||
| ROA | 13.80 | 12.70 | 13.44 | 15.43 | 12.48 | 10.25 | 10.54 | 9.04 | 6.58 |
| ROE | 38.60 | 33.76 | 33.47 | 35.79 | 31.01 | 28.28 | 27.64 | 21.94 | 16.95 |
| (Per-share) Unit: JPY | |||||||||
| EPS | 27.9 | 33.4 | 34.7 | 40.6 | 13.2 | 29.6 | 42.9 | 17.0 | -11.5 |
| BPS | 366.4 | 387.1 | 415.9 | 431.0 | 429.8 | 455.1 | 494.8 | 486.7 | 481.8 |
| Dividend per Share | 0.00 | 0.00 | 26.00 | 0.00 | 0.00 | 0.00 | 27.00 | 0.00 | 0.00 |
| Shares Outstanding(million shares) | 3.85 | 3.85 | 3.85 | 3.57 | 3.57 | 3.57 | 3.57 | 3.57 | 3.57 |
Source: Calculated by Omega Investment based on FactSet’s standard criteria, rounded to the nearest whole number.
Financial data (full-year basis)
| Unit: million yen | 2021/9 | 2022/9 | 2023/9 | 2024/9 | 2025/9 |
| (Income Statement) | |||||
| Sales | 5,035 | 5,803 | 6,487 | 7,166 | 8,946 |
| Year-on-year | 10.3% | 15.3% | 11.8% | 10.5% | 24.8% |
| Cost of Goods Sold | 3,607 | 4,030 | 4,522 | 5,087 | 6,228 |
| Gross Income | 1,428 | 1,773 | 1,965 | 2,079 | 2,717 |
| Gross Income Margin | 28.4% | 30.6% | 30.3% | 29.0% | 30.4% |
| SG&A Expense | 950 | 1,228 | 1,267 | 1,448 | 1,935 |
| EBIT (Operating Income) | 478 | 545 | 698 | 631 | 782 |
| Year-on-year | 57.5% | 14.0% | 28.0% | -9.6% | 23.9% |
| Operating Income Margin | 9.5% | 9.4% | 10.8% | 8.8% | 8.7% |
| EBITDA | 558 | 659 | 813 | 754 | 954 |
| Pretax Income | 464 | 546 | 701 | 630 | 684 |
| Consolidated Net Income | 276 | 343 | 438 | 404 | 398 |
| Minority Interest | 0 | 0 | 0 | 0 | 0 |
| Net Income ATOP | 276 | 343 | 438 | 404 | 398 |
| Year-on-year | 31.2% | 24.3% | 27.8% | -7.8% | -1.4% |
| Net Income Margin | 5.5% | 5.9% | 6.8% | 5.6% | 4.5% |
| (Balance Sheet) | |||||
| Cash & Short-Term Investments | 846 | 673 | 1,020 | 1,003 | 1,417 |
| Total assets | 2,192 | 2,536 | 2,963 | 2,978 | 4,496 |
| Total Debt | 266 | 546 | 641 | 376 | 1,143 |
| Net Debt | -580 | -127 | -379 | -627 | -274 |
| Total liabilities | 1,128 | 1,620 | 1,901 | 1,625 | 2,965 |
| Total Shareholders’ Equity | 1,064 | 916 | 1,062 | 1,353 | 1,530 |
| (Cash Flow) | |||||
| Net Operating Cash Flow | 268 | 373 | 723 | 481 | 1,030 |
| Capital Expenditure | 11 | 3 | 17 | 7 | 64 |
| Net Investing Cash Flow | -52 | -335 | -169 | -3 | -896 |
| Net Financing Cash Flow | 44 | -212 | -206 | -496 | 282 |
| Free Cash Flow | 257 | 370 | 717 | 475 | 1,023 |
| (Profitability ) | |||||
| ROA (%) | 13.63 | 14.51 | 15.95 | 13.60 | 10.66 |
| ROE (%) | 32.43 | 34.65 | 44.34 | 33.47 | 27.64 |
| Net Margin (%) | 5.48 | 5.91 | 6.76 | 5.64 | 4.45 |
| Asset Turn | 2.49 | 2.45 | 2.36 | 2.41 | 2.39 |
| Assets/Equity | 2.38 | 2.39 | 2.78 | 2.46 | 2.59 |
| (Per-share) Unit: JPY | |||||
| EPS | 71.6 | 94.6 | 132.4 | 123.1 | 126.0 |
| BPS | 276.2 | 265.6 | 324.1 | 415.9 | 494.8 |
| Dividend per Share | 24.49 | 25.00 | 25.50 | 26.00 | 27.00 |
| Shares Outstanding (million shares) | 3.85 | 3.85 | 3.85 | 3.57 | 3.57 |
Source: Calculated by Omega Investment based on FactSet’s standard criteria, rounded to the nearest whole number.