2026-10-23
Home
Japanese

Omega Investment Co., Ltd.
Itoki (Company note – 1Q update)

| Share price (5/27) | ¥2,713 | Dividend Yield (26/12 CE) | 3.32 % |
| 52weeks high/low | ¥3,695/1,973 | ROE(25/12 act) | 17.7 % |
| Avg Vol (3 month) | 221 thou shrs | Operating margin (25/12 act) | 8.9 % |
| Market Cap | ¥144.8 bn | Beta (5Y Monthly) | 0.35 |
| Enterprise Value | ¥153.1 bn | Shares Outstanding | 53.38 mn shrs |
| PER (26/12 CE) | 11.97 X | Listed market | TSE Prime |
| PBR (25/12 act) | 2.27 X |
| Click here for the PDF version of this page |
| PDF version |
1Q results were another strong start this fiscal year. Both core businesses performed well.
◇ FY12/2026 1Q results highlights: both businesses performed well
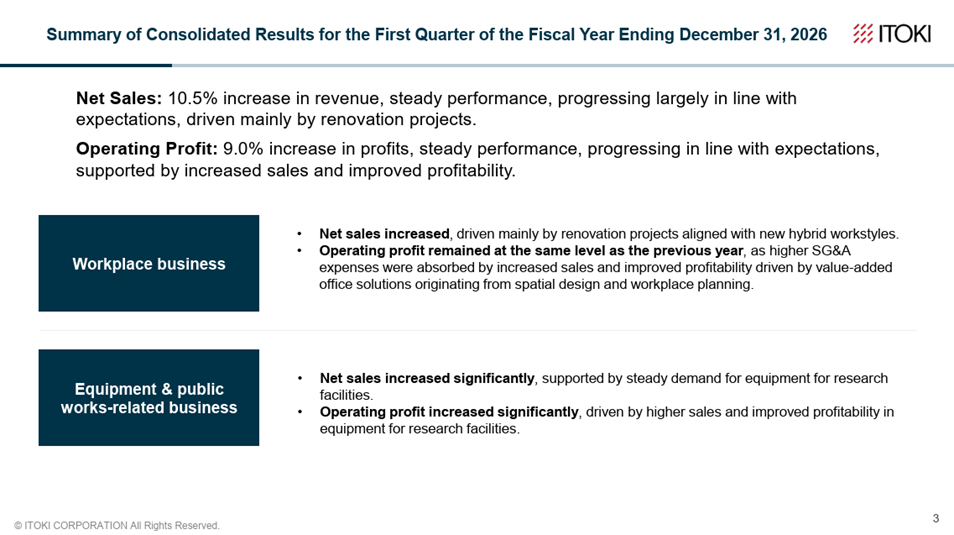
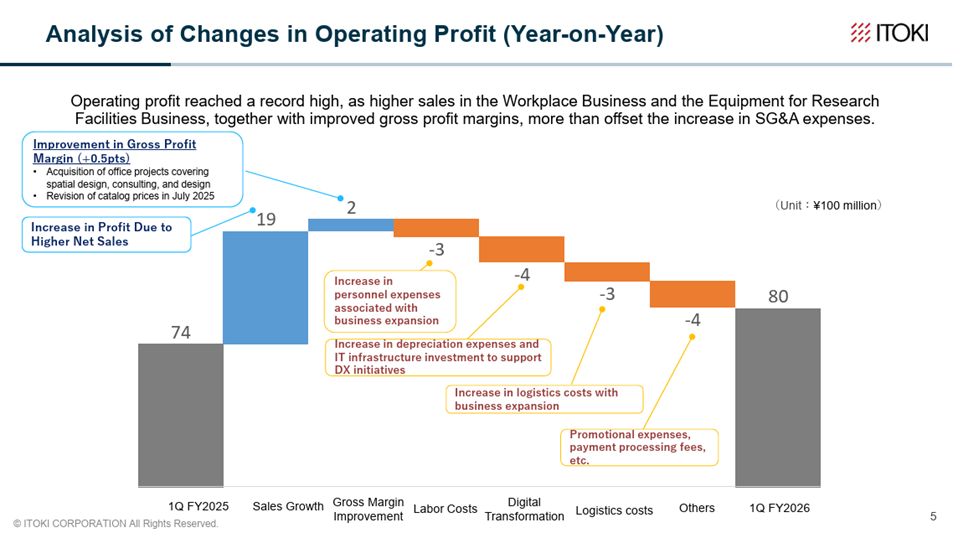
The FY12/2026 1Q results announced by Itoki on May 7, 2026, showed that both the Workplace Business and the Equipment & Public Works-Related Business performed well, resulting in increases in both revenue and profit. Net sales were 47.22 billion yen (+11% YoY), operating profit was 8.09 billion yen (+9% YoY), ordinary profit was 8.09 billion yen (+11% YoY), and quarterly profit attributable to owners of parent was 5.54 billion yen (+13% YoY). Performance has been favorable as expected by the Company.
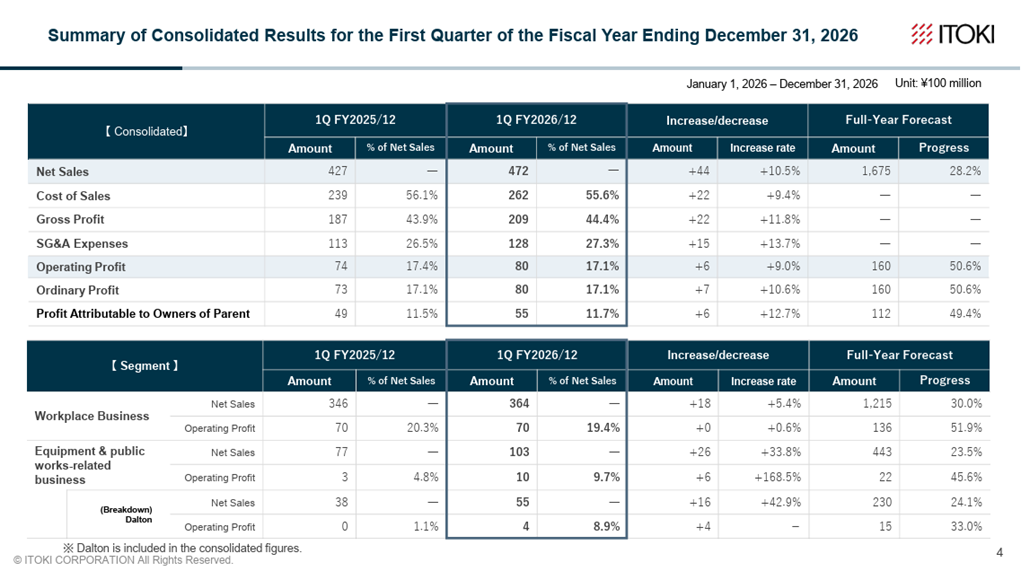
Looking at results by business, the Workplace Business posted net sales of 36.4 billion yen (+1.8 billion yen), operating profit of 7.06 billion yen (+45 million yen), and an operating profit margin of 19.4% (-0.9 points). With demand for office space renewal increasing as one of the pillars of customers’ investment in human capital (specifically, a means of recruiting and retaining human resources and improving productivity), the Company is deploying nationwide, not limited to the Tokyo metropolitan area, a one-stop integrated sales strategy that specs in from design and also undertakes construction [Office 2.0 domain (comprehensive spatial proposals)], and this is reflected in results. The operating profit margin declined because personnel and IT-related expenses increased as planned; the underlying profitability trend has not changed.
The Equipment & Public Works-Related Business posted net sales of 10.3 billion yen (+2.6 billion yen), operating profit of 1.0 billion yen (+0.6 billion yen), and an operating profit margin of 9.7% (+4.9 points). Equipment for research facilities handled by subsidiary Dalton has been steady.
There are no noteworthy changes in the balance sheet.
◇ FY12/2026 full-year earnings forecast: no change to the forecast of increases in both revenue and profit; progress is steady
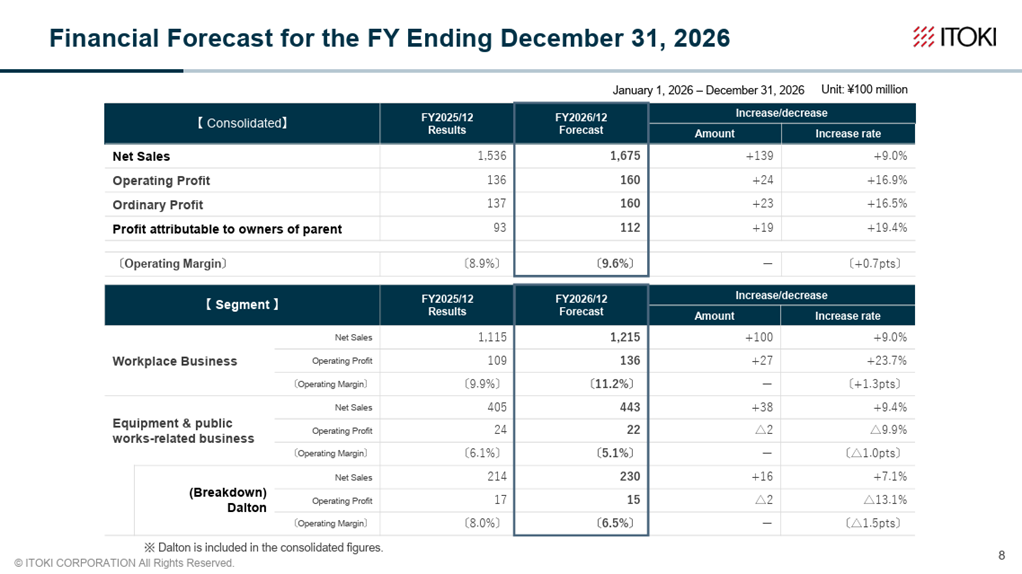
There is no change to the full-year earnings forecast, and the Company aims for consecutive record-high profit updates by increasing both revenue and profit. Specifically, net sales are forecast at 167.5 billion yen (+4% YoY), operating profit at 16.0 billion yen (+14% YoY), ordinary profit at 16.0 billion yen (+14% YoY), profit attributable to owners of parent at 11.2 billion yen (+11% YoY), and dividends per share at 90 yen (a 15 yen increase; forecast payout ratio of 40%).
Confidence in achieving this full-year earnings forecast is considered sufficiently high.
First, progress in 1Q is steady. Progress was 28.2% for net sales and 50.6% for operating profit, with operating profit exceeding half of the full-year forecast. The progress rate for operating profit is slightly slower YoY, but this appears to be largely due to strategic expense investments, and we expect the effects of these investments to emerge steadily going forward.
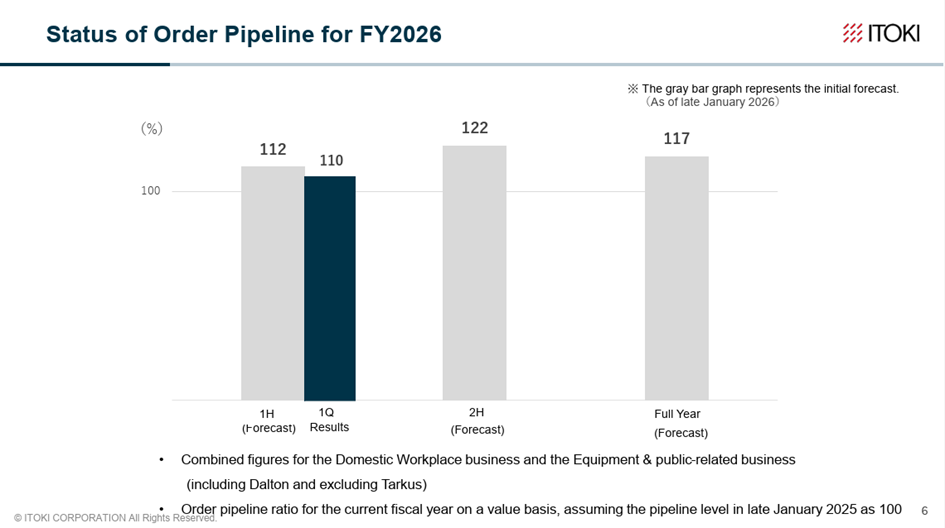
Second, the deal pipeline is steadily accumulating. The business base is expanding to include demand for the renewal of regional and factory offices, and, in addition, the timing of business talks is becoming more evenly distributed throughout the year. The deal pipeline for the second half is also growing, and it is assumed that performance will steadily improve quarter by quarter going forward.
Third, responses to rising inflation and geopolitical risks are progressing. In addition to the higher added value of business talks progressing through the expansion of the Office 2.0 domain, procurement of materials for the time being has been secured, and taking into account cost increases due to inflation, the Company plans a product price revision of 3% to 8% on July 1, 2026.
◇ Topics
The Company is sequentially renewing its own offices and has customers tour them to proceed with business talks. The schedule for renewal openings going forward is Tokyo in June 2026, Shanghai in autumn 2026, Fukuoka in December 2026, and Osaka in May 2027.
Also, in May 2026, a book edited and written by Toshiya Shimizu, the Company’s executive officer and director of the Central Research Institute, titled “Strengthen your company in the office: when the ‘working space’ changes, the ‘working people’ also change,” is scheduled to be published.
◇ Share price trends and future points of interest
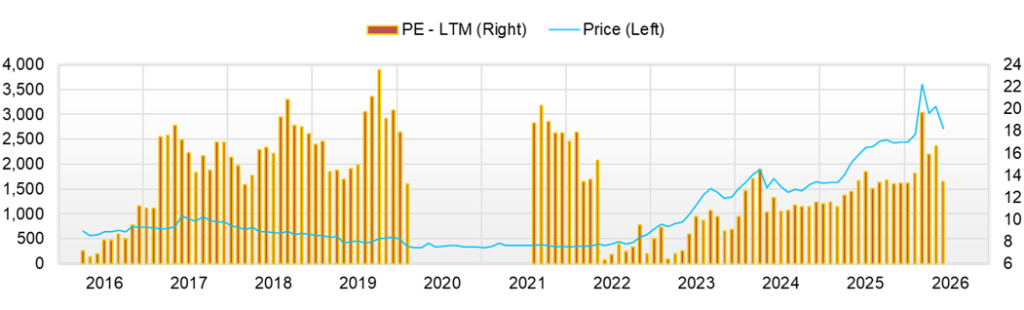
The Company’s share price has been steadily rising since 2022 and surged to 3,695 yen (a year-to-date high), triggered by the announcement of the FY12/2025 full-year results. However, the share price has since adjusted gradually and is currently at roughly the same level as around the time of the announcement of the FY12/2025 full-year results.
This share price trend is thought to reflect that while the current strong performance supports the downside of the share price, the rate of increases in both revenue and profit for FY12/2026 is likely to slow compared with FY12/2025, and the share price has entered an interval between catalysts, reducing clues for further upside.
Given that there is no marked overheating in indicators such as PER and PBR, it is assumed that as the interval between share price catalysts ends and clues about the next medium-term management plan become available, upside pursuit will resume. The Company’s all-time high since listing was 3,800 yen in 1990, and if developments exceed this level, market attention should increase further. The next-largest catalyst is the next medium-term management plan, but, with this in mind, organizing the points of interest for the time being yields the following.
- From 2Q onward, performance continues to expand steadily, and confidence in the FY12/2026 earnings forecast increases further.
- In the Office 2.0 domain of the Workplace Business, the Company further captures demand for renewal of regional offices and factory offices.
- The services in the Office 3.0 domain gain greater customer support, and the picture becomes clearer of how they contribute to net sales and profit.
- The business potential of subsidiary Dalton’s LAB 1.0/LAB 2.0/LAB 3.0 strategy, which applies the successful model of the Workplace Business to the Equipment & Public Works-Related Business, becomes more concrete.
- In the Equipment & Public Works-Related Business, special doors and maintenance services also expand.
- A path is shown for strengthening proposal capabilities and improving productivity through the utilization of AI.
- Concretization of overseas expansion.
- As a result of these, the expansion of the customer base and the uplift of recurring revenue progress, and the Company moves up to the next stage of a stable growth trajectory in the medium to long term.
- As a result of the above, the equity spread expands further.
- The long-term outlook for financial targets and the Company’s views on M&A are clearly indicated.
Company profile
Itoki Corporation (hereinafter, the “Company”) is an office furniture manufacturer that designs tomorrow’s “work.” Founded in 1890. In addition to manufacturing office furniture, it engages in architecture, interior design, and related fields. Since 2022, Koji Minato has served as president, and under his leadership, the transformation of the corporate constitution is progressing. The Company advocates office DX and Office 3.0 and aims to raise added value. In the three-year medium-term management plan “RISE TO GROWTH 2026,” whose final year is FY12/2026, under the theme of “enhancing sustainable growth,” it promotes the priority strategy “7 Flags” and ESG strategies, aiming to achieve net sales of 150.0 billion yen, operating profit of 14.0 billion yen, and ROE of 15% in FY12/2026, and it almost achieved this ahead of schedule in December 2025. Expectations are rising for further evolution of Office 3.0 and the next medium-term management plan.
Key financial data
| Unit: million yen | 2021 | 2022 | 2023 | 2024 | 2025 | 2026 CE |
| Sales | 115,905 | 123,324 | 132,985 | 138,460 | 153,682 | 167,500 |
| EBIT (Operating Income) | 2,561 | 4,582 | 8,524 | 10,078 | 13,686 | 16,000 |
| Pretax Income | 1,523 | 8,372 | 8,378 | 10,071 | 14,099 | |
| Net Profit Attributable to Owner of Parent | 1,166 | 5,294 | 5,905 | 7,183 | 9,382 | 11,200 |
| Cash & Short-Term Investments | 17,451 | 26,976 | 24,795 | 22,482 | 21,629 | |
| Total assets | 103,898 | 115,288 | 117,437 | 120,521 | 130,724 | |
| Total Debt | 20,091 | 19,487 | 17,308 | 37,924 | 34,627 | |
| Net Debt | 2,640 | -7,489 | -7,487 | 15,442 | 12,998 | |
| Total liabilities | 58,818 | 65,374 | 62,434 | 71,174 | 73,908 | |
| Total Shareholders’ Equity | 44,931 | 49,871 | 54,960 | 49,260 | 56,709 | |
| Net Operating Cash Flow | 2,774 | 5,804 | 6,321 | -1,000 | 8,942 | |
| Capital Expenditure | 2,110 | 4,145 | 3,316 | 6,036 | 6,017 | |
| Net Investing Cash Flow | -1,170 | 4,923 | -4,012 | -7,107 | -3,847 | |
| Net Financing Cash Flow | -2,658 | -1,426 | -4,148 | 5,905 | -5,941 | |
| Free Cash Flow | 664 | 1,659 | 3,005 | -4,146 | 5,193 | |
| ROA (%) | 1.12 | 4.83 | 5.08 | 6.04 | 7.47 | |
| ROE (%) | 2.63 | 11.17 | 11.27 | 13.79 | 17.71 | |
| EPS (Yen) | 25.8 | 117.0 | 130.3 | 147.0 | 190.2 | 226.7 |
| BPS (Yen) | 993.9 | 1,101.3 | 1,212.0 | 1,001.1 | 1,147.8 | |
| Dividend per Share (Yen) | 15.00 | 37.00 | 42.00 | 55.00 | 75.00 | 90.00 |
| Shares Outstanding (Million shares) | 45.66 | 45.66 | 45.66 | 53.38 | 53.38 |
Source: Omega Investment from company materials
Share price
Quarterly topics
【 Financial highlights 】
Source: Company material
【 Analysis of changes in operating profits 】
Source: Company material
Quarterly topics
【 Performance in each segment 】
Source: Company material
【 Financial forecast for FY ending December 2026 】
Source: Company material
【Situation of order pipeline for FY2026】
Source: Company material
Financial data (quarterly basis)
| Unit: million yen | 2024/12 | 2025/12 | 2026/12 | ||||||
| 1Q | 2Q | 3Q | 4Q | 1Q | 2Q | 3Q | 4Q | 1Q | |
| (Income Statement) | |||||||||
| Sales | 40,918 | 31,592 | 29,613 | 36,337 | 42,744 | 36,500 | 33,214 | 41,224 | 47,224 |
| Year-on-year | 10.7% | 1.2% | 3.3% | 0.6% | 4.5% | 15.5% | 12.2% | 13.4% | 10.5% |
| Cost of Goods Sold (COGS) | 24,545 | 19,888 | 17,644 | 21,182 | 23,993 | 21,381 | 19,671 | 23,825 | 26,255 |
| Gross Income | 16,373 | 11,704 | 11,969 | 15,155 | 18,751 | 15,119 | 13,543 | 17,399 | 20,969 |
| Gross Income Margin | 40.0% | 37.0% | 40.4% | 41.7% | 43.9% | 41.4% | 40.8% | 42.2% | 44.4% |
| SG&A Expense | 10,333 | 10,878 | 11,029 | 12,883 | 11,328 | 11,915 | 12,556 | 15,327 | 12,879 |
| EBIT (Operating Income) | 6,040 | 826 | 940 | 2,272 | 7,423 | 3,204 | 987 | 2,072 | 8,090 |
| Year-on-year | 26.4% | -62.8% | 428.1% | 69.0% | 22.9% | 287.9% | 5.0% | -8.8% | 9.0% |
| Operating Income Margin | 14.8% | 2.6% | 3.2% | 6.3% | 17.4% | 8.8% | 3.0% | 5.0% | 17.1% |
| EBITDA | 6,753 | 1,582 | 1,684 | 3,166 | 8,189 | 4,055 | 2,373 | 3,236 | 9,193 |
| Pretax Income | 6,006 | 1,328 | 1,035 | 1,702 | 7,257 | 3,208 | 1,132 | 2,502 | 8,063 |
| Consolidated Net Income | 4,104 | 985 | 725 | 1,409 | 4,910 | 2,045 | 711 | 1,734 | 5,537 |
| Minority Interest | 2 | 1 | 11 | 25 | -6 | 2 | 10 | 11 | -1 |
| Net Income ATOP | 4,101 | 985 | 714 | 1,383 | 4,916 | 2,044 | 699 | 1,723 | 5,538 |
| Year-on-year | 24.4% | -30.2% | 253.5% | 38.9% | 19.9% | 107.5% | -2.1% | 24.6% | 12.7% |
| Net Income Margin | 10.0% | 3.1% | 2.4% | 3.8% | 11.5% | 5.6% | 2.1% | 4.2% | 11.7% |
| (Balance Sheet) | |||||||||
| Cash & Short-Term Investments | 24,751 | 28,513 | 30,536 | 22,482 | 24,296 | 25,288 | 21,847 | 21,629 | 21,128 |
| Total assets | 127,459 | 120,701 | 120,935 | 120,521 | 132,329 | 126,248 | 123,538 | 130,724 | 137,216 |
| Total Debt | 38,662 | 41,566 | 42,881 | 37,924 | 44,114 | 41,268 | 37,467 | 35,063 | 42,072 |
| Net Debt | 13,911 | 13,053 | 12,345 | 15,442 | 19,818 | 15,980 | 15,620 | 13,434 | 20,944 |
| Total liabilities | 81,595 | 73,584 | 73,305 | 71,174 | 80,689 | 72,262 | 68,583 | 73,908 | 78,052 |
| Total Shareholders’ Equity | 45,818 | 47,068 | 47,571 | 49,260 | 51,562 | 53,908 | 54,864 | 56,709 | 59,060 |
| (Profitability %) | |||||||||
| ROA | 5.52 | 5.41 | 5.85 | 6.04 | 6.16 | 7.34 | 7.40 | 7.47 | 7.42 |
| ROE | 13.76 | 12.51 | 13.41 | 13.79 | 16.43 | 17.94 | 17.66 | 17.71 | 18.09 |
| (Per-share) Unit: JPY | |||||||||
| EPS | 85.7 | 20.0 | 14.5 | 28.1 | 99.9 | 41.4 | 14.1 | 34.9 | 112.1 |
| BPS | 933.1 | 956.6 | 966.8 | 1,001.1 | 1,047.9 | 1,091.1 | 1,110.4 | 1,147.8 | 1,195.4 |
| Dividend per Share | 0.00 | 0.00 | 0.00 | 55.00 | 0.00 | 0.00 | 0.00 | 75.00 | 0.00 |
| Shares Outstanding (million shares) | 53.38 | 53.38 | 53.38 | 53.38 | 53.38 | 53.38 | 53.38 | 53.38 | 53.38 |
Source: Omega Investment from company materials
Financial data (full-year basis)
| Unit: million yen | 2016/12 | 2017/12 | 2018/12 | 2019/12 | 2020/12 | 2021/12 | 2022/12 | 2023/12 | 2024/12 | 2025/12 |
| (Income Statement) | ||||||||||
| Sales | 101,684 | 108,684 | 118,700 | 122,174 | 116,210 | 115,905 | 123,324 | 132,985 | 138,460 | 153,682 |
| Year-on-year | -4.5% | 6.9% | 9.2% | 2.9% | -4.9% | -0.3% | 6.4% | 7.8% | 4.1% | 11.0% |
| Cost of Goods Sold | 65,071 | 70,012 | 77,479 | 80,712 | 74,536 | 74,186 | 77,575 | 80,744 | 83,259 | 88,870 |
| Gross Income | 36,613 | 38,672 | 41,221 | 41,462 | 41,674 | 41,719 | 45,749 | 52,241 | 55,201 | 64,812 |
| Gross Income Margin | 36.0% | 35.6% | 34.7% | 33.9% | 35.9% | 36.0% | 37.1% | 39.3% | 39.9% | 42.2% |
| SG&A Expense | 33,862 | 35,761 | 39,336 | 40,776 | 40,089 | 39,158 | 41,167 | 43,717 | 45,123 | 51,126 |
| EBIT (Operating Income) | 2,751 | 2,911 | 1,885 | 686 | 1,585 | 2,561 | 4,582 | 8,524 | 10,078 | 13,686 |
| Year-on-year | -33.6% | 5.8% | -35.2% | -63.6% | 131.0% | 61.6% | 78.9% | 86.0% | 18.2% | 35.8% |
| Operating Income Margin | 2.7% | 2.7% | 1.6% | 0.6% | 1.4% | 2.2% | 3.7% | 6.4% | 7.3% | 8.9% |
| EBITDA | 5,316 | 5,551 | 4,615 | 4,436 | 5,603 | 6,148 | 7,821 | 11,417 | 13,185 | 17,853 |
| Pretax Income | 2,918 | 3,401 | 3,083 | 938 | 1,277 | 1,523 | 8,372 | 8,378 | 10,071 | 14,099 |
| Consolidated Net Income | 1,850 | 2,442 | 1,744 | -579 | -355 | 933 | 5,181 | 5,907 | 7,223 | 9,400 |
| Minority Interest | -56 | 40 | 19 | -28 | -119 | -233 | -113 | 1 | 39 | 17 |
| Net Income ATOP | 1,907 | 2,402 | 1,725 | -550 | -235 | 1,166 | 5,294 | 5,905 | 7,183 | 9,382 |
| Year-on-year | -57.9% | 26.0% | -28.2% | -131.9% | -57.3% | -596.2% | 354.0% | 11.5% | 21.6% | 30.6% |
| Net Income Margin | 1.9% | 2.2% | 1.5% | -0.5% | -0.2% | 1.0% | 4.3% | 4.4% | 5.2% | 6.1% |
| (Balance Sheet) | ||||||||||
| Cash & Short-Term Investments | 19,839 | 19,977 | 16,529 | 17,030 | 18,246 | 17,451 | 26,976 | 24,795 | 22,482 | 21,629 |
| Total assets | 95,681 | 102,451 | 108,710 | 108,778 | 105,096 | 103,898 | 115,288 | 117,437 | 120,521 | 130,724 |
| Total Debt | 19,931 | 17,892 | 16,834 | 22,166 | 21,742 | 20,091 | 19,487 | 17,308 | 37,924 | 34,627 |
| Net Debt | 92 | -2,085 | 305 | 5,136 | 3,496 | 2,640 | -7,489 | -7,487 | 15,442 | 12,998 |
| Total liabilities | 50,275 | 54,997 | 61,200 | 62,940 | 60,901 | 58,818 | 65,374 | 62,434 | 71,174 | 73,908 |
| Total Shareholders’ Equity | 44,949 | 46,863 | 46,857 | 45,370 | 43,812 | 44,931 | 49,871 | 54,960 | 49,260 | 56,709 |
| (Cash Flow) | ||||||||||
| Net Operating Cash Flow | 5,072 | 3,565 | 1,384 | 3,586 | 4,561 | 2,774 | 5,804 | 6,321 | -1,000 | 8,942 |
| Capital Expenditure | 1,641 | 1,333 | 3,477 | 3,226 | 1,729 | 2,110 | 4,145 | 3,316 | 6,036 | 6,017 |
| Net Investing Cash Flow | -4,044 | -2,971 | -3,094 | -3,221 | -1,152 | -1,170 | 4,923 | -4,012 | -7,107 | -3,847 |
| Net Financing Cash Flow | -2,571 | -706 | -2,463 | 0 | -2,267 | -2,658 | -1,426 | -4,148 | 5,905 | -5,941 |
| Free Cash Flow | 3,663 | 2,342 | -1,924 | 635 | 2,832 | 664 | 1,659 | 3,005 | -4,146 | 5,193 |
| (Profitability ) | ||||||||||
| ROA (%) | 1.97 | 2.42 | 1.63 | -0.51 | -0.22 | 1.12 | 4.83 | 5.08 | 6.04 | 7.47 |
| ROE (%) | 4.21 | 5.23 | 3.68 | -1.19 | -0.53 | 2.63 | 11.17 | 11.27 | 13.79 | 17.71 |
| Net Margin (%) | 1.87 | 2.21 | 1.45 | -0.45 | -0.20 | 1.01 | 4.29 | 4.44 | 5.19 | 6.11 |
| Asset Turn | 1.05 | 1.10 | 1.12 | 1.12 | 1.09 | 1.11 | 1.13 | 1.14 | 1.16 | 1.22 |
| Assets/Equity | 2.14 | 2.16 | 2.25 | 2.36 | 2.40 | 2.36 | 2.31 | 2.22 | 2.28 | 2.37 |
| (Per-share) Unit: JPY | ||||||||||
| EPS | 40.1 | 52.7 | 37.8 | -12.1 | -5.2 | 25.8 | 117.0 | 130.3 | 147.0 | 190.2 |
| BPS | 986.8 | 1,028.9 | 1,027.4 | 995.8 | 970.4 | 993.9 | 1,101.3 | 1,212.0 | 1,001.1 | 1,147.8 |
| Dividend per Share | 13.00 | 13.00 | 13.00 | 13.00 | 13.00 | 15.00 | 37.00 | 42.00 | 55.00 | 75.00 |
| Shares Outstanding (million shares) | 52.14 | 52.14 | 45.61 | 45.66 | 45.66 | 45.66 | 45.66 | 45.66 | 53.38 | 53.38 |
Source: Omega Investment from company materials