2026-07-27
Home
Japanese

Omega Investment Co., Ltd.
Ricksoft (Investment Report – Basic)
| Share price (5/18) | ¥772 | Dividend Yield (27/2 CE) | 0.0 % |
| 52weeks high/low | ¥770/1,230 | ROE(26/2 act) | 8.3 % |
| Avg Vol (3 month) | 4.0 thou shrs | Operating margin (TTM) | 3.5 % |
| Market Cap | ¥3.51 bn | Beta (5Y Monthly) | 0.10 |
| Enterprise Value | ¥1.93 bn | Shares Outstanding | 4.550 mn shrs |
| PER (27/2 CE) | 21.7 X | Listed market | TSE Growth |
| PBR (26/2 act) | 1.1 X |
| Click here for the PDF version of this page |
| PDF version |
Net cash protects the downside of the shares. Active accounts should wait until profitability improvement becomes visible.
Investment conclusion
Net cash comparable to market capitalization. A reversal in the gross profit margin and a clear capital allocation plan are essential for share-price gains.
The investment conclusion for Ricksoft, Co., Ltd. (hereinafter, the “Company”) is that maintaining the holding would be reasonable. If not held, investors should take a small position, and additional investment should wait for confirmation of improvement in the gross profit margin. In the previous report, the conclusion was “if not held, initiate a new position; if held, maintain; and buy more on pullbacks.” Based on the full-year results for FY2/2026 this time, while maintaining the investment conclusion, we believe that the conditions for adding to the position should be made somewhat stricter. Among the criteria presented in the previous report as indispensable for an upgrade in share-price valuation, the accumulation of contract liabilities and the growth in Professional Services have been confirmed. Contract liabilities expanded to 4.476 billion yen at the end of FY2/2026, and visibility into future sales improved significantly. In addition, Professional Services sales totaled 1.403 billion yen, up 53.5% YoY, demonstrating progress in the shift to high-value-added areas. On the other hand, the bottoming out of the gross profit margin, which was the most important condition, has not been achieved. In FY2/2026, net sales were 10.893 billion yen, +20.4% YoY, maintaining high growth, but the gross profit margin declined to 21.8%, down 4.5 points YoY, and operating profit was limited to 377 million yen, down 17.8% YoY.
From the perspective of share-price valuation, the factors supporting the downside from the financial side are clear, while the decline in profitability is creating a structure that restrains the upside. Against a market capitalization of 3.9 billion yen, net cash is approximately 3.94 billion yen, at almost the same level, and downside resilience from the financial side is strong. The actual PBR of 1.17x is also close to net asset value, and there is no sense of overvaluation on the balance sheet. On the other hand, the forecast PER of 24.6x, based on current profits after the operating margin has fallen to 3.5%, optimistically discounts profit growth expectations. ROA of 3.23%, ROE of 8.31%, and ROIC of 8.31% are by no means low levels, exceeding WACC of 2.47%, and economic value continues to be created. Net cash supports the downside for the share price, but unless profitability improvement can be confirmed, the room for PER and PBR valuation multiples to rise is limited.
To reorganize the source of the Company’s strength again, it consists of implementation capabilities in Atlassian-related implementations and operational support for large enterprise customers, and customer touchpoints that can shift from license resale to a strategic partner-type, hands-on support. In the growth vision “Reignite2030,” the Company sets out a return to the starting point of providing added value tailored to customers, the establishment of industry-specific specialist teams, and EBITDA of 3.0 billion yen in 2030, and the direction of management is reasonable. Although the capital and business alliance with Vietnam-based BiPlus Vietnam Software Solutions can be viewed as a step toward strengthening overseas capabilities, quantitative disclosure of orders, sales, and profit contribution is currently limited and therefore does not constitute material for raising share-price valuation.
In summary, progress has been made in sales growth, contract liabilities, and the shift toward higher-value services. However, regarding the gross profit margin and the explanatory power of capital allocation, items remain to be confirmed before additional investment can be made more actively. The situation in which net cash is almost equal to market capitalization supports the downside for the share price. However, the continued absence of dividends and the lack of a clear capital allocation presentation are factors behind the share-price discount. Therefore, at present, we judge that it is reasonable to maintain holdings as the basic stance, limit non-holders to a small exploratory position, and make additional investment gradually only after confirming a reversal in the operating margin, the bottoming out of the gross profit margin, and the numerical prioritization of share buybacks, dividends, and growth investment.
1. Business model and business structure
From license resale to hands-on support that helps customers realize DX. The key to improving the gross profit margin is increasing the value added by services.
The Company’s business structure is a single segment, the Tool Solutions business, but in substance it is a BtoB model composed of three layers: “Technology Solutions,” “Professional Services,” and “In-house Products.” The core is domestic implementation support for overseas software centered on Atlassian, and the Company introduces project management and issue management tools such as Jira and Confluence to large enterprise customers in finance, manufacturing, IT, and other industries. Its characteristic is that it is not merely license sales, but combines pre-implementation Fit&Gap analysis, requirements organization, design, construction, customization, training, help desk, and operational support. The Company does not provide software as is; instead, it provides the construction of usage environments, functional additions, training, and other services in an integrated manner to resolve customer issues.
Looking at the sales composition in FY2/2026, Technology Solutions remained the largest revenue source, with sales of 8.863 billion yen, an 81.4% share, and a +19.7% YoY increase. This revenue mainly consists of license sales and implementation support for Atlassian products, and, strategically, the Company also handles advanced tools such as Workato and Miro. Professional Services rose sharply to 1.403 billion yen, a composition ratio of 12.9%, and +53.5% YoY. This includes consulting, SI, support, and other services, and the Company aims to provide continuous value, including BPO-type support, in peripheral areas. In-house Products were 625 million yen, with a 5.7% composition ratio and -13.6% YoY, and are a revenue source that sells add-ons that complement the functions of Atlassian products, such as WBS Gantt-Chart for Jira and Excel-like Issue Editor for Jira, in Japan and overseas.
The revenue recognition structure is also important for the investment conclusion. On-premises licenses are recorded in a lump sum at the time of sale. In contrast, cloud-type licenses, support, and BPO are prorated over the period or recognized monthly, so project sales and recurring billing coexist. Furthermore, in Professional Services, through RickCloud, the Company operates and manages customers’ cloud environments 24 hours a day, 365 days a year, and also handles security response and monitoring. This is a model that deeply integrates with customers’ systems and becomes an element that increases customer retention and reduces switching costs.
As an investment implication, the Company’s growth potential has shifted from the volume of license sales to the amount of services it can accumulate from customer touchpoints. License sales contribute to scale expansion, but they are also susceptible to procurement costs and price competition, and can become a main driver of a decline in gross profit margin. Therefore, the focus of share-price rerating is whether the Company can use the Atlassian and other implementation base as an entry point, bundle consulting, SI, BPO, operational support, and In-house Products, and deeply enter customers’ DX operational foundations. The growth in Professional Services can be evaluated as an initial result of this transformation, but it has not yet been sufficiently linked to profitability improvement. Going forward, rather than the sales growth rate, improvement in the service mix, the quality of contract liabilities, and a reversal in the gross profit margin will be the core indicators for measuring the evolution of the business model.
2. Business strengths
Implementation capabilities that deeply enter the front line of large enterprise DX. The strength is not tool sales, but the ability to translate customer issues.
The Company’s strength is not simply that it can sell Atlassian products, but that it can implement advanced overseas tools aligned with the operational front lines of Japanese companies and help them take root. The Company provides Atlassian-based software not only through license sales but also through Fit&Gap analysis, design, construction, customization, training, and operational support. From the customer’s perspective, this is not the act of buying a tool, but an initiative to change business processes, development management, and project operations, and the quality of operations after implementation determines continued use. Therefore, the Company’s competitiveness lies not in the margin on purchasing and sales, but in implementation know-how that translates customers’ operational issues into tool functions and embeds them in the front line.
The quality of the customer base is also a strength. In its growth vision, the Company states that, in Japan, it has many major companies, including leading companies in their industries, as customers, and lists 150 customers on the TSE Prime Market and 8,000 global customers. DX support for large enterprises requires time for decision-making during implementation, but once incorporated into the operational foundation, it tends to lead to cross-departmental deployment and continuous operational support. This is consistent with the Company’s phased expansion (land-and-expand) strategy, which is a sales strategy of expanding from initial implementation in part of an organization to other departments and company-wide standards.
Another strength is the ability to layer services based on customer issues. In FY2/2026, Technology Solutions sales grew to 8.863 billion yen, +19.7% YoY, and Professional Services sales expanded significantly to 1.403 billion yen, +53.5% YoY. This indicates that the Company is shifting from a model centered on license resale to a high-value-added model that includes consulting, SI, support, and operational support. Nevertheless, the gross profit margin in the same fiscal year declined to 21.8%, and at this stage, it cannot be said that the strengths have been fully translated into profitability.
As an investment implication, the Company’s strengths have a certain persuasiveness for “reproducibility of sales growth,” but “reproducibility of profitability improvement” remains at the verification stage. Large enterprise customers, the Atlassian ecosystem, In-house Products, and operational support foundations such as RickCloud are assets that deepen customer touchpoints. On the other hand, unless improvements in service unit prices, utilization rates, and project mix are sufficient to absorb increases in license costs and price competition, share-price valuation is likely to remain at a level that accounts for net cash and around 1x PBR. The future focus is whether the Company’s implementation capabilities lead to a reversal in the gross profit margin and to the maintenance of ROIC.
3. Revenue structure by business
The sales pillar is Technology, the key to profit improvement is Professional, and In-house Products are awaiting reacceleration.
The Company’s revenue structure is one in which Technology Solutions serves as the quantitative sales foundation, Professional Services adds value, and In-house Products aim to add thickness to recurring revenue. Net sales in FY2/2026 were 10.893 billion yen, +20.4% YoY, but operating profit was 377 million yen, -17.8% YoY, and the Company is in a phase where revenue growth does not directly turn into profit growth. Gross profit maintained the previous fiscal year’s level at 2.373 billion yen, while the gross profit margin declined 4.5 pt to 21.8% from 26.3% in the previous fiscal year. The Company explains that higher Professional Services sales offset the increase in license costs, and that gross profit remained unchanged from the previous fiscal year.
Technology Solutions, the largest pillar, posted sales of 8.863 billion yen, an 81.4% composition ratio, and +19.7% YoY growth. It mainly consists of license sales and implementation support focused on Atlassian, and while it drives sales scale expansion, it is susceptible to procurement costs and price competition. On-premises sales are recorded in a lump sum at the time of sale, while cloud-type sales are recorded monthly. Hence, changes in the license composition and contract forms affect both quarterly sales and contract liabilities. Technology Solutions is an entry point that expands the Company’s customer touchpoints, but, on its own, it has limited ability to raise profitability.
Professional Services posted the highest growth rate, with sales of 1.403 billion yen, a 12.9% composition ratio, and a 53.5% YoY increase. SI services are estimated and performed for each project and recorded in a lump sum at acceptance, while support services, BPO, and other services are recorded monthly or prorated over the period for annual contracts. If the Company can capture operations, establishment, and improvement support after implementation, this becomes the revenue source closest to the Company’s strategic partner-type model. However, as of FY2/2026, despite the growth of this service, the company-wide gross profit margin declined, and there remains room to improve personnel utilization rates, unit prices, and the project mix.
In-house Products had sales of 625 million yen, a 5.7% composition ratio, and a -13.6% YoY decline. This is a model that sells add-ons complementing Atlassian products in Japan and overseas, and originally is an area with high continuity and room for overseas expansion. On the other hand, because the Company explains that in FY2/2026, through operational optimization in line with actual revenue conditions, part of In-house Products sales was transferred to contract liabilities as revenue from the next fiscal year onward, the evaluation should not be lowered only because of a short-term revenue decline. For investment, whether Technology sales growth, the profitability of Professional, and the regrowth of In-house Products progress at the same time will be the core issue for maintaining ROIC and rerating the share price.
4. Overseas business
Overseas is not yet a profit pillar. Quantifying In-house Products and Asian expansion is the focus.
It is reasonable to position the Company’s overseas business, at present, not as an independent revenue pillar alongside the domestic business, but as a future growth area for expanding overseas sales of In-house Products and increasing the ability to serve global customers. The Company group consists of two companies: Ricksoft in Japan and the U.S. subsidiary, Ricksoft, Inc. Ricksoft, Inc. is based in the United States and sells the developed software globally through the Atlassian Marketplace. The Company has also indicated a policy under which Ricksoft, Inc. works with the technology team and addresses UI/UX improvements sought by overseas users.
In terms of business content, the core of overseas expansion lies in in-house-developed add-ons that complement the functionality of Atlassian products such as Jira and Confluence. Representative examples include WBS Gantt-Chart for Jira, used for project management, and the Excel-like Issue Editor for Jira, which allows users to edit Jira issues with a feel similar to spreadsheet software. Unlike domestic implementation support, these can be sold through the Marketplace and, in theory, are relatively easy to scale across national borders. However, In-house Products sales in FY2/2026 were 625 million yen, down 13.6% YoY, and at this stage, it cannot be said that overseas products are strongly driving company-wide growth.
The strategic significance of overseas expansion is increasing. In FY2/2026, the Company entered into a capital and business alliance with BiPlus Vietnam Software Solutions Joint Stock Company. It announced that it had fully launched global business development to support overseas demand from enterprise customers, starting with the Asian market. This indicates that, in response to overseas demand from enterprise customers with bases in Japan and abroad, the Company is seeking to strengthen its global capabilities, development, and delivery structures. At present, quantitative disclosure of unified platform projects, including overseas bases and individual orders and sales contribution from the BiPlus alliance, is limited, and these should be positioned as items for future confirmation in investment evaluation.
Investment evaluation should continue to be viewed cautiously. In its growth vision, the Company targets 8,000 global customers, and the expansion of overseas touchpoints has been confirmed, but quantitative disclosure of regional sales and overseas profit margins is limited. Therefore, overseas business is not a main valuation factor at present, but is a future material for raising valuation. The future points to confirm are three: (1) whether In-house Products sales through Ricksoft, Inc. regrow, (2) how much the BiPlus alliance contributes to orders, sales, and profits, and (3) whether overseas capabilities lead to higher unit prices and contract expansion in projects for large domestic enterprises. If overseas business does not remain at the concept stage and leads to improvements in gross profit margin and ROIC, expectations for earnings expansion through overseas development may be added to the current share price, which is centered on net cash valuation.
5. Major shareholders, shareholder composition, and supply-demand implications
Stable holdings by HS KK and additional purchases by Hikari Tsushin support the downside, but the thinness of floating shares amplifies share-price fluctuations.
The Company’s shareholder composition is concentrated, with stable holders centered on HS KK and external investors with a medium- to long-term orientation occupying the upper ranks. From a supply-demand perspective, downside resilience and liquidity risk coexist. The ownership ratio of the total major holders on a major-holder basis is 67.84%, and the floating share ratio is 37.79%. The largest shareholder is HS KK, with an ownership ratio of 43.95%, 2.000 million shares held, and no change in the number of shares held over the past six months. This indicates the presence of a dominant, stable shareholder and is a factor that restrains short-term deterioration in supply and demand. On the other hand, because floating shares are limited, liquidity constraints prevent institutional investors from including the stock on a larger scale.
The point to watch most closely on the supply-demand side is the increase in Hikari Tsushin’s holdings, with an ownership ratio of 10.27%, 468,000 shares held, and a 46,000-share increase over the past six months. In a microcap stock with a market capitalization of around 3.9 billion yen, the presence of an external major shareholder holding more than 10% and increasing its holdings tends to become a supply-and-demand support factor during share-price declines. Hikari Tsushin’s investment intent should not be over-speculated on, but given the approximately 3.94 billion yen in net cash and the actual PBR of 1.17x, it can also be viewed as a medium- to long-term holding focused on the strength of the balance sheet.
Among institutional investors, SPARX Asset Management holds 3.72%, or 169,000 shares, and as a breakdown of this, Sparx Japan Small Cap Fund holds 1.25%, or 57,000 shares. In addition, Sawakami Asset Management holds 1.91%, or 87,000 shares, and Sawakami Fund is also listed at the same level. The fact that holdings by small-cap funds and long-term investors can be confirmed indicates that the Company’s shares are not merely a short-term supply-demand name, but are the subject of a certain level of evaluation from both financial safety and medium-term growth perspectives. Among individuals and related parties, Mr. Hiroshi Onuki holds 3.28% (149,000 shares), and Mr. Norio Hattori holds 2.47% (112,000 shares). Ricksoft Co., Ltd. also holds 1.10% (50,000 shares) as treasury shares.
As an investment implication, shareholder composition should be evaluated as either positive or neutral. HS KK’s high ownership ratio, Hikari Tsushin’s additional purchases, and the holdings by SPARX and Sawakami may support the share price through supply-and-demand dynamics. On the other hand, the limited market supply, reflected in a floating share ratio of 37.79%, supports share-price gains when positive materials emerge, but when the market’s reception of earnings content or gross profit margin trends becomes cautious, low liquidity can increase share-price fluctuations. Therefore, in evaluating supply and demand for the Company’s shares, it is necessary to continue confirming not only the stability of major shareholders but also liquidity, volume, the use of treasury shares, and changes in Hikari Tsushin’s holdings. At present, the shareholder composition is material that supports the downside, but the main factors for a share-price rerating remain a reversal in the gross profit margin and clarification of capital allocation.
6. Management policy, medium-term management plan, and growth scenario
Reignite2030 is the reignition of the earnings profile. The focus of growth is the extent to which becoming a strategic partner has been implemented.
The Company’s management policy is to expand its business domain from the conventional provision of valuable tools to a model that delivers added value tailored to customers. As its vision, the Company states, “Create the future of work with DX, AI, and new ideas.” In its growth vision, with “Reignite2030” as the keyword, it indicates a policy of realizing new customer experiences and value creation while incorporating DX and AI, rather than merely returning to its starting point. What is important is that the Company itself clearly states its reflection that, as a result of focusing too much on a license sales-centered way of thinking, the priority of providing added value tailored to customers, which is the Company’s original strength, has declined.
The core of the growth scenario is to become an indispensable strategic partner for customers. In the growth vision, the Company indicates a policy of building specialist teams for each industry, such as finance, manufacturing, and IT, and thinking together with customers, planning, and solving issues through project teams for each customer with respect to industry-specific cultures, business practices, and issues in system implementation. In Japan, the Company has a customer base of 150 TSE Prime-listed companies, and globally, 8,000 customers that have adopted its in-house software, with room to expand from partial implementation at large enterprises to company-wide standardization.
As numerical targets, the Company will execute strategic investments totaling approximately 6.0 billion yen by 2030 and aims for EBITDA of 3.0 billion yen in 2030. Investment targets are business model transformation, development of frameworks that form the core of the consulting business, establishment of industry-specific specialist teams in Japan, entry into global markets, and strengthening of the structure, including human resource investment and M&A. Progress in structural reform, organizational optimization, the establishment of a consulting team, and the service delivery structure, including the Vietnam team, has been indicated.
The investment evaluation is positioned as follows: the direction is reasonable, but profit verification remains necessary. In FY2/2026, net sales grew to 10.893 billion yen, +20.4% YoY, while operating profit was 377 million yen, -17.8% YoY, and the Company’s plan for FY2/2027 also forecasts a profit decline to operating profit of 200 million yen. Therefore, Reignite2030 is material for a share-price rerating, while at the same time, it is a plan that tolerates an investment burden and lower profitability in the short term. The future focus is the degree to which specialist teams and consulting-originated proposals are reflected in the Professional Services ratio, the gross profit margin, the quality of contract liabilities, and the maintenance of ROIC. At present, the growth scenario is in a phase that has moved from the “stated stage” to the “initial execution stage,” and to expand the upside room for the share price, a quarterly reversal in profitability and continuous disclosure of KPIs are necessary.
7. Outline and strategy of the medium-term management plan
The Company seeks “reignition” through 6.0 billion yen in investment, but is currently prioritizing structural transformation over short-term profits.
The outline of the Company’s medium-term strategy, “Reignite2030,” is to shift from a revenue structure centered on license sales to a high-profit earnings profile focused on providing added value tailored to customers. The Company sets out a policy to execute strategic investments totaling approximately 6.0 billion yen by 2030 and to aim for EBITDA of 3.0 billion yen in 2030. There are two major investment themes: first, business model transformation, and second, human resource investment. The Company indicates business model branding, developing frameworks that form the core of the consulting business, establishing industry-specific specialist teams in Japan, entering global markets, and investing in human resources, including M&A.
At the center of the strategy is becoming indispensable to customers, that is, becoming a strategic partner. The Company will establish specialist teams for each major industry, such as finance, manufacturing, and IT, and solve industry-specific cultures, business practices, and issues in system implementation through project teams for each customer. This is an initiative to shift from conventional siloed operations centered on engineering teams and sales teams to an organization that links project teams directly under the CEO, domestic service teams, sales teams, the Vietnam team, and the consulting team. Progress has been made in structural reform, organizational optimization, and the establishment of a consulting team.
In its overseas strategy, through the capital and business alliance with BiPlus Software, the Company plans to enhance its capability to respond to global development, including the Atlassian business. The Company states that it will capture overseas customer demand, secure excellent IT personnel in Vietnam, and drive sales growth by strengthening its business structure. This can be evaluated as a step aimed at supporting overseas expansion by large domestic enterprises and expanding development and delivery capabilities, but at present, quantitative disclosure of individual orders and profit contribution is limited.
The investment issue is that this plan involves sacrificing short-term profits. The FY2/2027 plan calls for net sales of 12.195 billion yen, operating profit of 200 million yen, and an operating margin of 1.6%, expecting higher sales but lower profits. The Company explains that operating profit will decline because it is temporarily restricting orders to promote intensive structural reform of Professional Services, and because the increase in long-term services will be recorded substantially as contract liabilities. Therefore, the success or failure of this plan cannot be measured only by the sales growth rate. The important KPIs are the Professional Services ratio, the increase in contract liabilities, the bottoming out of the gross profit margin, unit prices for consulting projects, and utilization rates after human resource investment. If successful, Reignite2030 will become material for raising share-price valuation while maintaining ROIC, but if the reversal in profitability is delayed, the share price is likely to remain centered on net cash valuation.
8. Earnings analysis (long-term trends to the most recent results)
The sales CAGR is high, but profitability is in a rebuilding phase. The Company has entered a phase in which the quality of growth is being questioned.
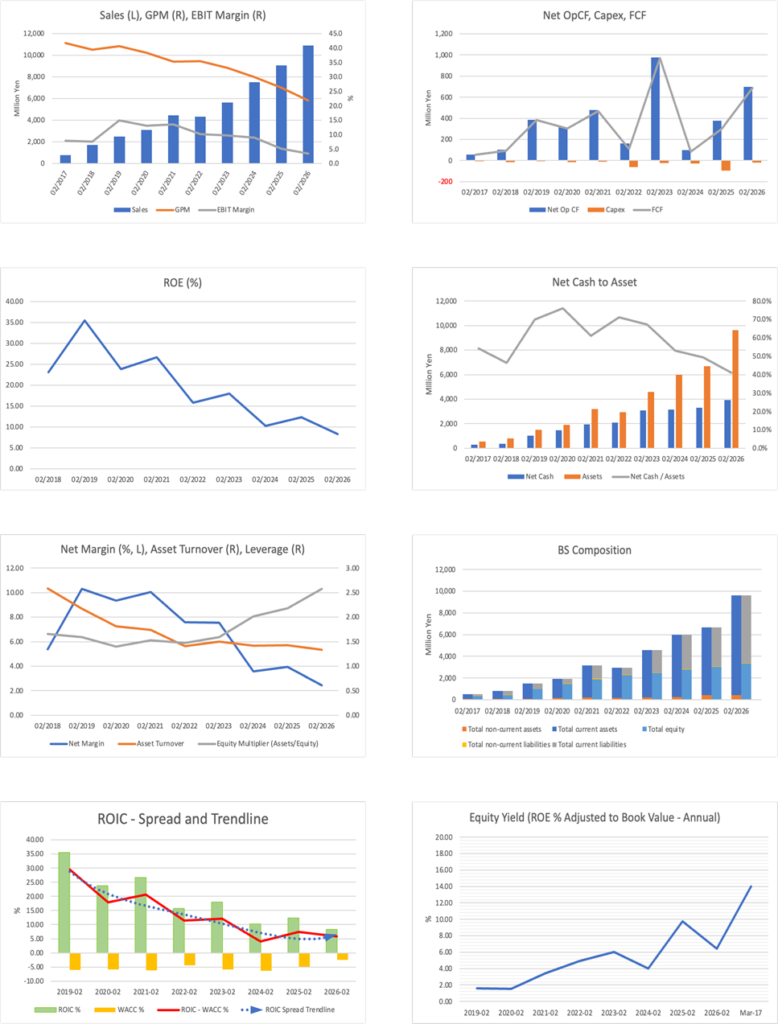
The Company’s long-term earnings combine the sustainability of sales growth and fluctuations in profitability. Consolidated net sales expanded from 4.431 billion yen in FY2/2021, 4.308 billion yen in FY2/2022, 5.623 billion yen in FY2/2023, 7.491 billion yen in FY2/2024, and 9.044 billion yen in FY2/2025, and grew to 10.893 billion yen in FY2/2026. The sales CAGR from FY2/2021 to FY2/2026 was approximately 19.7%, and the top-line growth potential is clearly evident against the backdrop of large-enterprise DX, agile development, and demand for cloud migration. On the other hand, ordinary profit was 601 million yen in FY2/2021, 450 million yen in FY2/2022, 567 million yen in FY2/2023, 677 million yen in FY2/2024, 462 million yen in FY2/2025, and 357 million yen in FY2/2026, and profits have not grown in proportion to sales expansion.
In FY2/2026, net sales were firm at 10.893 billion yen, +20.4% YoY, but operating profit was 377 million yen, -17.8% YoY, ordinary profit was 357 million yen, -22.7% YoY, and net income attributable to owners of the parent was 264 million yen, -25.8% YoY, resulting in higher sales and lower profits. Gross profit was the same as the previous fiscal year at 2.373 billion yen, but the gross profit margin declined by 4.5 percentage points from 26.3% to 21.8%. The Company explains that higher Professional Services sales offset the increase in license costs, and that gross profit remained unchanged from the previous fiscal year. The SG&A ratio declined from 21.2% to 18.3%, and fixed-cost management functioned to a certain extent. At the same time, SG&A expenses temporarily increased due to the recording of provisions for directors’ retirement benefits, and the operating margin declined from 5.1% to 3.5%.
By service, Technology Solutions sales grew to 8.863 billion yen, +19.7% YoY, and Professional Services sales grew to 1.403 billion yen, +53.5% YoY, while In-house Products were 625 million yen, -13.6% YoY. Regarding In-house Products, because part of the sales is said to have been transferred to contract liabilities as revenue from the next fiscal year onward through operational optimization in line with actual revenue conditions, it should not be evaluated solely based on a short-term revenue decline. Contract liabilities increased to 4.476 billion yen, up 90% YoY, and visibility into future sales improved.
Recent business topics include the business alliance with Growth xPartners, the establishment of Alter Design Consulting Co., Ltd., and the capital and business alliance with BiPlus Vietnam Software Solutions, showing that the Company is expanding its service delivery structure in Japan and overseas. For investment, the focus is not on sales growth itself, but on the bottoming out of gross profit margin, the profitability of Professional Services, and the conversion of contract liabilities into sales and profits. Current earnings show strong growth potential, but the earnings profile remains in the process of rebuilding.
9. Full-year earnings forecast and earnings monitoring issues
FY2/2027 is a plan for higher sales and lower profits. What should be watched is not sales growth, but the timing of a reversal in the gross profit margin.
The Company’s FY2/2027 company plan is net sales of 12.195 billion yen (+12.0% YoY), operating profit of 200 million yen (-46.7% YoY), ordinary profit of 200 million yen (-43.8% YoY), net income attributable to owners of the parent of 160 million yen (-39.3% YoY), and net income per share of 35.48 yen. The dividend forecast remains 0 yen. Sales will maintain double-digit growth, but the operating margin is expected to decline from 3.5% in FY2/2026 to 1.6%, reflecting a plan that prioritizes short-term growth investment and structural reform.
The Company explains that although consolidated sales will grow steadily, profits will decline due to a decline in license profit margins. In addition, it states that it is temporarily restricting orders to promote structural reform of Professional Services intensively, and that next fiscal year it plans to increase long-term services, which will be recorded substantially as contract liabilities for accounting purposes, thereby causing operating profit for this fiscal year to decline. This means a phase in which the timing of sales recognition and profit recognition diverges in the short term.
In earnings monitoring, first, we want to confirm the bottoming out of the gross profit margin. In FY2/2026, the gross profit margin was pressured by rising license costs, and the Company also recognizes the decline in the operating margin as an important issue. Quarterly gross profit margin, Technology Solutions’ profitability, and changes in the Atlassian cloud/on-premises composition are the most important indicators. Second, it is necessary to confirm when the order restriction in Professional Services will be lifted and how it will be reflected in unit prices, utilization rates, and project profitability. An increase in the sales composition ratio alone is insufficient, and the focus is on whether it becomes profitable in a way that raises the company-wide gross profit margin.
Third is the quality of contract liabilities. Contract liabilities at the end of FY2/2026 accumulated to 4.476 billion yen, an increase of 90% YoY, and visibility into future sales is high. On the other hand, even if contract liabilities increase, if the gross profit margin at the time they are converted into sales is low, they are unlikely to affect share price valuation. Fourth is control of SG&A expenses and human resource investment. Because Reignite2030 sets out strategic investments totaling approximately 6.0 billion yen by 2030, the investment burden is likely to come first. FY2/2027 is a year in which the Company tolerates higher sales and lower profits and rebuilds the structure. Investors should confirm not the progress rate of net sales, but the reversal in the gross profit margin, the conversion of contract liabilities into sales, and the profitability of Professional Services every quarter.
10. Balance sheet, cash flows, and capital allocation
Net cash is on par with market capitalization. Clarification of capital allocation is necessary for the market capitalization rerating.
The Company’s balance sheet shows a structure in which cash and deposits are increasing in thickness, while contract liabilities are rising sharply. Total assets at the end of FY2/2026 were 9.633 billion yen, up 2.954 billion yen from the previous fiscal year-end; net assets were 3.316 billion yen, and the equity ratio was 34.4%. The equity ratio declined from 45.4% at the end of the previous fiscal year, largely due to the expansion of total assets and liabilities, driven by increases in contract liabilities and prepaid expenses. Cash and deposits increased to 3.939 billion yen, consistent with net cash of approximately 3.94 billion yen. Compared with the market capitalization of 3.9 billion yen, this is an important asset supporting downside resilience for the share price.
The most important item on the liability side is contract liabilities. Contract liabilities at the end of FY2/2026 were 4.476 billion yen, an increase of 2.124 billion yen from 2.352 billion yen at the end of the previous fiscal year. The Company positions contract liabilities as “savings” for future sales. While they indicate improved sales visibility, they are advances received, so the degree of gross profit that accompanies future sales recognition is the focus of investment evaluation. Prepaid expenses also increased to 3.562 billion yen, and the prepayment and advance receipt structure associated with license transactions, such as those with Atlassian, should be viewed as expanding the balance sheet.
Cash flows are favorable. In FY2/2026, operating cash flow was 697 million yen, investing cash flow was -35 million yen, financing cash flow was zero, and free cash flow, calculated by simple subtraction, was a surplus of approximately 662 million yen. The main factors behind operating cash flow were pretax income of 357 million yen, together with an increase in contract liabilities of 2.119 billion yen and an increase in trade payables of 443 million yen, while an increase in prepaid expenses of 1.858 billion yen and an increase in trade receivables of 358 million yen were subtracting factors.
There remains considerable room for improvement in capital allocation. The dividend was 0 yen in FY2/2026, the FY2/2027 forecast is also 0 yen, and the financing cash flow for the fiscal year was also zero. Share repurchases of 91 million yen were conducted in the previous fiscal year, but this is small relative to the current scale of net cash. Financial safety is sufficient, but unless the priorities and amount frameworks for growth investment, M&A, dividends, and share buybacks are shown, the surplus capital discount will remain. At this stage, despite a strong balance sheet, capital policy has not been adequately reflected in share price, and how the Company will balance Reignite2030 strategic investments and shareholder returns is the most important issue going forward.
11. Capital efficiency and economic value creation (ROE / ROIC-WACC)
ROIC exceeds WACC, but the margin has narrowed due to declining profitability. Maintaining capital efficiency is the condition for realizing share-price upside.
The Company’s capital efficiency indicators indicate it is creating economic value at present, but the margin has narrowed due to declining profitability. Quantitative data show ROE of 8.31%, ROIC of 8.31%, and WACC of 2.47%, with a ROIC-WACC spread of +5.84 pt. This indicates that the Company is generating returns above its invested capital cost. From an institutional investor’s perspective, the Company can be evaluated not as a growth company, but as a small-cap DX support company that maintains a certain level of capital efficiency while holding a large amount of net cash.
On the other hand, attention is needed regarding the direction of capital efficiency. Consolidated results in FY2/2026 expanded to net sales of 10.893 billion yen, +20.4% YoY, but operating profit was 377 million yen, -17.8% YoY, and net income attributable to owners of the parent was 264 million yen, -25.8% YoY. Return on equity was 8.3%, down from 12.3% in the previous fiscal year. Even if sales growth continues, if the decline in the gross profit margin due to rising license costs pressures profits, ROE and ROIC are likely to decline.
In the decomposition of ROIC, the issue lies in the operating margin rather than invested capital turnover. The operating margin in FY2/2026 was 3.5%, down from 5.1% in the previous fiscal year. Total assets expanded to 9.633 billion yen, and contract liabilities increased to 4.476 billion yen, indicating high visibility into future sales. However, if operating profit does not grow relative to the expansion of assets and liabilities, capital efficiency will slow. Contract liabilities can be evaluated positively as a leading indicator of sales. However, if the gross profit margin at the time of sales conversion is low, it will not sufficiently lead to economic value creation.
From an economic value perspective, because the ROIC of 8.31% exceeds the WACC of 2.47%, it is positive at present. However, the FY2/2027 company plan is for an operating profit of 200 million yen, a -46.7% YoY decline, and the short-term pressure on ROIC is strong. What is important here is whether the investments under Reignite2030 do not end as a mere increase in expenses, but lead to higher unit prices for Professional Services, improved utilization rates, and a reversal in the gross profit margin. If the Company can execute growth investments while maintaining capital efficiency, there is room for the valuation to rise to 1.17x PBR. Conversely, if the decline in profitability persists, although the thickness of net cash will support downside, share-price rerating will be postponed as the ROIC spread narrows. In the current investment conclusion, it is reasonable to position the Company as maintaining economic value creation, but it should prove its sustainability through a reversal in profitability.
12. Share-price trend and current valuation position
Net cash valuation supports the downside, but the decline in profitability limits the rise in PER.
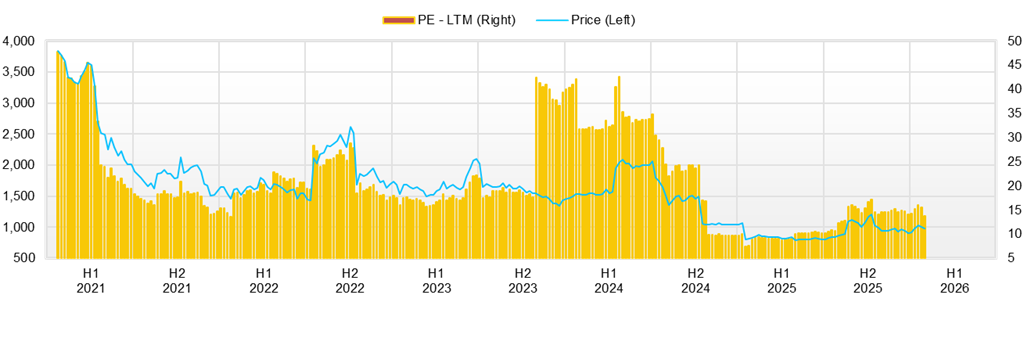
The Company’s share price has lacked a clear direction over the past year, but it has recently tested the downside following the results. Against the closing price of 827 yen on April 24, 2025, the closing price on April 24, 2026, was 856 yen, representing only a small increase over one year. On the other hand, after reaching a year-to-date high of 1,049 yen on January 16, 2026, the share price declined to 856 yen on April 24, setting a new year-to-date low. The recent share price has declined by approximately 18% from its high, and it is natural to view concerns over declining profitability as already reflected in the share price following the FY2/2026 results and the FY2/2027 plan for higher sales and lower profits.
Valuation is market capitalization of 3.9 billion yen, forecast PER of 24.6x, actual PBR of 1.17x, ROA of 3.23%, ROE of 8.31%, ROIC of 8.31%, beta of 0.93, net cash of approximately 3.94 billion yen, and WACC of 2.47%. The core of the valuation is that market capitalization and net cash are nearly equal. This can be read as indicating that the equity market hardly evaluates business value. At the same time, it can also be said that, as short-term profits decline, the market is not yet able to discount the returns from growth investments. PBR of 1.17x shows little overheating from an asset-value perspective, but the forecast PER of 24.6x is by no means cheap given the decline in operating profit in FY2/2027. The current share price has two aspects: undervalued on financial safety grounds and neutral to somewhat overvalued on earnings grounds.
The largest short-term risk is that, while the Company plans net sales of 12.195 billion yen (+12.0% YoY) in FY2/2027, operating profit will decline to 200 million yen (-46.7% YoY). The Company cites the decline in license profit margins, temporary order restrictions associated with the structural reform of Professional Services, and the recording of contract liabilities accompanying an increase in long-term services as reasons for the decline. However, the equity market tends to dislike the immediate decline in the operating margin before accounting deferrals. For this reason, if the interpretation of the results explanation weakens, even a small amount of selling can easily cause the share price to move downward. The continuation of no dividend, the absence of a share buyback framework, and the unconfirmed bottoming out of the gross profit margin are also short-term weights. In particular, if concrete measures for capital allocation are not visible despite the large amount of net cash, investors will find it difficult to evaluate cash and deposits, and the discount near 1x PBR may continue for a long time.
From an investment perspective, the current share price has limited downside, but a share-price rerating requires a reversal in operating margins, an improvement in gross profit margin, profit conversion of contract liabilities, and clarification of capital policy. In the short term, this is not a phase to chase upside, but a stage to wait for confirmation of profitability at each results announcement.
13. Consideration of fair value
Fair value exceeds the current share price, but confirmation of a reversal in profitability is necessary for valuation to rise.
The focus in assessing the Company’s fair value is on the extent to which the remaining business value can be evaluated, based on net cash that closely approximates market capitalization. Quantitative data show market capitalization of 3.9 billion yen versus net cash of approximately 3.94 billion yen, and the current share price discounts financial safety to a considerable extent, while remaining a fairly cautious evaluation of business value and the medium-term growth scenario. Because the FY2/2027 company plan forecasts higher sales and lower profits, with net sales of 12.195 billion yen, operating profit of 200 million yen, and net income per share of 35.48 yen, it is difficult to expect significant share-price upside in PER valuation based on short-term profits. Assuming 4,550,300 shares outstanding, the share price back-calculated from a market capitalization of 3.9 billion yen is approximately 857 yen, which is the current price.
In DCF, if WACC of 2.47% is used as is, the theoretical value tends to be excessive. Taking into account the liquidity of small-cap stocks, the decline in the gross profit margin, and the FY2/2027 profit decline plan, in a risk-adjusted DCF that partially incorporates the normalized FCF of 150-250 million yen and profit recovery toward 2030, equity value is viewed as a reasonable range of around 1,000-1,600 yen. This is not a bullish DCF that fully incorporates the Reignite2030 target of EBITDA of 3.0 billion yen, but a conservative view that partially reflects the conversion of contract liabilities into sales and improvement in service profitability.
Under the PBR method, based on net assets per share of 736.96 yen at the end of FY2/2026, a 1.0-1.4x multiple is applied, taking into account an ROE of 8.31%, the thickness of net cash, the continuation of no dividends, and the decline in profitability. The fair value range is approximately 737-1,032 yen. Under the PER method, a 20-28x multiple is applied to forecast EPS of 35.48 yen for FY2/2027 for a small-cap DX support company undergoing structural reform, yielding a value of approximately 710-993 yen. Under the ROIC method, while evaluating that ROIC of 8.31% exceeds WACC of 2.47% by 5.84 pt, the decline in operating margin is discounted, and a reasonable range is 900-1,150 yen.
The central values of the four methods are DCF of 1,300 yen, PBR of 885 yen, PER of 852 yen, and ROIC of 1,025 yen, with a median of approximately 955 yen. Compared with the current share price of approximately 857 yen, the upside is limited to approximately 11%. In conclusion, the Company’s shares appear undervalued based on net cash value. However, on a short-term profit basis, they cannot be said to be strongly undervalued. Raising the fair value requires the bottoming out of the gross profit margin, a reversal in the operating margin, and the numerical presentation of capital allocation. The reasonable range at present is organized as 850-1,050 yen, and the upper range when profit improvement is confirmed is more than 1,200 yen.
14. Final investment conclusion based on earnings, capital efficiency, and fair value
Financial safety is strong, but this is a phase to wait for a full-fledged valuation rise until profitability reverses.
The final investment conclusion is to maintain holdings, for non-holders to make a small exploratory investment, and to limit additional investment until a reversal in the gross profit margin and operating margin is confirmed. In FY2/2026, the Company maintained high growth, with net sales of 10.893 billion yen (+20.4% YoY), but operating profit was 377 million yen (-17.8% YoY), and the operating margin declined to 3.5%. The gross profit margin also declined by 4.5 pt from the previous fiscal year to 21.8%, and the quality of profits has not kept pace with the quantity of growth. Furthermore, the FY2/2027 company plan is net sales of 12.195 billion yen, operating profit of 200 million yen, and an operating margin of 1.6%. In the short term, the phase of higher sales and lower profits is expected to continue.
On the other hand, downside resilience as an investment target is strong. Against a market capitalization of 3.9 billion yen, net cash is approximately 3.94 billion yen, and the actual PBR of 1.17x also shows little sign of overheating from an asset-value perspective. ROE and ROIC of 8.31% exceed the WACC of 2.47%, and at present, the Company is creating economic value. Contract liabilities have also accumulated to 4.476 billion yen, and visibility into future sales has increased. Therefore, this is not a phase to change the investment conclusion due to deterioration in profitability, but the forecast PER of 24.6x cannot necessarily be considered undervalued under the profit decline plan.
In considering fair value, the median value, integrating the DCF, PBR, PER, and ROIC methods, was set at approximately 955 yen. If the current share price is around 857 yen, there is some upside, but the upside is limited, and most of the investment appeal depends on “the thickness of net cash” and “the probability of success of Reignite2030.” The current market valuation assesses financial safety to some extent but remains cautious in discounting business value and the medium-term growth scenario.
In conclusion, the Company is high-quality, but it is not a stock investors should chase upside in immediately. The conditions for share-price rerating are: (1) the bottoming out of the gross profit margin, (2) the profitability of Professional Services, (3) the conversion of contract liabilities into high-profitability sales, and (4) the numerical presentation of the capital allocation policy for dividends, share buybacks, and growth investment. If these are confirmed, there is room for valuation to rise from the low 1x PBR level. At this stage, it is reasonable to continue holding for financial safety and to make additional investments gradually after confirmation.
15. Reasons growth is likely to stagnate, and reasons it nevertheless appears to be a good company
The essence of stagnation is not a lack of demand but a delay in profitability. It is a good company, but it needs time to become a good stock.
The reason the Company’s growth is likely to stagnate is not that demand is weak, but that it has entered a phase in which it is difficult to convert sales growth into profit growth. In FY2/2026, the Company maintained high growth, with net sales of 10.893 billion yen, up 20.4% YoY, but operating profit was limited to 377 million yen, down 17.8% YoY. The gross profit margin declined 4.5 pt from the previous fiscal year to 21.8%, and rising license costs are pressuring profitability. Technology Solutions sales are large at 8.863 billion yen, with an 81.4% share, and the Company’s growth continues to depend on the license sales base centered on Atlassian. Scale expansion is possible, but it is susceptible to procurement costs and price competition, and higher sales are unlikely to directly translate into an improvement in operating margins.
Another reason is that business transformation takes time. In Reignite2030, the Company sets out a transformation from license sales-centered operations to the provision of added value tailored to customers, industry-specific specialist teams, and a strategic partner-type model. However, this transformation requires human resource investment, the establishment of a consulting structure, increases in project unit prices, and improvement in utilization rates, and costs are likely to come first in the short term. In fact, the FY2/2027 company plan calls for higher sales and lower profits, with net sales of 12.195 billion yen and operating profit of 200 million yen. It will take time for the equity market to confirm profit growth.
The reason it nevertheless appears to be a good company is that its customer base, finances, and visibility into future sales remain intact. Contract liabilities have accumulated to 4.476 billion yen, and the foundation for future sales is thick. Professional Services sales also grew to 1.403 billion yen, up 53.5% YoY, and the shift to a value-added model is beginning to appear in the numbers. In addition, the Company holds net cash of approximately 3.94 billion yen against a market capitalization of 3.9 billion yen, and ROIC of 8.31% exceeds WACC of 2.47%. High financial safety and the maintenance of economic value creation are important supports for a small-cap growth stock.
As an investment implication, the Company should be viewed as one in which the investment conclusion should be made while assessing whether structural reform leads to profitability improvement. The reasons growth is likely to stagnate are clear: license dependence, a decline in gross profit margin, and the front-loading of human resource investment. The reasons it appears to be a good company are also clear: large enterprise customers, contract liabilities, net cash, and the ROIC spread. At this stage, it is necessary to consider separately the reasons it appears to be a good company and the possibility of an immediate strong share-price rise. If a reversal in the gross profit margin and clarification of capital allocation are confirmed, the evaluation may progress from a good company to a good investment candidate.
Key stock price data
Key financial data
| Unit: million yen | 2022/2 | 2023/2 | 2024/2 | 2025/2 | 2026/2 | 2027/2 CE |
| Sales | 4,308 | 5,623 | 7,491 | 9,044 | 10,893 | 12,195 |
| EBIT (Operating Income) | 437 | 547 | 666 | 459 | 377 | 200 |
| Pretax Income | 450 | 567 | 350 | 462 | 357 | 200 |
| Net Profit Attributable to Owner of Parent | 327 | 424 | 269 | 356 | 264 | 160 |
| Cash & Short-Term Investments | 2,089 | 3,071 | 3,158 | 3,297 | 3,939 | |
| Total assets | 2,939 | 4,577 | 5,971 | 6,687 | 9,633 | |
| Total Debt | 0 | 0 | 0 | 0 | 0 | |
| Net Debt | -2,089 | -3,071 | -3,158 | -3,297 | -3,939 | |
| Total liabilities | 684 | 2,103 | 3,203 | 3,658 | 6,316 | |
| Total Shareholders’ Equity | 2,255 | 2,474 | 2,768 | 3,029 | 3,316 | |
| Net Operating Cash Flow | 161 | 978 | 100 | 377 | 697 | |
| Capital Expenditure | 61 | 25 | 30 | 95 | 18 | |
| Net Investing Cash Flow | -47 | -27 | -37 | -140 | -35 | |
| Net Financing Cash Flow | 23 | 18 | 7 | -91 | 0 | |
| Free Cash Flow | 110 | 968 | 86 | 298 | 687 | |
| ROA (%) | 10.69 | 11.28 | 5.10 | 5.62 | 3.23 | |
| ROE (%) | 15.73 | 17.92 | 10.26 | 12.27 | 8.31 | |
| EPS (Yen) | 74.5 | 94.4 | 59.2 | 78.6 | 58.7 | 35.6 |
| BPS (Yen) | 507.2 | 547.4 | 608.3 | 676.1 | 737.0 | |
| Dividend per Share (Yen) | 0.00 | 0.00 | 0.00 | 0.00 | 0.00 | 0.00 |
| Shares Outstanding (Million shares) | 4.37 | 4.51 | 4.55 | 4.55 | 4.55 |
Source: Omega Investment from company data, rounded to the nearest whole number.
Share price
Financial data (quarterly basis)
| Unit: million yen | 2024/2 | 2025/2 | 2026/2 | ||||||
| 4Q | 1Q | 2Q | 3Q | 4Q | 1Q | 2Q | 3Q | 4Q | |
| (Income Statement) | |||||||||
| Sales | 2,193 | 2,047 | 2,263 | 2,289 | 2,445 | 2,872 | 2,254 | 2,944 | 2,822 |
| Year-on-year | 30.8% | 30.2% | 18.7% | 25.8% | 11.5% | 40.3% | -0.4% | 28.6% | 15.4% |
| Cost of Goods Sold (COGS) | 1,553 | 1,429 | 1,703 | 1,711 | 1,826 | 2,247 | 1,722 | 2,319 | 2,231 |
| Gross Income | 641 | 617 | 560 | 577 | 619 | 625 | 532 | 625 | 590 |
| Gross Income Margin | 29.2% | 30.2% | 24.7% | 25.2% | 25.3% | 21.8% | 23.6% | 21.2% | 20.9% |
| SG&A Expense | 413 | 470 | 485 | 493 | 468 | 495 | 495 | 496 | 510 |
| EBIT (Operating Income) | 228 | 148 | 76 | 84 | 151 | 130 | 37 | 129 | 80 |
| Year-on-year | 42.0% | 0.7% | -48.0% | -42.3% | -33.5% | -11.9% | -50.7% | 53.6% | -47.0% |
| Operating Income Margin | 10.4% | 7.2% | 3.3% | 3.7% | 6.2% | 4.5% | 1.7% | 4.4% | 2.8% |
| EBITDA | 235 | 155 | 83 | 97 | 167 | 145 | 51 | 144 | 95 |
| Pretax Income | 236 | 155 | 77 | 85 | 145 | 97 | 41 | 135 | 84 |
| Consolidated Net Income | 177 | 115 | 62 | 68 | 111 | 74 | 36 | 102 | 52 |
| Minority Interest | 0 | 0 | 0 | 0 | 0 | 0 | 0 | 0 | 0 |
| Net Income ATOP | 177 | 115 | 62 | 68 | 111 | 74 | 36 | 102 | 52 |
| Year-on-year | 40.8% | 11.9% | -143.6% | -48.5% | -37.3% | -35.5% | -42.5% | 51.1% | -53.2% |
| Net Income Margin | 8.1% | 5.6% | 2.7% | 3.0% | 4.5% | 2.6% | 1.6% | 3.5% | 1.8% |
| (Balance Sheet) | |||||||||
| Cash & Short-Term Investments | 3,158 | 3,375 | 3,442 | 3,192 | 3,297 | 3,142 | 3,930 | 3,782 | 3,939 |
| Total assets | 5,971 | 6,291 | 6,588 | 6,004 | 6,687 | 7,365 | 7,533 | 8,426 | 9,633 |
| Total Debt | 0 | 0 | 0 | 0 | 0 | 0 | 0 | 0 | 0 |
| Net Debt | -3,158 | -3,375 | -3,442 | -3,192 | -3,297 | -3,142 | -3,930 | -3,782 | -3,939 |
| Total liabilities | 3,203 | 3,398 | 3,661 | 3,083 | 3,658 | 4,275 | 4,397 | 5,158 | 6,316 |
| Total Shareholders’ Equity | 2,768 | 2,893 | 2,927 | 2,921 | 3,029 | 3,090 | 3,137 | 3,268 | 3,316 |
| (Profitability %) | |||||||||
| ROA | 5.10 | 4.99 | 8.53 | 7.12 | 5.62 | 4.61 | 4.08 | 4.48 | 3.23 |
| ROE | 10.26 | 10.26 | 18.03 | 15.31 | 12.27 | 10.52 | 9.51 | 10.43 | 8.31 |
| (Per-share) Unit: JPY | |||||||||
| EPS | 38.9 | 25.3 | 13.6 | 15.1 | 24.8 | 16.6 | 7.9 | 22.7 | 11.5 |
| BPS | 608.3 | 635.7 | 643.9 | 652.0 | 676.1 | 689.7 | 697.1 | 726.3 | 737.0 |
| Dividend per Share | 0.00 | 0.00 | 0.00 | 0.00 | 0.00 | 0.00 | 0.00 | 0.00 | 0.00 |
| Shares Outstanding (million shares) | 4.55 | 4.55 | 4.55 | 4.55 | 4.55 | 4.55 | 4.55 | 4.55 | 4.55 |
Source: Omega Investment from company materials
Financial data (full-year basis)
| Unit: million yen | 2020 | 2021 | 2022 | 2023 | 2024 | 2025 | 2026 |
| (Income Statement) | |||||||
| Sales | 3,089 | 4,431 | 4,308 | 5,623 | 7,491 | 9,044 | 10,893 |
| Year-on-year | 24.4% | 43.5% | -2.8% | 30.5% | 33.2% | 20.7% | 20.4% |
| Cost of Goods Sold | 1,904 | 2,868 | 2,779 | 3,759 | 5,249 | 6,670 | 8,519 |
| Gross Income | 1,184 | 1,563 | 1,529 | 1,864 | 2,242 | 2,374 | 2,373 |
| Gross Income Margin | 38.3% | 35.3% | 35.5% | 33.1% | 29.9% | 26.2% | 21.8% |
| SG&A Expense | 782 | 961 | 1,091 | 1,317 | 1,576 | 1,915 | 1,997 |
| EBIT (Operating Income) | 402 | 602 | 437 | 547 | 666 | 459 | 377 |
| Year-on-year | 8.3% | 49.6% | -27.3% | 25.0% | 21.7% | -31.1% | -17.8% |
| Operating Income Margin | 13.0% | 13.6% | 10.2% | 9.7% | 8.9% | 5.1% | 3.5% |
| EBITDA | 416 | 617 | 467 | 566 | 691 | 502 | 435 |
| Pretax Income | 403 | 601 | 450 | 567 | 350 | 462 | 357 |
| Consolidated Net Income | 289 | 446 | 327 | 424 | 269 | 356 | 264 |
| Minority Interest | 0 | 0 | 0 | 0 | 0 | 0 | 0 |
| Net Income ATOP | 289 | 446 | 327 | 424 | 269 | 356 | 264 |
| Year-on-year | 13.0% | 54.3% | -26.7% | 29.7% | -36.5% | 32.2% | -25.8% |
| Net Income Margin | 9.4% | 10.1% | 7.6% | 7.5% | 3.6% | 3.9% | 2.4% |
| (Balance Sheet) | |||||||
| Cash & Short-Term Investments | 1,458 | 1,944 | 2,089 | 3,071 | 3,158 | 3,297 | 3,939 |
| Total assets | 1,922 | 3,180 | 2,939 | 4,577 | 5,971 | 6,687 | 9,633 |
| Total Debt | 0 | 0 | 0 | 0 | 0 | 0 | 0 |
| Net Debt | -1,458 | -1,944 | -2,089 | -3,071 | -3,158 | -3,297 | -3,939 |
| Total liabilities | 484 | 1,279 | 684 | 2,103 | 3,203 | 3,658 | 6,316 |
| Total Shareholders’ Equity | 1,437 | 1,901 | 2,255 | 2,474 | 2,768 | 3,029 | 3,316 |
| (Cash Flow) | |||||||
| Net Operating Cash Flow | 316 | 478 | 161 | 978 | 100 | 377 | 697 |
| Capital Expenditure | 13 | 9 | 61 | 25 | 30 | 95 | 18 |
| Net Investing Cash Flow | -43 | -8 | -47 | -27 | -37 | -140 | -35 |
| Net Financing Cash Flow | 152 | 19 | 23 | 18 | 7 | -91 | 0 |
| Free Cash Flow | 303 | 469 | 110 | 968 | 86 | 298 | 687 |
| (Profitability ) | |||||||
| ROA (%) | 16.97 | 17.47 | 10.69 | 11.28 | 5.10 | 5.62 | 3.23 |
| ROE (%) | 23.80 | 26.70 | 15.73 | 17.92 | 10.26 | 12.27 | 8.31 |
| Net Margin (%) | 9.35 | 10.06 | 7.59 | 7.54 | 3.59 | 3.93 | 2.42 |
| Asset Turn | 1.81 | 1.74 | 1.41 | 1.50 | 1.42 | 1.43 | 1.33 |
| Assets/Equity | 1.40 | 1.53 | 1.47 | 1.59 | 2.01 | 2.18 | 2.57 |
| (Per-share) Unit: JPY | |||||||
| EPS | 68.5 | 103.6 | 74.5 | 94.4 | 59.2 | 78.6 | 58.7 |
| BPS | 336.0 | 436.6 | 507.2 | 547.4 | 608.3 | 676.1 | 737.0 |
| Dividend per Share | 0.00 | 0.00 | 0.00 | 0.00 | 0.00 | 0.00 | 0.00 |
| Shares Outstanding (million shares) | 4.20 | 4.29 | 4.37 | 4.51 | 4.55 | 4.55 | 4.55 |
Source: Omega Investment from company materials