2026-07-09
Home
Japanese

Omega Investment Co., Ltd.
TOKYO ELECTRON DEVICE (Price Discovery)
| Share price (5/11) | ¥3,950 | Dividend Yield (27/3 CE) | 2.7 % |
| 52weeks high/low | ¥2,467/4,015 | ROE(26/3 act) | 15.6 % |
| Avg Vol (3 month) | 160.3 thou shrs | Operating margin (26/3 act) | 5.0 % |
| Market Cap | ¥123.78 bn | Beta (5Y Monthly) | 0.69 |
| Enterprise Value | ¥130.77 bn | Shares Outstanding | 31.336 mn shrs |
| PER (27/3 CE) | 14.8 X | Listed market | TSE Prime section |
| PBR (26/3 act) | 2.2 X |
| Click here for the PDF version of this page |
| PDF version |
Signs of order recovery at a semiconductor trading company. Maintain a cautious stance until margin improvement is confirmed.
◇ Investment conclusion: Order recovery is a positive factor, but a full-scale increase in the portfolio weighting should be judged cautiously while confirming margin improvement
TOKYO ELECTRON DEVICE LIMITED (hereinafter, the “Company”)’s investment conclusion is “neutral to slightly positive, with continued phased holdings.” Existing holdings may be maintained at this stage, but at present, there remains insufficient confirmation to increase the portfolio weighting in earnest. In the FY3/2026 results, order recovery was clearly confirmed. On the other hand, margins in the mainstay Semiconductor and Electronic Components business (hereinafter, the EC Business) declined significantly, and it is not yet clear whether the increase in orders will be translated into sales accompanied by an improvement in the gross profit margin. Therefore, in the investment conclusion, more than the recovery of semiconductor market conditions itself, emphasis should be placed on whether the EC Business profit margin bottoms out, whether the private brand business (hereinafter, the PB Business) recovers, and whether the decline in ROE comes to a halt.
In the previous report, the Company was positioned as an “excellent cyclical growth company,” and the conditions for additional purchases were indications that the market inventory adjustment was ending, improvement in orders and leading indicators of sales, and bottoming of the gross profit margin and operating profit margin. What was confirmed this time was mainly an improvement in orders among these conditions. Orders received in FY3/2026 were 233.435 billion yen, up 32.8% YoY, and in particular, the EC Business clearly recovered to 181.945 billion yen, up 40.7% YoY. The order backlog also increased to 146.157 billion yen, up 25.5% YoY, and it can be assessed that leading indicators of sales have turned upward.
However, FY3/2026 earnings still showed lower sales and profits. Sales were 203.748 billion yen, ordinary income was 9.750 billion yen, and net income attributable to owners of parent was 7.842 billion yen. In particular, the EC Business segment’s profit margin declined to 2.0%, and the profitability of the mainstay business is not yet at a level where a bottom can be confirmed. Order recovery is an important step forward, but margin recovery cannot be taken for granted on that basis alone. If the increase in orders is biased toward long-lead-time projects, low-margin projects, and the expansion of commercial rights for automotive applications, sales may recover, but the improvement in the gross profit margin may be limited.
What is important here is not to evaluate the Company simply as a “Tokyo Electron-affiliated semiconductor-related stock.” Even as AI semiconductor-related stocks are attracting market attention and Tokyo Electron’s stock price is firming, the recovery in the Company’s shares has been sluggish. The reason is that Tokyo Electron itself is evaluated as a highly profitable semiconductor production equipment manufacturer directly linked to AI semiconductors, advanced logic, HBM, and front-end process investment. In contrast, the Company is a technology trading company for semiconductors and electronic devices, with a different earnings structure. The Company’s performance is affected by demand and commercial rights for industrial equipment and automotive applications, customer inventory cycles, the product and service mix, and project composition in the PB Business, and IT infrastructure investment. The strong performance of Tokyo Electron itself cannot be directly applied to the Company’s stock price valuation.
For this reason, it is somewhat optimistic to view that “because sensitivity to semiconductor market conditions is high, margins will naturally recover along with a recovery in market conditions.” A recovery in semiconductor market conditions is a tailwind for the Company, but profitability as a technology trading company is affected by procurement conditions, sales mix, profitability by customer project, the operating rate of the PB Business, and pricing conditions after the inventory cycle. What the market is demanding from the Company is not the recovery of orders, but evidence that order recovery will be converted into margin improvement.
On the other hand, there are also supporting factors. The Computer Systems business (hereinafter, the CN Business) achieved higher sales and profits against a backdrop of IT investment and strong performance in storage, security, and maintenance and monitoring services, and the segment profit margin rose to 15.9%. The fact that the CN Business supported overall profits even while the EC Business was weak due to market adjustment can be evaluated positively. In addition, the Company forecasts sales of 225.0 billion yen and ordinary income of 11.3 billion yen for FY3/2027, expecting higher sales and higher ordinary income. Annual dividends are also stable at 107 yen for FY3/2026 and a forecast of 108 yen for FY3/2027, providing support from the perspective of dividend yield as well.
In summary, the Company’s shares are not at a stage to turn bearish, but they are also not at a stage to buy aggressively. Order recovery can be evaluated as the first stage, but confirmation of margin improvement has been carried over to FY3/2027 and beyond. Going forward, if the segment profit margin of the EC Business bottoms out, the expansion of the PB Business progresses, and the decline in ROE comes to a halt, there will be room to increase the portfolio weighting. Conversely, if order recovery remains only an increase in sales and is not accompanied by an improvement in gross profit margin, the gap in stock price valuation relative to Tokyo Electron will be difficult to close. At present, it is appropriate to maintain phased holdings as the basic stance and to cautiously assess any increase in portfolio weighting while confirming margin improvement.
◇ FY3/2026 financial highlights: Although sales and profits declined, orders clearly turned around; the phase is one of confirming higher profitability in the CN Business and bottoming in the EC Business
The FY3/2026 results showed lower sales and profits, but the order figures suggested a recovery in the next fiscal year, and the results were not entirely negative. Sales were 203.748 billion yen, down 5.8% YoY, operating income was 10.253 billion yen, down 17.7% YoY, ordinary income was 9.750 billion yen, down 14.6% YoY, and net income attributable to owners of parent was 7.842 billion yen, down 11.6% YoY. Against the most recent company plan, the achievement rates were 101.9% for sales, 107.2% for ordinary income, and 108.9% for net income, and the results landed above the Company’s assumptions, which can be evaluated positively.
The main reason for the decline in profits was the decline in the EC Business profit margin. In the EC Business, semiconductor products for automotive applications were firm due to the expansion of customer commercial rights, but semiconductor products for industrial equipment declined because customer inventory adjustments continued, and the PB Business also remained weak due to the prolonged adjustment in the wafer market. As a result, EC Business sales were 162.543 billion yen, down 9.2% YoY, segment profit was 3.208 billion yen, down 47.8% YoY, and the profit margin declined to 2.0%. The fact that profit fell more than sales should be viewed as reflecting a decline in fixed-cost absorption capacity and a deterioration in the sales mix.
On the other hand, the CN Business served as a profit buffer for the entire Company. Against the backdrop of robust corporate IT investment driven by the advance of AI and cloud adoption, storage-related products, security-related products, and maintenance and monitoring services performed strongly. CN Business sales were 41.204 billion yen, up 10.4% YoY, segment profit was 6.542 billion yen, up 24.2% YoY, and the profit margin rose to 15.9%. The fact that the CN Business supported earnings even while the EC Business was depressed by market adjustment demonstrates the strength of the Company’s business portfolio.
The positive factor is the recovery in orders. Orders received in FY3/2026 were 233.435 billion yen, up 32.8% YoY, with the EC Business at 181.945 billion yen, up 40.7% YoY, and the CN Business at 51.489 billion yen, up 10.9% YoY. The order backlog also accumulated to 146.157 billion yen, up 25.5% YoY. In particular, the Company explains that customer inventories in the supply chain are steadily being consumed and that orders for semiconductor products are on a recovery trend. The path to overcoming the profit decline lies in converting the order backlog into sales and recovering margins in the EC Business.
If viewed only in terms of earnings, the results were unsatisfactory. However, if attention is paid to orders and the fact that results exceeded the Company plan, they were results at an early stage of recovery. However, order recovery is not a sufficient condition for margin improvement. For market valuation to rise by another step, it will be necessary from FY3/2027 onward for the increase in orders in the EC Business to be converted into sales, accompanied by an improvement in the gross profit margin.
◇ Segment analysis: The CN Business serves as a profit buffer, while the focus for the EC Business is whether order recovery can be converted into profits
The Company’s segment structure in FY3/2026 is one in which the CN Business supports overall profits, while the EC Business has the potential to drive recovery from FY3/2027 onward. The Company’s reportable segments are the EC Business and the CN Business, with the PB Business included in the EC Business for reportable segment purposes. In the sales composition for FY3/2026, the EC Business accounted for 162.543 billion yen, or 79.8%, and the CN Business accounted for 41.204 billion yen, or 20.2%. Segment profit was 3.208 billion yen in the EC Business, and 6.542 billion yen in the CN Business, with the CN Business accounting for 67.1% of total profit. The EC Business is large in terms of sales scale, but the CN Business stands out in terms of earnings stability.
The CN Business handles networks, storage, security-related products, and maintenance and monitoring services, and its main customers are system integrators, enterprises, data centers & cloud business operators, and telecommunications carriers. In FY3/2026, network-related products declined for data centers & cloud business operators, while storage-related products increased mainly for telecommunications carriers, and security-related products, as well as other products and maintenance and monitoring services, performed strongly. Sales increased 10.4% YoY, segment profit increased 24.2% YoY, and the profit margin was 15.9%. The earnings model that captures replacement demand and operational services mitigates volatility in overall profits.
The EC Business handles analog ICs, processors, logic ICs, memory ICs, boards and electronic components, software and services, and PB products. Customer applications include industrial, automotive, telecommunications, and consumer equipment, and sources of earnings include expanding commercial rights and technical support. In FY3/2026, sales of semiconductor products for automotive applications were firm, partly due to the expansion of customer commercial rights. However, semiconductor products for industrial equipment declined due to customer inventory adjustments, and PB products were also weak amid prolonged adjustments in the wafer market. As a result, sales decreased 9.2% YoY, segment profit decreased 47.8% YoY, and the profit margin declined to 2.0%. However, orders received in the EC Business recovered to 181.945 billion yen, up 40.7% YoY, and the key issue going forward is whether the increase in orders can be converted into higher sales and margin improvement.
The PB Business is an area that demonstrates the Company’s manufacturing capabilities, including design and manufacturing services, as well as wafer inspection system. Sales in the PB Business in FY3/2026 were 11.783 billion yen, down 19.5% YoY, and the ratio to EC Business sales was 7.2%. At present, weakness for industrial equipment applications and the prolonged adjustment in the wafer market are weighing on this business. However, if demand returns, the PB Business is likely to contribute to margin improvement across the EC Business as a whole and could serve as an important confirmation point in the Company’s re-rating.
◇ FY3/2027 earnings forecast: Expected to see higher sales and ordinary income through a recovery in the EC Business; the focus is on how far margins recover
FY3/2027 will be a year in which order recovery is converted into sales, and a reversal is confirmed at the ordinary income level. The Company forecasts sales of 225.00 billion yen, up 10.4% YoY, ordinary income of 11.30 billion yen, up 15.9% YoY, and net income attributable to owners of parent of 7.85 billion yen, up 0.1% YoY. The ordinary income margin is planned to improve slightly from 4.8% in FY3/2026 to 5.0%, and the fact that ordinary income growth is expected to exceed sales growth shows the effect of fixed-cost absorption in the order recovery phase. However, net income is almost flat, and the sense of growth on a bottom-line basis remains limited.
By business, the main driver of recovery is the EC Business. For FY3/2027, the Company forecasts consolidated EC Business sales, including the PB Business, of 185.83 billion yen, up 14.3% YoY. Of this, the EC Business is expected to be 172.55 billion yen, up 14.5% YoY, and the PB Business is expected to be 13.28 billion yen, up 12.7% YoY. The CN Business is planned at 39.17 billion yen, down 4.9% YoY. The CN Business is based on conservative assumptions that factor in a reactionary decline following its strong performance in FY3/2026, while maintaining high profitability. In contrast, the EC Business and the PB Business are structured to benefit from normalized supply chain inventories, demand recovery, and the conversion of long-lead-time orders into sales.
In the medium term, VISION2030 will serve as an evaluation axis for the earnings forecast. Under this plan, the Company targets sales of 300.0–350.0 billion yen, an ordinary income margin of 8% or more, and ROE of 20% or more in FY3/2030. The sales composition ratio is set at 15% for the CN Business, 75% for the EC Business, and 10% for the PB Business, and target ordinary income margins are 12% for the CN Business, 7% for the EC Business, and 10% for the PB Business. In other words, the Company’s medium-term scenario is not merely a recovery in sales, but raising the overall profit margin through profitability improvement in the EC Business and the PB Business.
The positive factor is that orders and the order backlog increased at the end of FY3/2026, providing a certain basis for the sales assumed in the Company plan. The negative factor is the possibility that improvement in the gross profit margin may be delayed if the EC Business recovery is biased toward long-lead-time orders and commercial rights for automotive applications. To overcome this, recovery for industrial equipment applications, the accumulation of high-value-added projects in the PB Business, and expansion of solution-type projects in the EC Business are necessary.
In the FY3/2027 forecast, we want to place greater emphasis on the degree of improvement in the ordinary income margin than on sales recovery. If the increase in orders in the EC Business is converted into sales accompanied by an improvement in the gross profit margin and the PB Business turns around, the market valuation of the likelihood of achieving VISION2030 will rise by another step. On the other hand, if sales growth alone comes first and margin improvement is delayed, the Company’s share re-rating may remain limited.
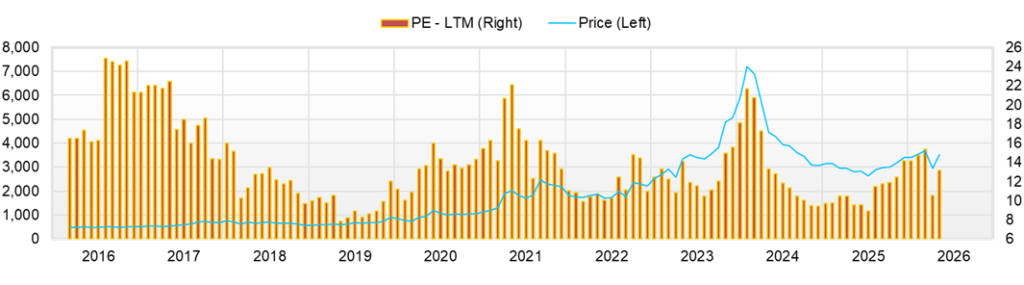
◇ Share price trends and points to watch: The valuation gap with Tokyo Electron reflects the degree of confidence in margin recovery
The Company’s shares are in a phase where order recovery and higher dividends are being evaluated to some extent, but investors are cautious about full-scale upside until a reversal in the EC Business profit margin is confirmed. Looking at the trend over approximately the past three months, the share price moved from around 3,600 yen on January 28 to a year-to-date high of 3,860 yen on February 12, then fell to a year-to-date low of 2,920 yen on March 30, before recovering to a closing price of 3,620 yen on April 27. The decline from the February high to the March low was approximately 24%, and the rebound from the March low to April 27 was approximately 24%, confirming the high volatility of this semiconductor-related stock. From a technical perspective, the upper resistance zone is from the 3,600 yen level to the February high of 3,860 yen, while the lower support zone is around 3,000 yen.
Valuation is based on a market capitalization of 111.7 billion yen, a forecast PER of 12.8x, and an actual PBR of 1.98x. There is no sense of extreme overvaluation for a technology trading company with high ROE and a high dividend yield, but given that FY3/2026 ended with lower sales and profits, the current valuation appears to be at a level where “order recovery is starting to be priced in, but confidence in margin improvement has not yet been priced in.” The market recognizes growth expectations to some extent, but is still assessing the sustainability of the semiconductor market recovery and profitability improvements in the EC Business.
What should be noted here is the difference in stock price valuation from Tokyo Electron. Even as AI semiconductor-related stocks are attracting attention and Tokyo Electron’s stock price is firming, the recovery in the Company’s shares is relatively sluggish. This indicates that, despite the Company being a Tokyo Electron-affiliated company with semiconductor-related businesses, the market does not view the two companies as the same type of growth stock.
Tokyo Electron itself is a global semiconductor production equipment manufacturer directly linked to AI semiconductors, advanced logic, HBM, and front-end process equipment investment, and has high profit margins and strong pricing power. On the other hand, the Company is a technology trading company, and its earnings are affected by the distribution of semiconductor products, customer inventory cycles, demand and commercial rights for industrial equipment and automotive applications, project composition including the PB Business, and IT infrastructure investment. Therefore, the rise in Tokyo Electron’s stock price cannot be directly linked to an increase in the valuation of the Company’s shares.
The reason the Company’s shares have remained sluggish over the past three years also lies in this point. From FY3/2021 to FY3/2024, the Company’s performance grew significantly, but more recently, sales, operating income, ordinary income, EPS, and ROE have all passed their peaks. Although ROE in FY3/2026 remains at a certain level, the direction is downward. To be evaluated as a semiconductor-related stock, a reacceleration of profit growth is necessary, and it is difficult for the stock price to sustain further upside based solely on its past high-growth track record.
Among recent factors, the most important were the FY3/2026 results announcement on April 27 and the upward revision of the year-end dividend forecast. FY3/2026 sales were 203.748 billion yen, down 5.8% YoY, and ordinary income was 9.750 billion yen, down 14.6% YoY, while the Company’s FY3/2027 forecast was sales of 225.0 billion yen, up 10.4% YoY, and ordinary income of 11.3 billion yen, up 15.9% YoY. In addition, annual dividends are 107 yen for FY3/2026 and 108 yen for FY3/2027, and the shareholder return stance is a certain supporting factor.
However, the stock price valuation of the results is not monolithic. The closing price on April 27 was 3,620 yen, up 6.0% from the April 24 closing price of 3,415 yen, but the results announcement was after the market close on April 27, and the rise on that day can be regarded as a move in advance that included expectations for the results and buying interest in semiconductor-related stocks. The results themselves are positive in terms of the FY3/2027 forecast for higher sales and higher ordinary income, and the dividend increase policy, but the facts that FY3/2026 saw lower sales and profits, the EC Business profit margin declined, and FY3/2027 net income is almost flat remain. Therefore, what the market wants to confirm next is not whether orders are recovering, but the likelihood that the increase in orders will be converted into sales and margin improvement.
Going forward, the condition for considering an active increase in the portfolio weighting is that the increase in orders in the EC Business is converted not only into sales but also into profits, accompanied by an improvement in the gross profit margin. Specifically, it is necessary for the EC Business segment profit margin to bottom out from 1Q FY3/2027 onward, for the quality of automotive, industrial equipment, and long-lead-time projects to be disclosed as the breakdown of the order backlog, and for the progress rate against the first-half plan to indicate upside or room for upward revision. In addition, if the Company more clearly explains progress toward VISION2030, the margin improvement scenario for the EC Business and the PB Business, and the timing of the end of customer inventory adjustments, investors’ risk premium is likely to decline.
In terms of investment timing, in the short term, a phase in which the share price rebounds with volume while maintaining the 3,200 yen level would be effective, and in the medium term, a phase in which margin improvement in the EC Business is confirmed in the 1Q FY3/2027 results would be effective. Conversely, even if the share price breaks above 3,860 yen, if the rise is driven solely by increased orders, investors should be cautious about following it. If an upward revision, disclosure of progress in the PB Business, the end of customer inventory adjustments, or risk-on sentiment for semiconductor-related stocks as a whole overlaps, it will provide a trigger to consider increasing the portfolio weighting positively. On the other hand, if the share price clearly falls below 3,000 yen, this should be viewed as a sign that market confidence in the order recovery scenario has declined, and a more cautious judgment will be required for additional purchases.
The share price has rebounded significantly from its March low. However, based on recent price movements and valuation, the market is waiting not only for order recovery but also for a recovery in margins. For the Company to be re-rated, what is necessary is not theme-driven buying linked to the rise in Tokyo Electron itself, but company-specific performance improvements, such as profitability improvement in the EC Business, bottoming out of the PB Business, and a halt in the decline in ROE. If these are confirmed, they will provide a basis for raising the judgment by one step from neutral to slightly positive.
Company profile
◇ A Tokyo Electron-affiliated hybrid company that combines semiconductor and IT technology trading company functions with manufacturer functions
TOKYO ELECTRON DEVICE LIMITED is a hybrid company that deeply engages with customers’ technical issues by combining specialized trading company functions in semiconductors and electronic devices with IT infrastructure, security, design and development, and private brand products. The Company was established in March 1986 and has 1,383 consolidated employees (March 31, 2025). Against the backdrop of the credibility of a group company with Tokyo Electron Limited as a core shareholder, it has a broad customer base, including industrial equipment manufacturers, automotive-related companies, telecommunications carriers, data centers & cloud business operators, and system integrators.
The business model is characterized not by mere purchase and resale, but by combining technical support, design support, product selection, maintenance, monitoring, and post-introduction operations. In the semiconductor and electronic device area, the Company handles processors, analog ICs, logic ICs, boards, software, electronic components, and other products. It is involved from the product development stage for customers. In the computer systems area, it provides networks, storage, security, cloud infrastructure, and maintenance and monitoring services, responding to the advancement of corporate IT infrastructure. In addition, in the private brand business, it provides wafer inspection system and design and manufacturing services, thereby creating added value for the Company. Its combination of trading company commercial rights, customer contact through engineers, and manufacturer functions is the source of the Company’s medium- to long-term competitiveness.
Key financial data
| Unit: million yen | 2022 | 2023 | 2024 | 2025 | 2026 | 2027 CE |
| Sales | 179,907 | 240,350 | 242,888 | 216,379 | 203,748 | 225,000 |
| EBIT (Operating Income) | 8,133 | 14,228 | 15,429 | 12,459 | 10,254 | |
| Pretax Income | 7,910 | 12,469 | 13,887 | 11,408 | 10,883 | |
| Net Profit Attributable to Owner of Parent | 5,085 | 8,778 | 9,986 | 8,874 | 7,842 | 7,850 |
| Cash & Short-Term Investments | 5,134 | 6,538 | 6,867 | 8,384 | 7,622 | |
| Total assets | 108,045 | 143,751 | 163,349 | 157,600 | 162,211 | |
| Total Debt | 29,479 | 45,652 | 52,101 | 42,633 | 29,433 | |
| Net Debt | 24,345 | 39,114 | 45,234 | 34,249 | 21,811 | |
| Total liabilities | 76,025 | 104,753 | 117,158 | 108,595 | 108,453 | |
| Total Shareholders’ Equity | 30,953 | 37,849 | 45,042 | 47,861 | 52,831 | |
| Net Operating Cash Flow | -891 | -12,185 | 301 | 18,915 | 15,684 | |
| Capital Expenditure | 380 | 270 | 903 | 1,762 | 381 | |
| Net Investing Cash Flow | -155 | -199 | -2,695 | -2,068 | 1,200 | |
| Net Financing Cash Flow | 606 | 13,746 | 2,529 | -15,251 | -17,848 | |
| Free Cash Flow | -1,240 | -12,361 | -3 | 17,363 | 15,412 | |
| ROA (%) | 5.10 | 6.97 | 6.50 | 5.53 | 4.90 | |
| ROE (%) | 16.97 | 25.52 | 24.10 | 19.11 | 15.58 | |
| EPS (Yen) | 170.2 | 294.8 | 333.4 | 295.7 | 265.9 | 265.8 |
| BPS (Yen) | 1,042.4 | 1,268.2 | 1,501.1 | 1,624.1 | 1,794.0 | |
| Dividend per Share (Yen) | 68.33 | 118.33 | 135.00 | 119.00 | 107.00 | 108.00 |
| Shares Outstanding (Million shares) | 31.34 | 31.34 | 31.34 | 31.34 | 31.34 |
Source: Calculated by Omega Investment based on FactSet’s standard criteria, rounded to the nearest whole number. The number of shares outstanding reflects post-split adjusted figures.
Share price
Key stock price data
Financial data (quarterly basis)
| Unit: million yen | 2024/3 | 2025/3 | 2026/3 | ||||||
| 4Q | 1Q | 2Q | 3Q | 4Q | 1Q | 2Q | 3Q | 4Q | |
| (Income Statement) | |||||||||
| Sales | 63,140 | 56,607 | 55,105 | 50,384 | 54,283 | 45,136 | 51,108 | 50,472 | 57,032 |
| Year-on-year | -2.0% | -4.1% | -9.2% | -16.1% | -14.0% | -20.3% | -7.3% | 0.2% | 5.1% |
| Cost of Goods Sold (COGS) | 52,984 | 47,411 | 47,877 | 42,132 | 45,226 | 38,681 | 43,717 | 42,392 | 47,416 |
| Gross Income | 10,156 | 9,196 | 7,228 | 8,252 | 9,057 | 6,455 | 7,391 | 8,080 | 9,616 |
| Gross Income Margin | 16.1% | 16.2% | 13.1% | 16.4% | 16.7% | 14.3% | 14.5% | 16.0% | 16.9% |
| SG&A Expense | 5,588 | 4,942 | 5,189 | 5,686 | 5,457 | 4,999 | 5,284 | 5,336 | 5,669 |
| EBIT (Operating Income) | 4,568 | 4,254 | 2,039 | 2,566 | 3,600 | 1,456 | 2,107 | 2,744 | 3,947 |
| Year-on-year | 19.6% | 17.2% | -42.2% | -30.8% | -21.2% | -65.8% | 3.3% | 6.9% | 9.6% |
| Operating Income Margin | 7.2% | 7.5% | 3.7% | 5.1% | 6.6% | 3.2% | 4.1% | 5.4% | 6.9% |
| EBITDA | 4,826 | 4,495 | 2,271 | 2,845 | 3,909 | 1,720 | 2,374 | 3,017 | 4,220 |
| Pretax Income | 4,200 | 3,614 | 2,532 | 1,786 | 3,476 | 1,715 | 1,950 | 3,427 | 3,791 |
| Consolidated Net Income | 2,936 | 2,506 | 1,812 | 1,279 | 3,307 | 1,240 | 1,368 | 2,451 | 2,825 |
| Minority Interest | 20 | 12 | 1 | 10 | 6 | 22 | 6 | 0 | 13 |
| Net Income ATOP | 2,916 | 2,494 | 1,811 | 1,269 | 3,300 | 1,217 | 1,363 | 2,450 | 2,812 |
| Year-on-year | 1.4% | 14.1% | -23.4% | -49.6% | 13.2% | -51.2% | -24.7% | 93.1% | -14.8% |
| Net Income Margin | 4.6% | 4.4% | 3.3% | 2.5% | 6.1% | 2.7% | 2.7% | 4.9% | 4.9% |
| (Balance Sheet) | |||||||||
| Cash & Short-Term Investments | 6,867 | 7,061 | 9,653 | 9,743 | 8,384 | 7,013 | 8,695 | 5,641 | 7,622 |
| Total assets | 163,349 | 161,802 | 164,278 | 163,485 | 157,600 | 144,121 | 154,925 | 158,331 | 162,211 |
| Total Debt | 52,101 | 48,719 | 52,161 | 50,244 | 42,633 | 32,498 | 38,305 | 34,825 | 29,433 |
| Net Debt | 45,234 | 41,658 | 42,508 | 40,501 | 34,249 | 25,485 | 29,610 | 29,184 | 21,811 |
| Total liabilities | 117,158 | 114,997 | 116,407 | 115,601 | 108,595 | 96,023 | 106,517 | 108,240 | 108,453 |
| Total Shareholders’ Equity | 45,042 | 45,678 | 46,743 | 46,747 | 47,861 | 46,939 | 47,244 | 49,177 | 52,831 |
| (Profitability %) | |||||||||
| ROA | 6.50 | 6.79 | 6.27 | 5.32 | 5.53 | 4.97 | 4.48 | 5.18 | 4.90 |
| ROE | 24.10 | 24.49 | 22.13 | 19.17 | 19.11 | 16.41 | 15.21 | 17.37 | 15.58 |
| (Per-share) Unit: JPY | |||||||||
| EPS | 97.2 | 83.1 | 60.1 | 42.1 | 110.4 | 41.2 | 46.0 | 83.3 | 95.4 |
| BPS | 1,501.1 | 1,520.4 | 1,552.5 | 1,550.5 | 1,624.1 | 1,583.3 | 1,608.2 | 1,671.8 | 1,794.0 |
| Dividend per Share | 74.00 | 0.00 | 52.00 | 0.00 | 67.00 | 0.00 | 35.00 | 0.00 | 72.00 |
| Shares Outstanding (million shares) | 31.34 | 31.34 | 31.34 | 31.34 | 31.34 | 31.34 | 31.34 | 31.34 | 31.34 |
Source: Calculated by Omega Investment based on FactSet’s standard criteria, rounded to the nearest whole number. The number of shares outstanding reflects post-split adjusted figures.
Financial data (full-year basis)
]
| Unit: million yen | 2017 | 2018 | 2019 | 2020 | 2021 | 2022 | 2023 | 2024 | 2025 | 2026 |
| (Income Statement) | ||||||||||
| Sales | 131,855 | 159,841 | 141,000 | 135,394 | 143,268 | 179,907 | 240,350 | 242,888 | 216,379 | 203,748 |
| Year-on-year | 11.9% | 21.2% | -11.8% | -4.0% | 5.8% | 25.6% | 33.6% | 1.1% | -10.9% | -5.8% |
| Cost of Goods Sold | 116,709 | 142,160 | 121,295 | 115,491 | 122,666 | 154,268 | 206,106 | 205,720 | 182,646 | 172,206 |
| Gross Income | 15,146 | 17,681 | 19,705 | 19,903 | 20,602 | 25,639 | 34,244 | 37,168 | 33,733 | 31,542 |
| Gross Income Margin | 11.5% | 11.1% | 14.0% | 14.7% | 14.4% | 14.3% | 14.2% | 15.3% | 15.6% | 15.5% |
| SG&A Expense | 13,481 | 14,924 | 16,179 | 16,091 | 15,981 | 17,506 | 20,016 | 21,739 | 21,274 | 21,288 |
| EBIT (Operating Income) | 1,665 | 2,757 | 3,526 | 3,812 | 4,621 | 8,133 | 14,228 | 15,429 | 12,459 | 10,254 |
| Year-on-year | 11.7% | 65.6% | 27.9% | 8.1% | 21.2% | 76.0% | 74.9% | 8.4% | -19.2% | -17.7% |
| Operating Income Margin | 1.3% | 1.7% | 2.5% | 2.8% | 3.2% | 4.5% | 5.9% | 6.4% | 5.8% | 5.0% |
| EBITDA | 2,254 | 3,317 | 4,035 | 4,451 | 5,234 | 8,864 | 14,787 | 16,192 | 13,520 | 11,331 |
| Pretax Income | 1,435 | 2,485 | 3,257 | 3,227 | 4,589 | 7,910 | 12,469 | 13,887 | 11,408 | 10,883 |
| Consolidated Net Income | 972 | 1,655 | 2,403 | 2,370 | 3,217 | 5,489 | 8,879 | 10,081 | 8,904 | 7,884 |
| Minority Interest | 0 | 56 | 61 | 81 | 74 | 404 | 100 | 94 | 29 | 41 |
| Net Income ATOP | 972 | 1,598 | 2,341 | 2,288 | 3,143 | 5,085 | 8,778 | 9,986 | 8,874 | 7,842 |
| Year-on-year | 5.1% | 64.4% | 46.5% | -2.3% | 37.4% | 61.8% | 72.6% | 13.8% | -11.1% | -11.6% |
| Net Income Margin | 0.7% | 1.0% | 1.7% | 1.7% | 2.2% | 2.8% | 3.7% | 4.1% | 4.1% | 3.8% |
| (Balance Sheet) | ||||||||||
| Cash & Short-Term Investments | 2,433 | 3,606 | 3,794 | 4,492 | 5,680 | 5,134 | 6,538 | 6,867 | 8,384 | 7,622 |
| Total assets | 73,708 | 86,708 | 78,927 | 77,013 | 91,453 | 108,045 | 143,751 | 163,349 | 157,600 | 162,211 |
| Total Debt | 24,243 | 34,266 | 25,443 | 19,400 | 25,396 | 29,479 | 45,652 | 52,101 | 42,633 | 29,433 |
| Net Debt | 21,810 | 30,660 | 21,649 | 14,908 | 19,716 | 24,345 | 39,114 | 45,234 | 34,249 | 21,811 |
| Total liabilities | 50,780 | 62,306 | 52,516 | 49,870 | 61,799 | 76,025 | 104,753 | 117,158 | 108,595 | 108,453 |
| Total Shareholders’ Equity | 22,926 | 23,838 | 25,806 | 26,476 | 28,965 | 30,953 | 37,849 | 45,042 | 47,861 | 52,831 |
| (Cash Flow) | ||||||||||
| Net Operating Cash Flow | -4,685 | -7,993 | 12,335 | 8,651 | -3,463 | -891 | -12,185 | 301 | 18,915 | 15,684 |
| Capital Expenditure | 166 | 256 | 262 | 544 | 427 | 380 | 270 | 903 | 1,762 | 381 |
| Net Investing Cash Flow | -262 | -896 | -1,708 | -549 | -469 | -155 | -199 | -2,695 | -2,068 | 1,200 |
| Net Financing Cash Flow | 4,739 | 9,869 | -10,504 | -7,479 | 5,079 | 606 | 13,746 | 2,529 | -15,251 | -17,848 |
| Free Cash Flow | -4,818 | -8,133 | 12,111 | 8,163 | -3,811 | -1,240 | -12,361 | -3 | 17,363 | 15,412 |
| (Profitability ) | ||||||||||
| ROA (%) | 1.41 | 1.99 | 2.83 | 2.94 | 3.73 | 5.10 | 6.97 | 6.50 | 5.53 | 4.90 |
| ROE (%) | 4.31 | 6.84 | 9.44 | 8.76 | 11.34 | 16.97 | 25.52 | 24.10 | 19.11 | 15.58 |
| Net Margin (%) | 0.74 | 1.00 | 1.66 | 1.69 | 2.19 | 2.83 | 3.65 | 4.11 | 4.10 | 3.85 |
| Asset Turn | 1.91 | 1.99 | 1.70 | 1.74 | 1.70 | 1.80 | 1.91 | 1.58 | 1.35 | 1.27 |
| Assets/Equity | 3.06 | 3.43 | 3.34 | 2.98 | 3.04 | 3.33 | 3.66 | 3.70 | 3.45 | 3.18 |
| (Per-share) Unit: JPY | ||||||||||
| EPS | 32.2 | 52.7 | 76.9 | 74.8 | 104.1 | 170.2 | 294.8 | 333.4 | 295.7 | 265.9 |
| BPS | 758.6 | 785.0 | 845.4 | 880.4 | 957.1 | 1,042.4 | 1,268.2 | 1,501.1 | 1,624.1 | 1,794.0 |
| Dividend per Share | 20.00 | 22.00 | 31.00 | 30.00 | 41.67 | 68.33 | 118.33 | 135.00 | 119.00 | 107.00 |
| Shares Outstanding (million shares) | 31.34 | 31.34 | 31.34 | 31.34 | 31.34 | 31.34 | 31.34 | 31.34 | 31.34 | 31.34 |
Source: Calculated by Omega Investment based on FactSet’s standard criteria, rounded to the nearest whole number. The number of shares outstanding reflects post-split adjusted figures.