2026-07-15
Home
Japanese

Omega Investment Co., Ltd.
CNS (Investment report – 3Q update)
| Share price (4/24) | ¥1,707 | Dividend Yield (26/5 CE) | 3.2 % |
| 52weeks high/low | ¥1,433/1,920 | ROE(25/5) | 11.2 % |
| Avg Vol (3 month) | 2.7 thou shrs | Operating margin (TTM) | 7.9 % |
| Market Cap | ¥4.96 bn | Beta (5Y Monthly) | 0.45 |
| Enterprise Value | ¥1.66 bn | Shares Outstanding | 2.906 mn shrs |
| PER (26/5 CE) | 9.3 X | Listed market | TSE Growth |
| PBR (25/5 act) | 1.2 X |
| Click here for the PDF version of this page |
| PDF version |
The strength of the balance sheet and improving margins support the downside. The next share price increase hinges on making capital allocation more concrete.
Investment conclusion
The quality of earnings has improved further, and the next focus is on visualizing capital allocation and growth investments.
CNS Co., Ltd. (hereinafter, the “Company”) maintains a neutral investment conclusion. Compared with the previous report, the assessment appears to have been raised slightly. Investors are not in a position to raise the position ratio at once, and because it is not a highly liquid stock, we would like to acquire it in several tranches while monitoring trading volume. The FY2026/5 3Q cumulative (nine-month) results were net sales of 5.717 billion yen, operating profit of 546 million yen, operating margin of 9.6%, and quarterly net income attributable to owners of the parent of 415 million yen, and the full-year operating profit forecast was also upwardly revised again to 710 million yen. In addition to the expansion of earnings figures, we would like to evaluate whether there is a qualitative improvement in profits.
When compared with the hypotheses set out in the investment conclusion of the previous report, it has become clear which points show progress and which remain issues. The progress that could be confirmed was a structural improvement in the gross margin, driven by a better order mix. In the previous report, we emphasized the improvement in the interim-period gross margin to 25.4%, but even in the 3Q cumulative period, the company-wide gross margin remained at 24.8% and the operating margin at 9.6%. In particular, the Technology Solutions business benefited from generative AI projects, next-generation payment projects, and the expansion of structures at existing customers. It grew to net sales of 2.608 billion yen and gross profit of 770 million yen.
On the other hand, the overall picture of capital allocation remains unaddressed. This time, progressive dividends with a target dividend payout ratio of 30% or more and a year-end dividend increase to 55 yen could be confirmed, but making capital allocation more concrete, which was also an issue in the previous report, remains insufficient. It has not reached the point of raising the investment conclusion to a bullish stance, and we maintain neutrality.
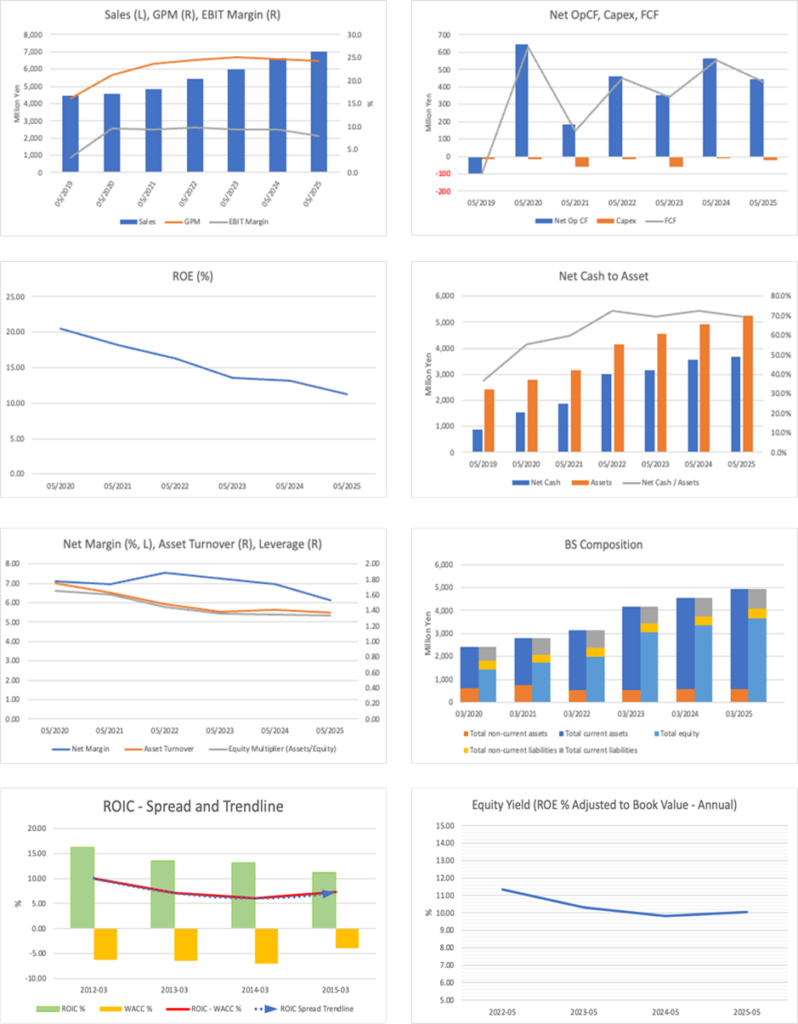
There are three reasons for this conclusion. First, both growth and profitability are improving simultaneously. Net sales increased 10.2% YoY, but operating profit increased 29.8% YoY, and profit growth significantly exceeds net sales growth. Moreover, this full-year upward revision was not due to an upside in net sales, but rather to an increase in high-gross-margin projects and partial non-consumption of SG&A expenses. The content is good. Second, the businesses’ strengths and weaknesses are beginning to emerge. The Business Solutions business has weak profits due to the suppression of customer orders and the prolongation of some projects. In contrast, the Consulting business has shifted to upstream projects, resulting in lower net sales and higher profits. Company-wide, the Technology Solutions business is driving growth. Third, there is support from financial safety and valuation. The equity ratio at the end of 3Q was 76.6%. Against a market capitalization of 4.9 billion yen, net cash was approximately 3.3 billion yen; the forecast PER was 10.2x, and the actual PBR was 1.18x. Taking into account the capital efficiency of ROE 11.2% and ROIC 13.6%, we view the downside risk to the share price as firm.
However, to be more bullish as an investment conclusion, several points still require confirmation. The Company has room to accumulate high-value-added projects centered on cloud, ServiceNow, AI, OCI, and its in-house service, U-Way, to enhance profitability. On the other hand, for a reassessment of the share price, not only a sense of undervaluation but also factors that warrant a reassessment of the valuation, such as continued EPS growth, continued dividend increases, and a more concrete capital allocation policy, including share buybacks, will be necessary. At this stage, while adding it to a portfolio can be considered for downside resilience, it is reasonable to raise the holding ratio after confirming the reassessment conditions.
The sources of the Company’s strength are technological assets spanning OCI (Oracle Cloud Infrastructure), ERP, ServiceNow, data/AI, and project execution capabilities that connect upstream consulting to implementation. In addition, with its in-house service, U-Way, it is easier to build a pipeline of ongoing projects beyond one-off contracts. Furthermore, with three business categories, technology, business, and consulting, its strength lies in its ability to handle the entry and exit points of projects. Project diversity and a strong financial profile, as pointed out in the previous report, continue to be the Company’s strengths, and precisely because of these strengths, it can implement management that raises margins company-wide while compensating for weaknesses in some businesses with others. This is the basis for viewing the maintenance of neutrality and the acquisition in tranches as reasonable.
In summary, the Company is in a phase that should be evaluated not only as a cash-rich, undervalued stock but also as a company with improving earnings. However, to raise the investment conclusion one step further, additional confirmation is still needed. Specifically, the conditions are that the high-profit growth of the Technology Solutions business continues from 4Q onward, the profitability of the Business Solutions business recovers, progress in human capital investment and productivity improvement becomes visible, and the capital allocation policy, including items other than dividends, becomes clearer. On the other hand, if profit improvement remains temporary and disclosure regarding growth investment and capital allocation does not progress, it is reasonable to maintain the neutral conclusion. The Company’s shares are, at present, in effect viewed as being in a stage just before reassessment becomes full-fledged.
◇ FY2026/5 3Q results highlights: Margins rose due to the expansion of high-gross-margin projects, and the effects of the growth strategy appeared in the numbers.
The FY2026/5 3Q cumulative results were content in which profit growth was notable beyond higher net sales. Net sales were 5.717 billion yen, up 10.2% YoY; operating profit was 546 million yen, up 29.8% YoY; ordinary profit was 570 million yen, up 28.8% YoY; and quarterly net income attributable to owners of the parent was 415 million yen, up 38.6% YoY. The gross margin rose to 24.8%, and the operating margin rose to 9.6%, and profitability clearly improved from the prior year. The key point of this quarter’s results is that margins were raised. At the same time, net sales grew, and the shift to focus areas such as generative AI, ServiceNow, OCI, and ERP led to improved profitability, as reflected in the numbers.
The driver was the Technology Solutions business. Generative AI-related projects, new development of a next-generation payment platform, and expansion of structures at existing customers contributed. Net sales increased to 2.608 billion yen, up 27.7% YoY, and gross profit increased to 770 million yen, up 31.7% YoY. The rise in the ratio of high-gross-margin projects improved the company-wide gross margin and absorbed increases in SG&A expenses, such as office relocation costs, resulting in higher operating profit. It can be seen that not merely an increase in the number of projects, but an improvement in project quality, supported profit growth.
On the other hand, the Business Solutions business was somewhat weak. Projects for financial institutions and U-Way-related items were steady. However, due to customer cancellations and project extensions, net sales were 2.585 billion yen, roughly flat YoY, and gross profit was 473 million yen, down 9.8% YoY. However, rather than demand itself having been lost, the main issues are project progress and profitability. The Consulting business also had net sales of 524 million yen, down 5.0% YoY, but gross profit increased to 175 million yen, up 18.6% YoY, driven by a shift toward upstream projects, which compensated for the company-wide profit improvement. The next focus after this quarter’s results is, in addition to whether the strong performance of the Technology Solutions business continues, whether recovery in profitability of the Business Solutions business and enhancement of U-Way lead to sustained improvement in company-wide earnings power.
There are also positive non-financial items. In line with the mid-term management plan, the Company is promoting a shift to high-value-added areas and advancing DX and AI collaboration with Vietnam-based NTQ Solution, strengthening collaboration with Oracle in the ERP domain, and enhancing its in-house service, U-Way. In March, it launched the “U-Way Lite OCI Security Model” and aims to expand standardized cloud projects. In April, it was certified for the first time as a “Certified Health & Productivity Management Outstanding Organization 2026,” and the foundation for human capital is also being developed.
The Company kept its full-year net sales forecast at 8.253 billion yen, while upwardly revising operating profit to 710 million yen and also raising the year-end dividend forecast to 55 yen. The upward revisions to profit and dividends show that this improvement is supported by improved profitability.
◇ Segment analysis: A structure that builds earnings across three layers, leading-edge, business, and upstream, with technology driving growth at present
The Company’s business structure is easy to understand when organized into three layers: Technology Solutions that bears growth, Business Solutions that support the earnings base, and Consulting that serves as the starting point for margin improvement. While it is an accounting single segment of the system engineering services business, in terms of business operations, it is managed through these three businesses, and this structure creates company-wide earnings by combining growth in leading-edge areas and stability in existing areas. The FY2025/5 net sales mix was Technology 40%, Business 49%, and Consulting 11%, and customer transaction types were 30% direct and 70% indirect.
The Technology Solutions business is responsible for implementing and operating ServiceNow, developing system infrastructure, and utilizing cloud resources. It has strengths in integrating and automating customers’ business processes, as well as advancing the platform. At present, generative AI projects for major SIers, the development of a next-generation payment platform, and the expansion of structures at existing customers support growth. In the FY2026/5 3Q cumulative period, net sales were 2.608 billion yen, gross profit was 770 million yen, and the gross margin was 30%, the strongest growth driver among the three businesses.
The Business Solutions business, in addition to system development for financial institutions and retail/distribution, is responsible for the in-house service U-Way, the use of OCI, and the implementation of ERP packages. Because it includes operations and maintenance after implementation, it is characterized by its ability to generate recurring revenue easily. In the FY2026/5 3Q cumulative period, net sales were 2.585 billion yen and gross profit was 473 million yen; net sales remained roughly flat YoY, but profitability declined somewhat due to reduced customer orders and the prolongation of some projects. Its importance as the earnings base is high, but the near-term focus is rebuilding margins.
The Consulting business is an upstream domain responsible for supporting the formulation and execution of the DX strategy, business process reform, digital and AI human resource development, and the promotion of AI utilization. Its role lies not in expanding net sales scale but in acquiring high-value-added projects and creating downstream projects. In the FY2026/5 3Q cumulative period, net sales declined YoY to 524 million yen, while gross profit rose to 175 million yen and the gross margin to 34%. The shift to upstream consulting projects has improved project quality and is contributing to company-wide margin improvement. Roughly estimating the FY2026/5 3Q cumulative net sales composition of the three businesses, Technology is approximately 46%, Business is approximately 45%, and Consulting is approximately 9%. An increase in the composition ratio of the Technology Solutions business is evident.
◇ FY2026/5 outlook: With the repeated upward revision, the certainty of landing is rising; the next focus shifts to the reproducibility of growth that leads into the next fiscal year
The company’s plan for FY2026/5 is becoming increasingly certain, and the focus going forward is shifting from landing this fiscal year to whether the current profit improvement can be sustained into the next fiscal year and beyond. The Company will keep full-year net sales at 8.253 billion yen, but raised operating profit to 710 million yen, ordinary profit to 734 million yen, and net income attributable to owners of the parent to 532 million yen. Compared with the previous fiscal year, this is a plan of net sales up 17.8%, operating profit up 27.9%, net income up 24.5%, and the operating margin rising to 8.6%. Operating profit in the 3Q cumulative period is 546 million yen. Because the operating profit needed in 4Q for the full-year plan is only 164 million yen, the numerical hurdle is not high. This upward revision was not due to an upside in net sales, but due to an increase in high-margin projects and partial non-consumption of SG&A expenses, and the content is good. It is evident that this fiscal-year plan is well within the achievable range.
Consistency with the mid-term management plan is also clear. The Company sets forth targets of net sales of 10.0 billion yen and an operating margin of 10% or more in FY2027/5. The forecast for this fiscal year is just over 80% of the target for net sales and 8.6% for operating margin, and the path to reaching the target has become clearer. In addition, reorganizing business categories into three categories and adopting an operating structure that separates growth areas, the earnings base, and upstream functions are also significant considerations for future resource allocation. Furthermore, enhancing the in-house service U-Way, strengthening collaboration with NTQ Solution, and collaborating with Oracle in the ERP domain will lead to project creation and the reinforcement of supply capability in the next fiscal year and beyond.
On the other hand, some points should be viewed cautiously. This profit improvement includes partial non-consumption of SG&A expenses, and it is too early to regard it as the underlying earnings power for the next fiscal year as is. In addition, the Company itself continues to cite a shortage of IT human resources and harsh hiring conditions as ongoing issues. Therefore, while the possibility of achieving this fiscal-year plan is high, the next evaluation axis is how much can be seen in the continuation of high-margin projects, the accumulation of in-house services, and the strengthening of supply capability through external collaboration. Rather than whether an upward revision occurs, it is important whether disclosure can be obtained showing reproducibility of growth, namely, whether U-Way-, ERP-, and AI-related projects will support profit growth in the next fiscal year as well. While the visibility of landing is increasing, the next focus is whether the reproducibility of growth leading into the next fiscal year can be demonstrated.
◇ Share price trends and points to watch going forward: The share price is returning to an earnings-driven market, but reassessment requires the next move in capital allocation
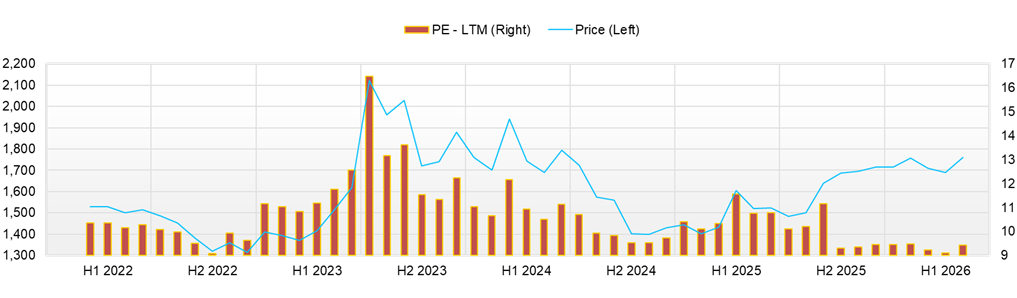
After a significant correction over the past three months, the share price has recovered on the back of upward revisions to earnings and dividend increases. However, the evaluation axis is still closer to that of an “undervalued solid performer” rather than a “growth stock.” The share price rose from 1,707 yen on January 5 to the year-to-date high of 1,895 yen on January 22. It then moved sideways around 1,720 yen in February and corrected to the year-to-date low of 1,604 yen on March 23, but closed at 1,769 yen on April 10 and 1,728 yen on April 13. The Company’s current market capitalization is 4.9 billion yen, the forecast PER is 10.2x, the actual PBR is 1.18x, and the forecast dividend yield is 3.18%. Even after raising the profit forecast, multiples remain low, and the market has not yet fully priced in the sustainability of growth and capital policy. The share price remains undervalued, but it has not reached a point where it is bought solely because it is cheap.
Looking at share price reactions to catalysts, the Company’s shares respond more clearly to disclosures accompanied by profit and return updates than to non-financial IR. After the full-year upward revision on January 9, the share price rose to 1,745 yen and to 1,780 yen on January 13, with volume also swelling to 22,700 shares. In the simultaneous disclosure of 3Q results, a repeated upward revision, and a dividend increase on April 10, the share price rebounded from 1,721 yen on April 9 to 1,769 yen. On the other hand, the launch of the “U-Way Lite OCI Security Model” on March 30 is a positive development for the business, but the share price fell slightly from 1,687 yen on March 27 to 1,670 yen on March 30, and the short-term reaction was limited. The first-time certification as a “Certified Health & Productivity Management Outstanding Organization 2026” on April 6 also led to a close of 1,696 yen on April 7, nearly flat from the previous weekend. The market is not looking at new services or human capital initiatives themselves, but at how they translate into profit and returns.
Based on recent news, the order in which it tends to be effective for the share price can be organized as: first, earnings revisions and dividend increases; second, business topics that lead into next fiscal year’s earnings; and third, ESG and human-capital-related items. Following the upward revision on April 10, the share price rose 2.8% from April 9, but it fell back to 1,728 yen on April 13, while volume increased from 4,700 shares on April 10 to 11,400 shares. While it reacted to the positive factors, it has not yet led to buying to the extent that the evaluation is raised one step further by chasing highs. The new U-Way service on March 30 is important in the medium term for standardizing OCI projects and capturing security demand, but it is unlikely to serve as a short-term share price catalyst. The health and productivity management certification on April 6 is also a desirable development as a foundation for hiring and retention, but it is unlikely to be a catalyst for the share price.
From a technical standpoint, 1,604 yen on March 23 is strong downside support for the time being, and it then recovered to 1,769 yen on April 10. Although it fell back to 1,728 yen on April 13, it remains 7.7% higher than the March low, and the short-term recovery trend itself has not been broken. In the near term, the first hurdle is whether it can hold the 1,700 yen low, and on the upside, the area around 1,769 yen (April 10) is the first level, followed by the year-to-date high of 1,895 yen as a clear resistance. Therefore, for the next share price increase, confirming three points will be important: continued earnings outperformance, progress in capital allocation, and clarification of the outlook for the next fiscal year. A further upward revision, confirmation of continued profit growth in the full-year results, or a more concrete capital allocation policy, including share buybacks, is likely to trigger the share price to break through key levels. The conditions under which it becomes easier to raise the portfolio weight are that, in addition to the continuation of high-profit growth in the Technology Solutions business, profitability of the Business Solutions business recovers, the return policy becomes more concrete one step further, and the outlook for next fiscal year’s profit growth is clearly shown in the full-year results or the institutional investor briefing in July. If these are in place, given that it is a small-cap stock, there is ample room to reassess the share price.
Key stock price data
Company profile
◇ An independent DX support company aiming to realize its 2030 vision by layering human capital initiatives on top of its implementation capabilities in leading-edge technologies
CNS Co., Ltd. is an independent IT solutions company that supports companies’ operational efficiency and DX promotion while implementing leading-edge technologies such as cloud and AI, and at present, it is increasingly taking on the character of a transformation company that is shifting its emphasis to high-value-added areas rather than being merely a contract development company. As of the end of May 2025, the number of employees was 265 on a consolidated basis and 221 on a non-consolidated basis, and CNS Hokkaido Co., Ltd. is a consolidated subsidiary. The business is operated across three domains: Technology Solutions, Business Solutions, and Consulting. Its service areas include ServiceNow implementation and operation, cloud infrastructure development, system development for financial institutions and retail/distribution, the in-house service “U-Way,” ERP implementation, and DX strategy formulation and AI utilization support.
The Company’s mission is “To create new value that advances society through the power of caring for people.” Furthermore, toward FY2030/5, it aims to become “a corporate group that solves social issues through businesses and services that ‘care for people’ and contributes to people, society, and the future.”
In addition, in April 2026, it was certified for the first time as a “Certified Health & Productivity Management Outstanding Organization 2026 (Large Enterprise Category).” In its action plan, it also sets forth the expansion of the female engineering workforce and the improvement of retention rates. Its disclosure stance, which seeks to demonstrate greater depth in human capital as a foundation for business growth, can be evaluated as a differentiating factor in the IT industry, where hiring difficulties persist.
Key financial data
| Unit: million yen | 2021 | 2022 | 2023 | 2024 | 2025 CE |
| Sales | 5,419 | 5,989 | 6,657 | 7,005 | 8,253 |
| EBIT (Operating Income) | 533 | 559 | 620 | 555 | 710 |
| Pretax Income | 595 | 589 | 636 | 583 | |
| Net Profit Attributable to Owner of Parent | 409 | 433 | 461 | 427 | 532 |
| Cash & Short-Term Investments | 3,010 | 3,163 | 3,574 | 3,667 | |
| Total assets | 4,152 | 4,547 | 4,934 | 5,260 | |
| Total Debt | 6 | 13 | 11 | 8 | |
| Net Debt | -3,004 | -3,150 | -3,563 | -3,659 | |
| Total liabilities | 1,113 | 1,206 | 1,262 | 1,300 | |
| Total Shareholders’ Equity | 3,039 | 3,341 | 3,672 | 3,959 | |
| Net Operating Cash Flow | 461 | 353 | 565 | 444 | |
| Capital Expenditure | 19 | 59 | 11 | 24 | |
| Net Investing Cash Flow | -23 | -126 | -81 | -269 | |
| Net Financing Cash Flow | 634 | -133 | -134 | -142 | |
| Free Cash Flow | 450 | 344 | 554 | 429 | |
| ROA (%) | 11.23 | 9.96 | 9.73 | 8.38 | |
| ROE (%) | 16.27 | 13.58 | 13.16 | 11.20 | |
| EPS (Yen) | 145.5 | 149.0 | 158.8 | 147.1 | 183.07 |
| BPS (Yen) | 1,045.7 | 1,149.7 | 1,263.5 | 1,362.5 | |
| Dividend per Share (Yen) | 45.00 | 45.00 | 48.00 | 75.00 | 55.00 |
| Shares Outstanding (Million shares) | 2.91 | 2.91 | 2.91 | 2.91 |
Source: Omega Investment from company data, rounded to the nearest whole number.
Share price
Financial data (quarterly basis)
| Unit: million yen | 2024/5 | 2025/5 | 2026/5 | ||||||
| 3Q | 4Q | 1Q | 2Q | 3Q | 4Q | 1Q | 2Q | 3Q | |
| (Income Statement) | |||||||||
| Sales | 1,683 | 1,677 | 1,645 | 1,720 | 1,823 | 1,818 | 1,875 | 1,879 | 1,965 |
| Year-on-year | 10.5% | 3.5% | -0.1% | 4.2% | 8.3% | 8.4% | 14.0% | 9.2% | 7.8% |
| Cost of Goods Sold (COGS) | 1,262 | 1,278 | 1,266 | 1,294 | 1,368 | 1,370 | 1,386 | 1,414 | 1,497 |
| Gross Income | 421 | 399 | 378 | 425 | 455 | 448 | 488 | 465 | 467 |
| Gross Income Margin | 25.0% | 23.8% | 23.0% | 24.7% | 24.9% | 24.7% | 26.0% | 24.7% | 23.8% |
| SG&A Expense | 232 | 292 | 298 | 279 | 260 | 314 | 306 | 296 | 271 |
| EBIT (Operating Income) | 189 | 108 | 80 | 146 | 195 | 134 | 182 | 168 | 196 |
| Year-on-year | 8.2% | -6.8% | -43.6% | -19.5% | 3.0% | 24.9% | 128.7% | 15.0% | 0.5% |
| Operating Income Margin | 11.2% | 6.4% | 4.8% | 8.5% | 10.7% | 7.4% | 9.7% | 9.0% | 10.0% |
| EBITDA | 198 | 117 | 88 | 155 | 209 | 150 | 195 | 184 | 218 |
| Pretax Income | 190 | 123 | 81 | 160 | 202 | 140 | 229 | 177 | 210 |
| Consolidated Net Income | 130 | 111 | 55 | 107 | 137 | 128 | 155 | 119 | 142 |
| Minority Interest | 0 | 0 | 0 | 0 | 0 | 0 | 0 | 0 | 0 |
| Net Income ATOP | 130 | 111 | 55 | 107 | 137 | 128 | 155 | 119 | 142 |
| Year-on-year | 3.7% | -5.7% | -38.4% | -18.2% | 5.5% | 15.3% | 181.6% | 10.8% | 3.1% |
| Net Income Margin | 7.7% | 6.6% | 3.3% | 6.2% | 7.5% | 7.0% | 8.3% | 6.3% | 7.2% |
| (Balance Sheet) | |||||||||
| Cash & Short-Term Investments | 3,325 | 3,574 | 3,372 | 3,382 | 3,355 | 3,667 | 3,479 | 3,657 | 3,304 |
| Total assets | 4,665 | 4,934 | 4,732 | 5,005 | 4,946 | 5,260 | 5,172 | 5,831 | 5,428 |
| Total Debt | 11 | 11 | 10 | 9 | 9 | 8 | 7 | 6 | 6 |
| Net Debt | -3,314 | -3,563 | -3,362 | -3,372 | -3,346 | -3,659 | -3,472 | -3,651 | -3,298 |
| Total liabilities | 1,104 | 1,262 | 1,145 | 1,311 | 1,114 | 1,300 | 1,275 | 1,816 | 1,271 |
| Total Shareholders’ Equity | 3,561 | 3,672 | 3,587 | 3,694 | 3,832 | 3,959 | 3,896 | 4,015 | 4,157 |
| (Profitability %) | |||||||||
| ROA | 10.51 | 9.73 | 9.34 | 8.38 | 8.54 | 8.38 | 10.65 | 9.94 | 10.47 |
| ROE | 13.80 | 13.16 | 12.40 | 11.32 | 11.10 | 11.20 | 14.09 | 13.98 | 13.60 |
| (Per-share) Unit: JPY | |||||||||
| EPS | 44.8 | 38.1 | 18.9 | 36.9 | 47.3 | 44.0 | 53.3 | 40.9 | 48.8 |
| BPS | 1,225.4 | 1,263.5 | 1,234.4 | 1,271.3 | 1,318.6 | 1,362.5 | 1,340.8 | 1,381.7 | 1,430.5 |
| Dividend per Share | 0.00 | 48.00 | 0.00 | 0.00 | 0.00 | 75.00 | 0.00 | 0.00 | 0.00 |
| Shares Outstanding (million shares) | 2.91 | 2.91 | 2.91 | 2.91 | 2.91 | 2.91 | 2.91 | 2.91 | 2.91 |
Source: Omega Investment from company materials
Financial data (full-year basis)
| Unit: million yen | 2021 | 2022 | 2023 | 2024 |
| (Income Statement) | ||||
| Sales | 5,419 | 5,989 | 6,657 | 7,005 |
| Year-on-year | 11.9% | 10.5% | 11.1% | 5.2% |
| Cost of Goods Sold | 4,097 | 4,483 | 5,018 | 5,298 |
| Gross Income | 1,322 | 1,506 | 1,639 | 1,707 |
| Gross Income Margin | 24.4% | 25.1% | 24.6% | 24.4% |
| SG&A Expense | 789 | 947 | 1,019 | 1,151 |
| EBIT (Operating Income) | 533 | 559 | 620 | 555 |
| Year-on-year | 16.4% | 4.8% | 10.9% | -10.4% |
| Operating Income Margin | 9.8% | 9.3% | 9.3% | 7.9% |
| EBITDA | 559 | 589 | 654 | 601 |
| Pretax Income | 595 | 589 | 636 | 583 |
| Consolidated Net Income | 409 | 433 | 461 | 427 |
| Minority Interest | 0 | 0 | 0 | 0 |
| Net Income ATOP | 409 | 433 | 461 | 427 |
| Year-on-year | 21.6% | 5.8% | 6.5% | -7.4% |
| Net Income Margin | 7.6% | 7.2% | 6.9% | 6.1% |
| (Balance Sheet) | ||||
| Cash & Short-Term Investments | 3,010 | 3,163 | 3,574 | 3,667 |
| Total assets | 4,152 | 4,547 | 4,934 | 5,260 |
| Total Debt | 6 | 13 | 11 | 8 |
| Net Debt | -3,004 | -3,150 | -3,563 | -3,659 |
| Total liabilities | 1,113 | 1,206 | 1,262 | 1,300 |
| Total Shareholders’ Equity | 3,039 | 3,341 | 3,672 | 3,959 |
| (Cash Flow) | ||||
| Net Operating Cash Flow | 461 | 353 | 565 | 444 |
| Capital Expenditure | 19 | 59 | 11 | 24 |
| Net Investing Cash Flow | -23 | -126 | -81 | -269 |
| Net Financing Cash Flow | 634 | -133 | -134 | -142 |
| Free Cash Flow | 450 | 344 | 554 | 429 |
| (Profitability ) | ||||
| ROA (%) | 11.23 | 9.96 | 9.73 | 8.38 |
| ROE (%) | 16.27 | 13.58 | 13.16 | 11.20 |
| Net Margin (%) | 7.56 | 7.23 | 6.93 | 6.10 |
| Asset Turn | 1.49 | 1.38 | 1.40 | 1.37 |
| Assets/Equity | 1.45 | 1.36 | 1.35 | 1.34 |
| (Per-share) Unit: JPY | ||||
| EPS | 145.5 | 149.0 | 158.8 | 147.1 |
| BPS | 1,045.7 | 1,149.7 | 1,263.5 | 1,362.5 |
| Dividend per Share | 45.00 | 45.00 | 48.00 | 75.00 |
| Shares Outstanding (million shares) | 2.91 | 2.91 | 2.91 | 2.91 |
Source: Omega Investment from company materials