2026-07-09
Home
Japanese

Omega Investment Co., Ltd.
SUMIDA CORPORATION (Company note – Basic report)

| Share price (6/18) | ¥1,426 | Dividend Yield (12/26 CE) | 3.7 % |
| 52weeks high/low | ¥1,626/925 | ROE(12/25) | 6.0 % |
| Avg Vol (3 month) | 287 thou shrs | Operating margin (12/25) | 5.1 % |
| Market Cap | ¥47.27 bn | Beta (5Y Monthly) | 0.92 |
| Enterprise Value | ¥108.12 bn | Shares Outstanding | 33.109 mn shrs |
| PER (12/26 CE) | 12.9 X | Listed market | TSE Prime section |
| PBR (12/25 act) | 0.75 X |
| Click here for the PDF version of this page |
| PDF version |
A global leader in coil products. Pursuing the Niche-Top Strategy, aiming for growth and improved capital efficiency
Summary
◇ Company profile: SUMIDA CORPORATION (securities code: 6817) is a global leader that leads the industry in the design and manufacture of coil-related components and modules. The Company has built technological capabilities, application development capabilities, and a global production structure, and is developing a custom-made contract manufacturing business for leading customers worldwide. FY12/2025 results were revenue of 147.19 billion yen and operating profit of 7.44 billion yen.
◇Coil business that continues to expand its applications: Although coils have a relatively simple structure in which electric wire is wound in a spiral or coil shape, they have an extremely wide range of electrical and magnetic characteristics. For this reason, in electronic circuits they perform diverse roles, including precise current control, removal of unwanted noise, selection and processing of specific signals, efficient power conversion, and conversion of electrical energy into mechanical motion.
The market size is estimated at approximately US$15.0 billion, and growth at a compound annual growth rate of around 6% is expected. The shift of automobiles to xEVs, the evolution of ADAS, the spread of 5G, AI-related areas, renewable energy, automation, and other factors will drive this growth.
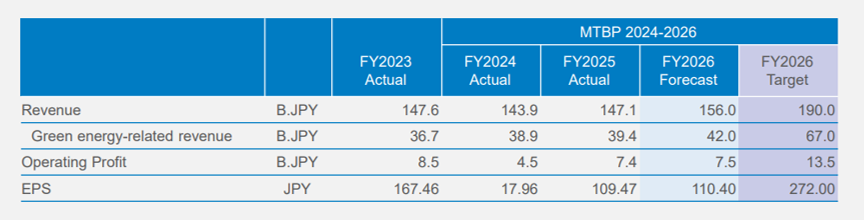
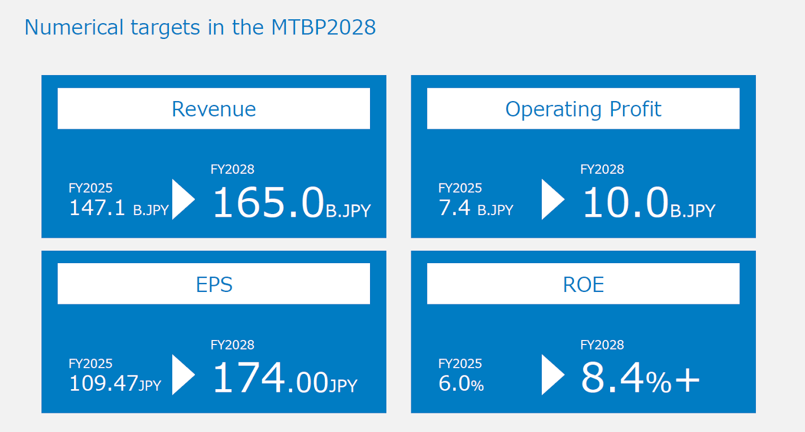
◇Updating the Mid-Term Business Plan and promoting the Niche-Top Strategy: The Company updated its previous Mid-Term Business Plan and presented the Mid-Term Business Plan 2026-2028. It has set its Vision to 2035 as “Top Position in Multiple Niches” and will promote the Niche-Top Strategy. Specifically, the Company will promote measures comprising three layers — High Capital Efficiency, Megatrends, and New Business — and aims to achieve revenue of 165.0 billion yen, operating profit of 10.0 billion yen, EPS of 174 yen, and ROE of 8.4% in FY12/2028. The keys to growth for the time being will be megatrend-related areas such as xEV- and data center-related areas, as well as Schmidbauer-related areas following the acquisition in FY2025. The Company aims to raise and stabilize ROE through these multiple drivers and intends to achieve PBR exceeding 1x. Although the numerical targets are more conservative than in the previous Mid-Term Business Plan, it is a noteworthy plan that gives sufficient consideration to the share price.
◇Earnings trends: FY12/2025 results came in above the Company’s forecast and featured solid project wins. Revenue was 147.19 billion yen (up 2.2% YoY), operating profit was 7.44 billion yen (up 64.8% YoY), profit before income taxes was 4.83 billion yen (up 272.9% YoY), profit attributable to owners of the parent was 3.62 billion yen, EPS was 109.47 yen, and DPS was 53 yen.
The FY12/2026 forecast calls for higher revenue and profit. Revenue is forecast at 156.00 billion yen (up 6.0% YoY), operating profit at 7.50 billion yen (up 0.8% YoY), profit before income taxes at 4.85 billion yen (up 0.4% YoY), profit attributable to owners of the parent at 3.65 billion yen, EPS at 110.40 yen, and DPS at 53 yen. The profit growth rate appears low, but excluding temporary factors in the previous fiscal year, the forecast is for an underlying profit increase of 1.1 billion yen. The first quarter marked a strong start, with revenue up 8.6% and operating profit up 22.2%. However, the full-year forecast has been left unchanged.
◇Stock price trends and catalysts: Over the past 10 years, the share price has moved within a symmetrical triangle pattern, but since March 2026, it has recovered to the level of the resistance line. This is likely because the market has recognized the Company’s agile ability to respond to the business environment and its new Mid-Term Business Plan, which is conscious of the share price. It can also be said that tailwinds in the business environment, such as a recovery in xEV-related areas and expansion in data center investment, are strengthening.
If the share price breaks out of the symmetrical triangle pattern to the upside, market evaluation is highly likely to rise further. For this to happen, the key will be whether the measures in the Mid-Term Business Plan progress and expectations increase that ROE will steadily exceed 8%. In that case, PBR of 1x, or approximately 1,900 yen, is likely to become the next target. In the short term, the question will be whether the earnings forecast for the current fiscal year is revised upward. Attention should also be paid to exchange rate trends, raw material price trends, the impact of tariffs, and the direction of investment enthusiasm toward decarbonization.
Table of contents
| Summary | 1 |
| Key financial data | 2 |
| Company overview | 3 |
| Corporate history/Group Overview | 4 |
| Business overview | 7 |
| Coil Market · Our Strengths | 7 |
| Long-term performance trends | 17 |
| SUMIDA CORPORATION Vision to 2035 Mid-Term Business Plan 2026-2028 | 19 |
| Earnings trends | 28 |
| FY12/2025 results | 28 |
| FY12/2026 company forecast and first quarter results | 30 |
| Stock price trends and catalysts | 34 |
| Financial data | 36 |
| Corporate data | 37 |
| Corporate profile/history | 37 |
| The top management/Corporate governance structure | 39 |
| Major shareholders/Shareholder Distribution by Shareholder | 42 |
Key financial data
| Unit: million yen | 2021 | 2022 | 2023 | 2024 | 2025 | 2026 CE |
| Sales | 104,920 | 138,600 | 147,672 | 143,978 | 147,194 | 156,000 |
| EBIT (Operating Income) | 5,669 | 7,983 | 8,829 | 5,633 | 8,084 | |
| Pretax Income | 3,898 | 6,534 | 5,856 | 1,295 | 4,830 | 4,850 |
| Net Profit Attributable to Owner of Parent | 2,629 | 5,099 | 5,064 | 590 | 3,618 | 3,650 |
| Cash & Short-Term Investments | 4,237 | 2,944 | 3,107 | 4,286 | 6,129 | |
| Total assets | 117,725 | 134,846 | 142,786 | 147,766 | 163,656 | |
| Total Debt | 54,763 | 58,546 | 57,198 | 57,975 | 64,023 | |
| Net Debt | 50,526 | 55,602 | 54,091 | 53,689 | 57,894 | |
| Total liabilities | 77,622 | 85,966 | 85,471 | 86,849 | 98,298 | |
| Total Shareholders’ Equity | 38,338 | 46,829 | 55,056 | 58,648 | 62,008 | |
| Net Operating Cash Flow | 600 | 10,566 | 18,343 | 14,928 | 16,457 | |
| Capital Expenditure | 6,737 | 9,174 | 10,914 | 9,005 | 7,347 | |
| Net Investing Cash Flow | -6,712 | -8,174 | -10,702 | -8,834 | -12,886 | |
| Net Financing Cash Flow | 4,751 | -4,130 | -7,782 | -5,268 | -1,958 | |
| Free Cash Flow | -5,212 | 2,362 | 8,539 | 7,068 | 10,224 | |
| ROA (%) | 2.44 | 4.04 | 3.65 | 0.41 | 2.32 | |
| ROE (%) | 7.37 | 11.98 | 9.94 | 1.04 | 6.00 | |
| EPS (Yen) | 96.7 | 187.5 | 167.4 | 17.9 | 109.4 | 110.4 |
| BPS (Yen) | 1,409.8 | 1,722.1 | 1,687.4 | 1,774.6 | 1,875.5 | |
| Dividend per Share (Yen) | 28.00 | 47.00 | 51.00 | 53.00 | 53.00 | 53.00 |
| Shares Outstanding (Million shares) | 27.44 | 27.44 | 32.88 | 33.10 | 33.11 |
Source: Calculated by Omega Investment based on FactSet’s standard criteria, rounded to the nearest whole number.
Company overview
SUMIDA CORPORATION: A global leader opening the future through coil technology
SUMIDA CORPORATION (Securities Code: 6817) has been a global leader in the design and manufacturing of coil-related components and modules for over 75 years since its founding in 1950. The Company leverages its advanced technical design capabilities, cultivated through many years of experience, proprietary manufacturing know-how, extensive versatility in applications, and a robust global production structure, as strengths to develop primarily custom-made contract manufacturing businesses for major customers around the world.
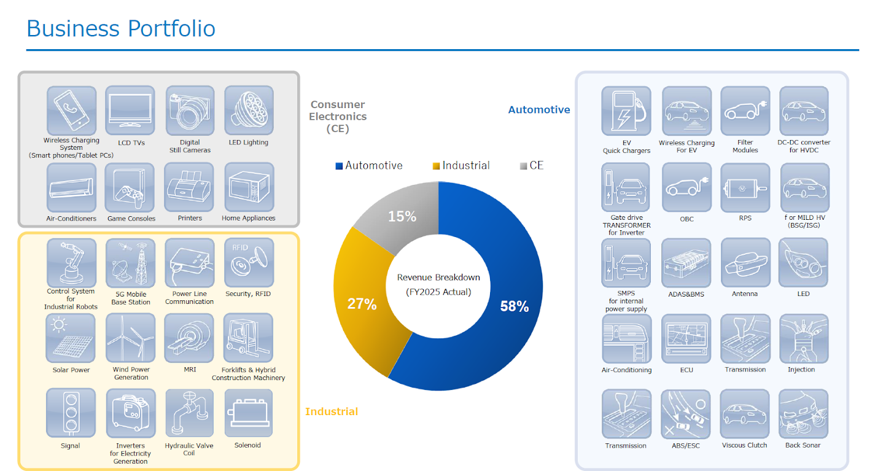
Extensive business portfolio and solid earnings base
The Company’s business is characterized by a well-balanced and diversified portfolio both geographically and by market segment.
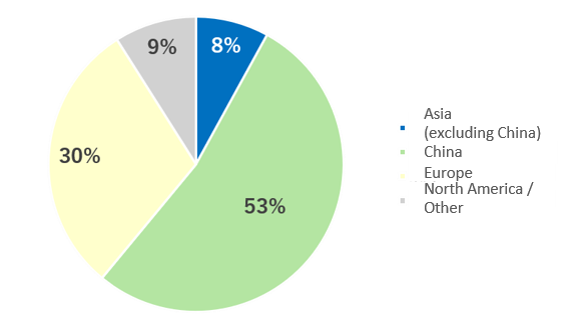
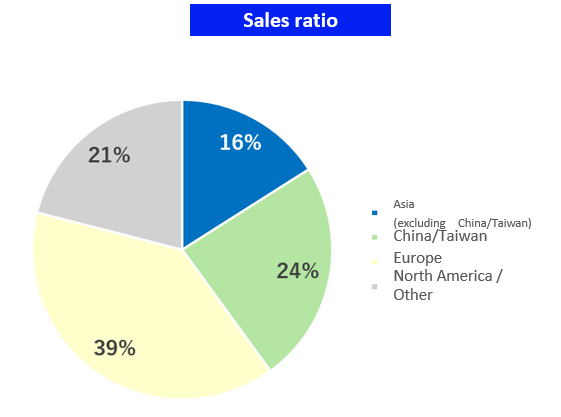
• Revenue composition by region (FY2025 estimate):
Europe: 39%
Greater China: 24%
North America: 21%
Other Asia: 16%
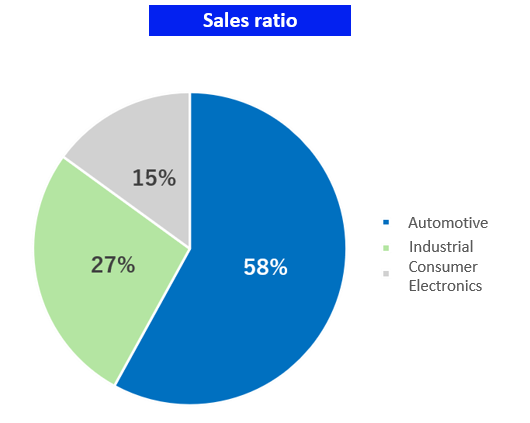
• Revenue composition by market (FY2025 estimate):
Automotive: 58%
Industrial: 27%
Consumer electronics: 15%
This extensive business deployment supports a stable earnings base.
Corporate history
SUMIDA’s journey: A 75-year history and global expansion
SUMIDA CORPORATION originated in 1950, when Ichiro Yawata began manufacturing coils, and was incorporated as a company in 1956. Throughout its long 75-year history, the Company has consistently promoted technological development and application development while actively pursuing global expansion. In particular, the establishment of bases in Hong Kong in 1974 and Singapore in 1987 symbolizes its early international strategy.
In the stock market, the Company was registered as an OTC stock of the Japan Securities Dealers Association in 1988, and listed on the Second Section of the Tokyo Stock Exchange in 1998. It was transferred to the First Section in 2000. It is currently listed on the Prime Market of the Tokyo Stock Exchange. This history is proof that the Company has consistently grown while responding to the trust of the market and society.
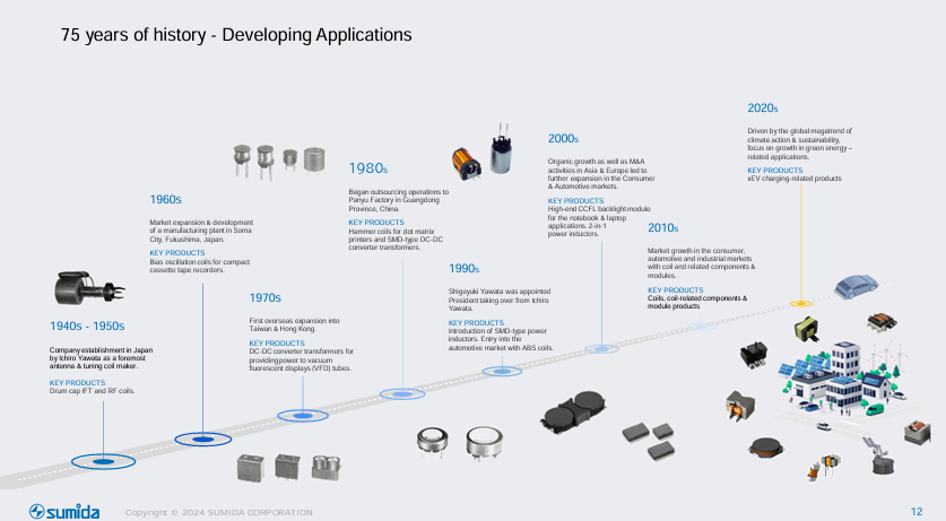
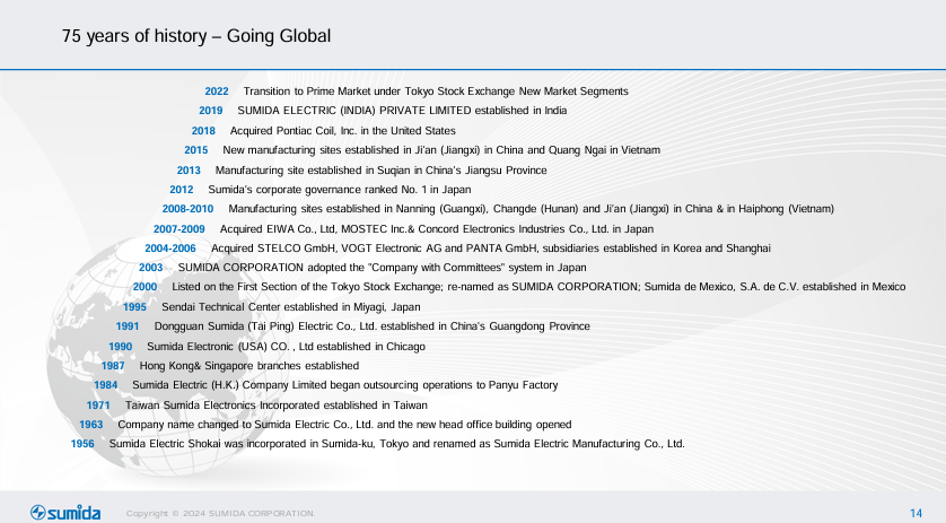
Source: Company materials
SUMIDA CORPORATION: A group structure supporting global expansion
SUMIDA CORPORATION (the Company), as a pure holding company, oversees the entire group and conducts business together with its consolidated subsidiaries in Japan and overseas. The group is based on a production, sales, and R&D structure, and has established two business segments based on geographic divisions: the “Asia Pacific Business” and the “EU Business”. The Company formulates and determines comprehensive strategies for products and services in each region. Under the control and management of the Company’s business activities, each business segment engages in research, development, design, manufacturing, and sales of coil-related components and modules incorporated into electronic equipment for various applications, including automotive, industrial, and consumer electronics.
Business operation based on “Made in Market”
One of the essential principles in the Group’s business operations is the concept of “Made in Market”. This refers to the placement of primary production and development bases in each region, as well as the development, production, and supply of products locally, tailored to meet customer needs in those regions.
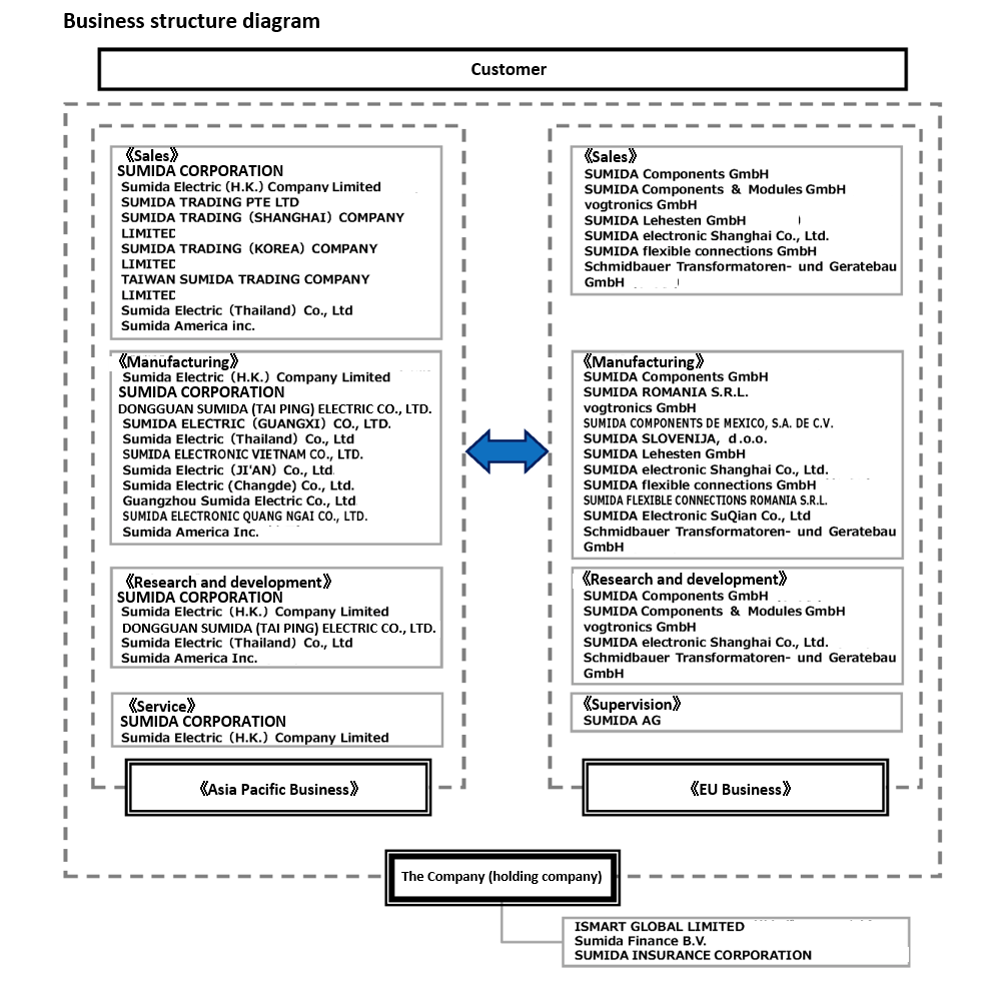
Source: Company materials
The following overview of global bases also indicates that the Made in Market strategy is being promoted.
Global footprint
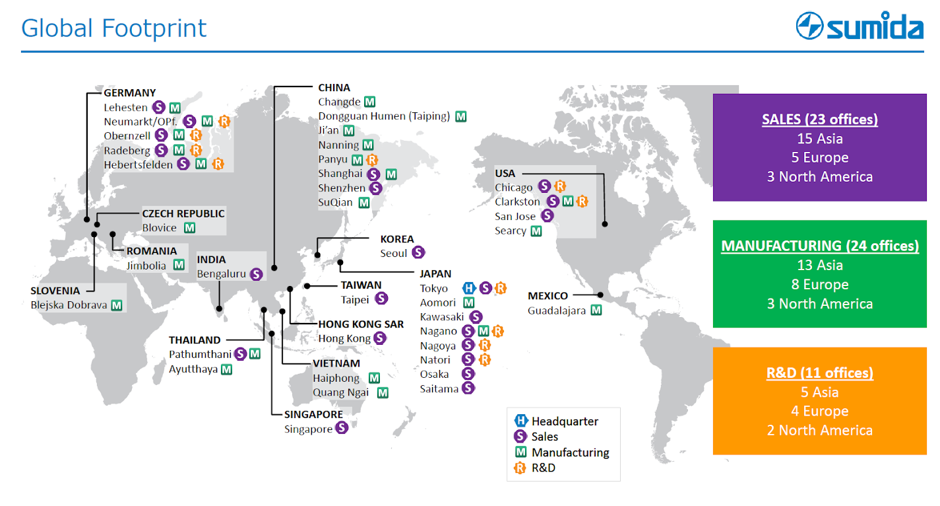
Source: Company materials
Business overview
Coils: Multi-functional components supporting electronics
Coils are fundamental components indispensable to electronics. While they have a relatively simple structure consisting of wires wound into helical or spiral shapes, they possess extremely diverse electrical and magnetic properties.
Their main characteristics are as follows:
- Suppression of current variation (self-inductance effect): Coils generate a voltage (induced electromotive force) in the direction that counteracts changes in the current flowing through them. This self-inductance effect enables the smoothing of rapid current changes.
- Frequency dependence (inductive reactance): In alternating current, the higher the frequency, the greater the extent to which the coil impedes the flow of current (inductive reactance, or the apparent resistance component). This enables selective handling of signals of specific frequencies.
- Magnetic field generation capability: When current flows through a coil, it can generate a strong magnetic field efficiently.
- Energy conversion capability: Coils can temporarily store electric energy as magnetic energy and convert it back into electric energy as needed.
By utilizing these properties in combination, coils in all areas of electronic circuits, coils play a fundamental and broad role in all areas of electronic circuits, such as precise control of current, removal of unwanted noise, selection and processing of specific signals, efficient power conversion, and conversion of electrical energy into mechanical motion.
Product examples
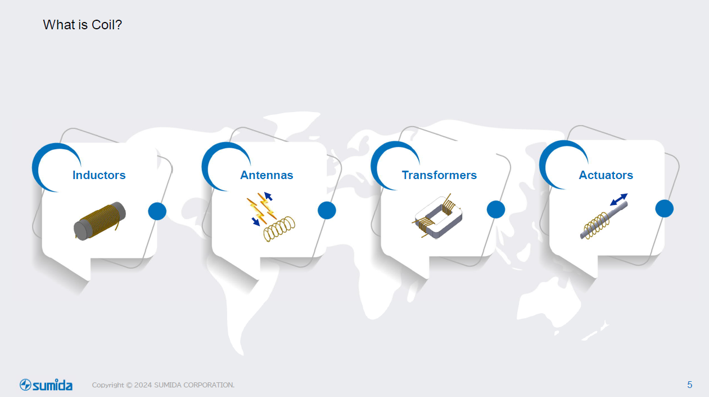
Source: Company materials
Coil market: Market driven by automotive, 5G, AI-related, renewable energy, and automation
Steady market expansion expected
The global market size is estimated at approximately US$15.0 billion, and steady market expansion is expected (a compound annual growth rate of around 6%).
Growth drivers
The following are the main drivers of this growth:
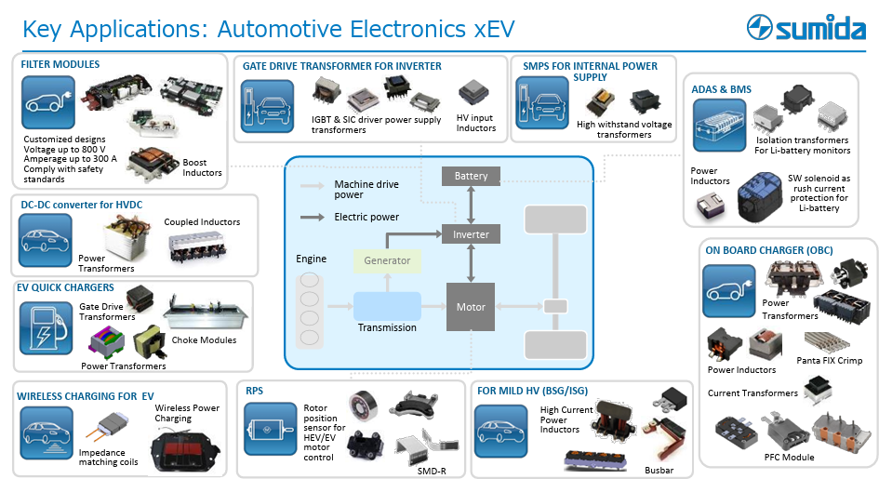
•Advancement in means of transportation, such as automobiles:
Spread of xEVs (electric vehicles): Demand is increasing for highly efficient and reliable coils in onboard chargers (OBC), battery management systems (BMS), and motor drive units.
Advancement of ADAS (Advanced Driver-Assistance Systems): As more electronic components, such as sensors and ECUs (Electronic Control Units advanced driver-assistance systems): As more electronic components, such as sensors and ECUs (electronic control units), are incorporated, demand increases for noise reduction and power stabilization.
Electrification of motorcycles, defense-specialized vehicles, ships, etc.: Demand is increasing due to the electrification of transportation means, including those other than automobiles. Especially in large cars and ships, the Company’s ability to provide customized solutions demonstrates value in terms of handling large-capacity power, durability, stability, and reliability.
- Renewable energy-related: In addition to solar and wind power generators, demand is increasing for infrastructure that stably and efficiently supplies large-capacity electricity.
- Increased demand for AI servers and data centers: Demand is rising for efficient power management and noise control in AI servers and data centers, as well as for highly reliable energy storage installed alongside data centers.
- Spread of 5G technology and increased related devices: Demand is growing due to the spread of 5G-compatible smartphones, installation of 5G base stations, and numerous IoT devices connecting to networks.
- Industrial automation and robotics: As factory automation and the introduction of industrial robots progress, demand is increasing for control and motor drive circuits embedded in these devices. This market tends to grow in conjunction with business sentiment in Chinese manufacturing, as well as the supply-demand trends of major NC machine tool manufacturers.
The Company is also expanding into the medical field, and results are anticipated. In addition, the EU’s recent expansionary fiscal policy aimed at strengthening social infrastructure is also expected to expand the Company’s business opportunities.
Competitive environment and the Company’s position
Many major players are present in the coil market. Among Japanese manufacturers, large corporations such as Murata Manufacturing Co., Ltd., TDK Corporation, TAIYO YUDEN CO., LTD., and KYOCERA Corporation have entered the market, and there are also strong competitors in North America and Greater China. Even in such a highly competitive environment, the Company’s business scale continues to grow steadily. This is a testament to the strong support and trust the Company receives from customers for its custom responsiveness and supply capabilities.
Recognition of the business environment and response policy
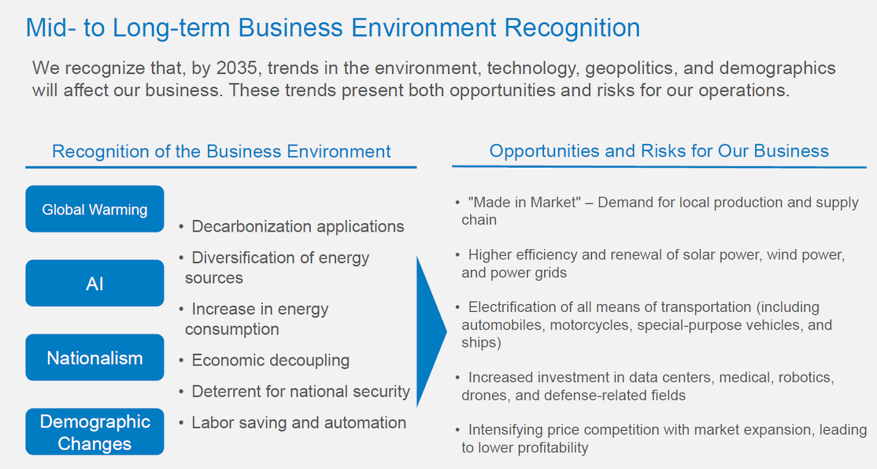
Source: Company materials
SUMIDA CORPORATION’s competitive advantage: A triune strategy of “Technological Capability,” “Versatility in Application,” and “Global Scalability”
SUMIDA CORPORATION, a global leader in the coil industry, has an unwavering strength in the integrated pursuit of the three elements of “Technological Capability,” “Versatility in Application,” and “Global Scalability,” through mutual coordination.
SUMIDA CORPORATION’s strengths
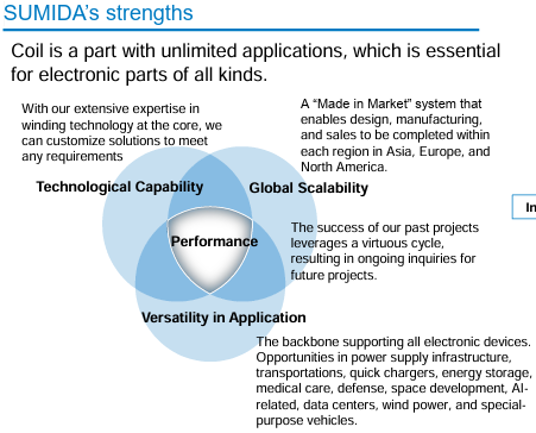
Source: Company materials
Since “Versatility in Application” and “Global Scalability” have already been confirmed, let us now examine the Company’s outstanding “Technological Capability,” which serves as the foundation for realizing these advantages.
Technological capability: Eight elemental technologies centered on winding technology
The foundation supporting the aforementioned “Versatility in Application” and “Global Scalability” is the Company’s outstanding “Technological Capability,” which consists of the following eight elemental technologies centered on winding:
- Winding
- Material
- Design & Application
- Production Engineering
- Precise Processing
- Connection
- Molding technologies
- Evaluation & Testing
The Company’s strength lies in the “Combined Technologies” that arise from the integration of this wide range of elemental technologies. By fully utilizing this “Combined Technology,” the Company promotes technologically driven, innovative design and manufacturing, serving as the driving force behind the continuous supply of custom products that meet the complex demands of a diverse range of customers.
Eight elemental technologies
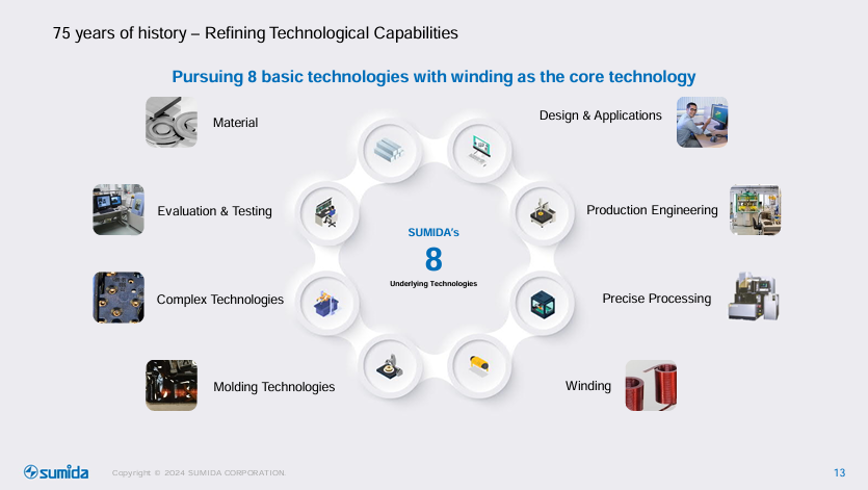
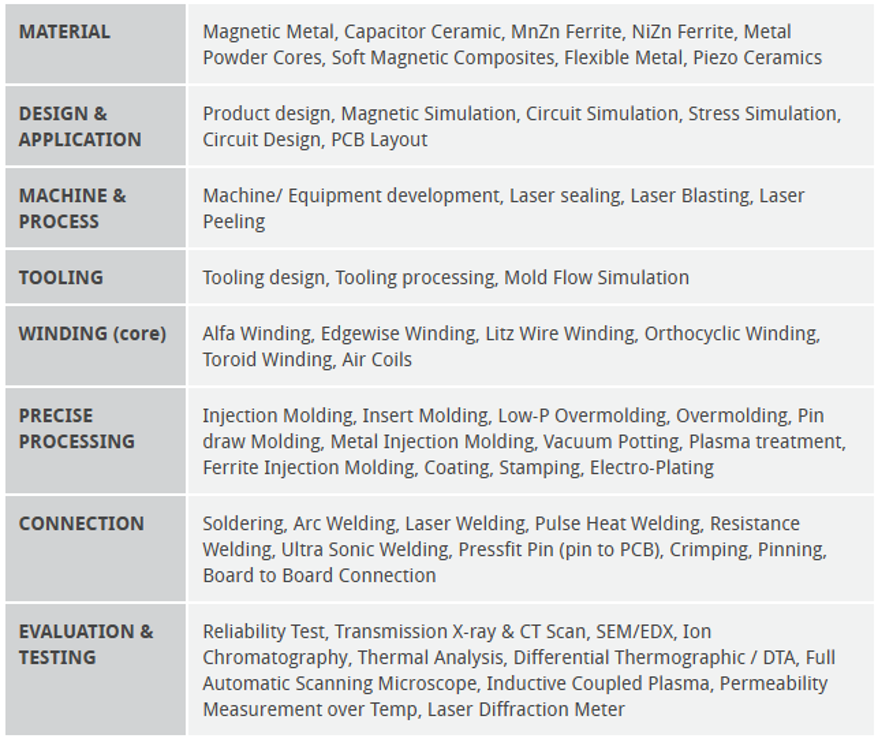
Source: Company materials
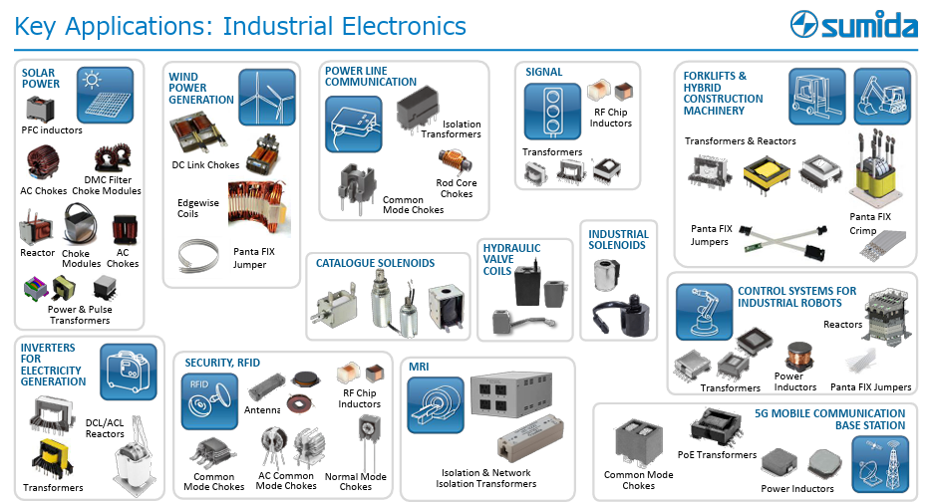
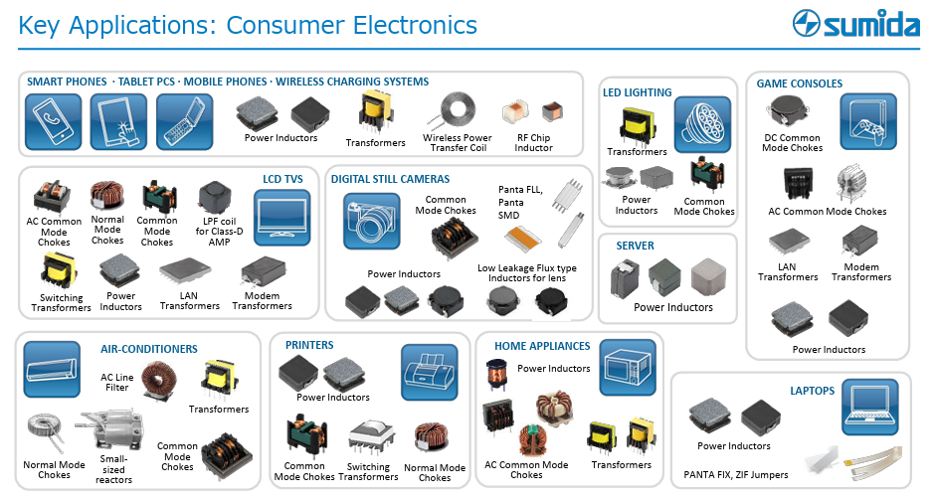
SUMIDA CORPORATION’s key products: High-value-added solutions covering a wide range of applications
By fully leveraging its outstanding versatility in application, the Company handles a wide variety of products. The Company’s key products include the following high-performance electronic components and modules:
・Electronic components and module products:
Power inductors: Core components that contribute to power circuit stabilization and efficiency improvement.
Transformers: Various types of transformers are used for voltage conversion and insulation.
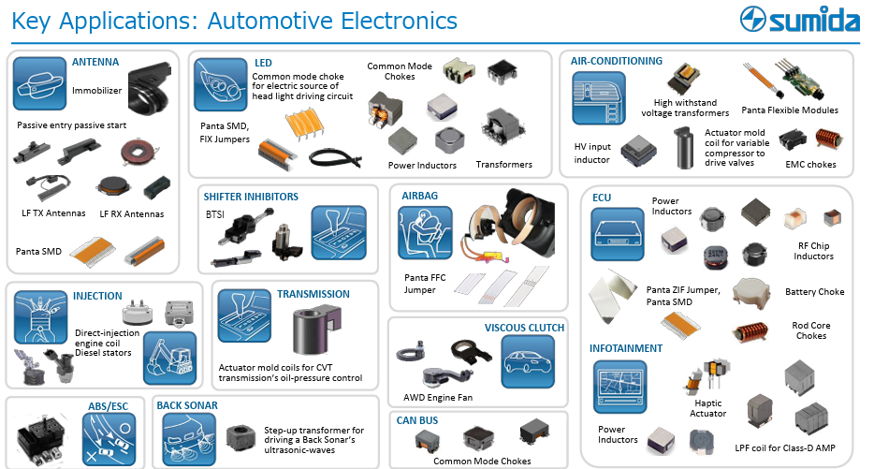
•Automobile-related products:
Keyless entry antennas for automobiles: Antennas used in innovative entry systems.
Xenon igniters: Components that control the lighting of HID lamps.
•Telecommunications and IoT-related products:
Components for mobile communication devices: Various components are incorporated into smartphones and other devices.
RFID tags: Tags supporting contactless communication technology.
•Energy and industrial-related products:
Components for power inverters for solar power generation: Support efficient power conversion. •Components for industrial lighting equipment:
Components embedded in lighting systems for industrial sectors.
In addition to these key products, the Company also provides electronic materials and components, including magnetic materials, ceramics, and flexible connectors, as well as EMS (electronics manufacturing services), fulfilling its role as a comprehensive solution provider that meets the diverse needs of its customers.
Key products
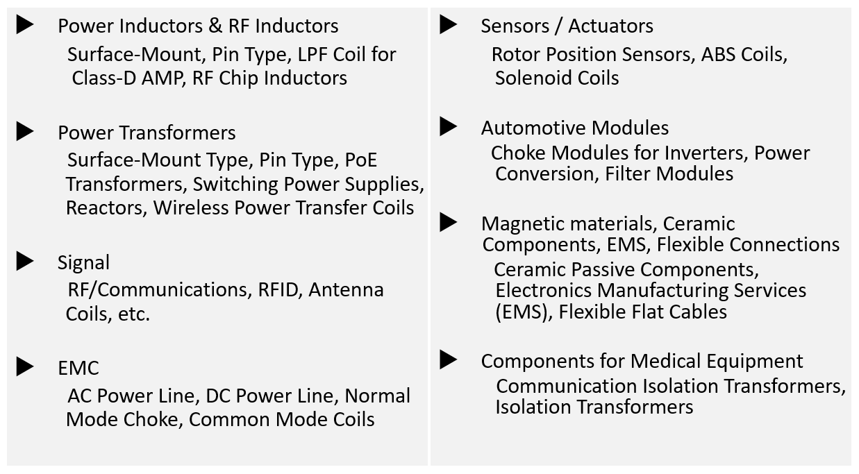
Source: Company materials
We next confirm the breadth of product offerings by strategic focus area.
Key product groups by strategic focus area
Source: Company materials
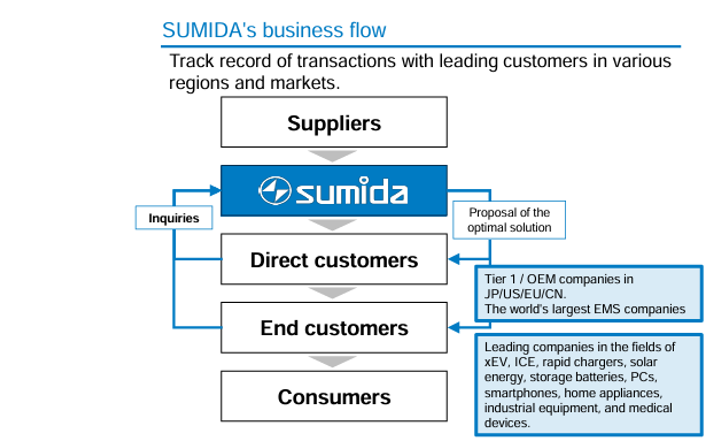
SUMIDA CORPORATION’s business model: Custom product proposals and project acquisition as a leading indicator
A characteristic of the Company’s business model is that it actively proposes high-value-added custom products and connects them to orders. The flow of acquiring custom product projects is as follows:
Flow of the custom product project acquisition
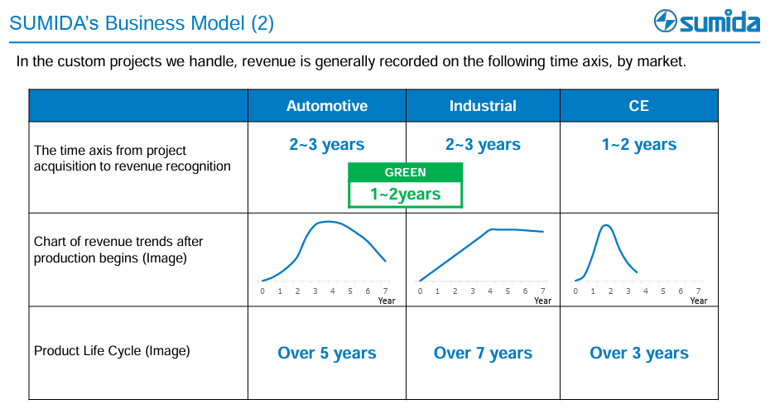
Time axis of business development and the importance of leading indicators
A crucial aspect of understanding the Company’s business development is that, from project acquisition to actual revenue recognition, each product market has its own unique lead time. In addition, once production has started. Furthermore, even after production has begun, there is a unique time frame for sales revenue trends depending on the product market.
Trends in custom product orders from acquisition to revenue recognition by product market
Source: Company materials
Viewed differently, this characteristic means that the trend in current project acquisition value serves as a strong leading indicator of the Company’s revenue trends several years ahead. Therefore, in forecasting the Company’s performance, particular attention is paid to the trend of newly acquired projects. This also reflects the fact that the Company is not simply supplying parts, but is deeply involved in the customer’s product development cycle from an early stage, building long-term partnerships.
Segment structure
The Company’s reportable segments by region are as follows (FY12/2025; revenue refers to revenue from external customers).
•Asia Pacific Business
Revenue of 92.36 billion yen and segment profit of 4.75 billion yen
•EU business
Revenue of 54.83 billion yen and segment profit of 3.40 billion yen
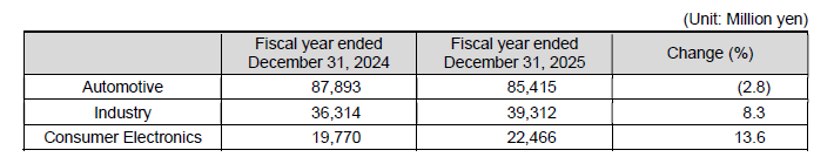
In IR materials, details by region and application market are disclosed. The composition by application market is classified into the Automotive, Industrial, and Consumer Electronics markets, and the revenue composition of these markets is as follows.
Revenue composition by market (FY2025)
Source: Company materials
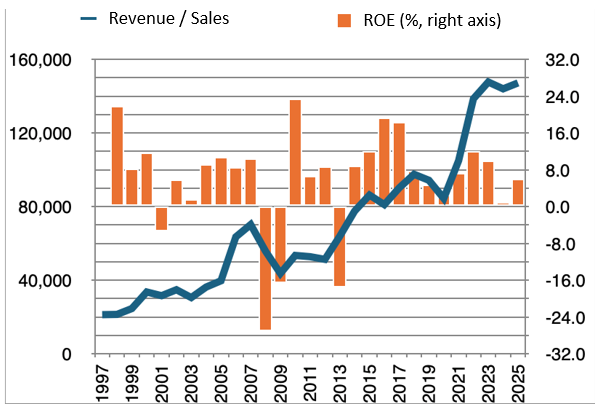
Long-term performance trends
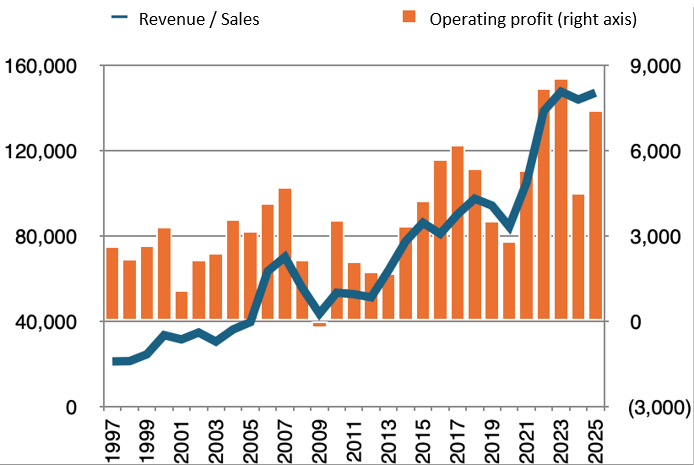
To analyze the mid-term business plan currently being promoted, a review of the Company’s long-term performance trends is provided. Below are the performance trend data from FY1997 through FY2025 (fiscal year ending December 2025), with amounts in millions of yen. Although the accounting standard transitioned from Japanese GAAP to IFRS in FY2017, the figures are presented as-is for the sake of analytical continuity.
From this long-term data, the following key points can be observed:
Positive aspects: Sustainable growth orientation and establishment of a profit base
•Strong growth orientation and revenue expansion: Over time, the Company has expanded its assets through aggressive capital investments and M&A and has continued to grow revenue (net sales) accordingly. This indicates the Company’s clear growth strategy and ability to respond to the market.
Long-term performance trends
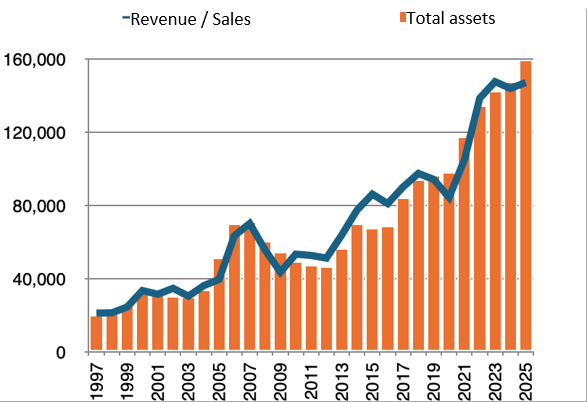
•Cyclical growth in operating profit: Except for FY2009, the Company has consistently remained profitable. Although there are fluctuations from year to year, overall, the Company has maintained a steady growth trajectory and established a “Cyclical Growth” model, continuing to grow despite being affected by economic fluctuations.
Challenges: Focus on improving profitability and capital efficiency
EBITDA margin has remained stable, but there is room for improvement in the operating profit margin: The EBITDA margin has generally been maintained in the 10% range, which is a favorable sign of the stability of cash flow generated by the business. However, the operating profit margin has remained around 5% over the past 10 years, lower than in earlier periods. One factor is that an increase in depreciation and amortization associated with aggressive growth investments has negatively impacted the operating profit margin. Going forward, if the Company can maintain the operating profit margin in the 5-10% range through optimized pricing policies and rigorous cost control, its earnings structure would become even more desirable.
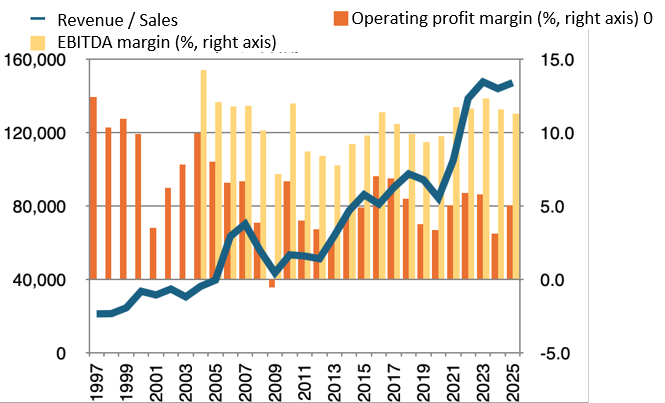
Large volatility in ROE: While the cost of equity recognized by the Company is 9%,ROE (return on equity) through FY2025 is 8.9% on a 10-year average and 7.3% on a most recent five-year average. Therefore, based on this long-term average, the Company is meeting shareholders’ expectations, but on the most recent five-year average, it does not meet the required level. Moreover, the range of fluctuation is large (for example, from 12% in FY2022 to 1.0% in FY2024), and investors have no choice but to consider this high volatility as a risk factor. The Company has diversified its sales destinations across the Automotive, Industrial, and Consumer Electronics markets, but it cannot avoid the impact of demand fluctuations for each end product, making it difficult to eliminate volatility in ROE. However, if, as noted above, the Company can raise its operating profit margin, the average ROE should also rise, and, as a result, the degree of risk attributable to ROE volatility should decline. Therefore, when looking at the Company’s Mid-Term Business Plan, how effectively it is taking measures to address these profitability and capital efficiency issues is an important evaluation point.
Source: Company materials, Factset
SUMIDA CORPORATION Vision to 2035 Mid-Term Business Plan 2026-2028
SUMIDA CORPORATION Vision to 2035 Mid-Term Business Plan 2026-2028
On February 7, 2024, the Company announced its “New Mid-Term Business Plan (2024-2026)”. Subsequently, although prospects for achieving the ESG targets became clear, changes in the business environment caused the FY2026 financial targets set out in the Mid-Term Business Plan to diverge from actual conditions. For this reason, on February 9, 2026, the Company announced “Vision to 2035”, which outlines the Vision it aims to achieve in 2035, as well as the “Mid-Term Business Plan 2026-2028”. Rather than viewing this as indicating that its recognition of the business environment was optimistic, we would like to take it positively as evidence of the Company’s resilience in swiftly revising management’s direction in response to environmental changes.
Review of the previous Mid-Term Business Plan
In the previous Mid-Term Business Plan, the Company positioned green energy-related fields as a pillar of growth and expected substantial increases in revenue and profit. However, from the beginning of 2024, the first year of the plan, the market environment changed rapidly due to factors such as the end of EV subsidies in Europe and changes in U.S. environmental policy. Because this occurred at a stage when the break-even point had risen due to increases in production facilities and personnel for expansion, project delays and a slowdown in demand ultimately put pressure on earnings.
In response to these environmental changes, the Company has taken countermeasures by improving the break-even point and diversifying revenue sources, proceeding with headcount reductions in Europe and China, focusing on acquiring Industrial-related projects, and, in October 2025, further acquiring Schmidbauer, which complements the Industrial domain.
Trends in the financial targets and results of the Mid-Term Business Plan
Source: Company materials
Vision to 2035
The Company has set its Vision to 2035 as “Top Position in Multiple Niches”.
This is not only an attempt to grow with megatrends as tailwinds, but also to build footholds in higher-value areas and raise earning power over the long term. The growth strategy has become clearer than in the previous Mid-Term Business Plan.
2035 outlook for product applications
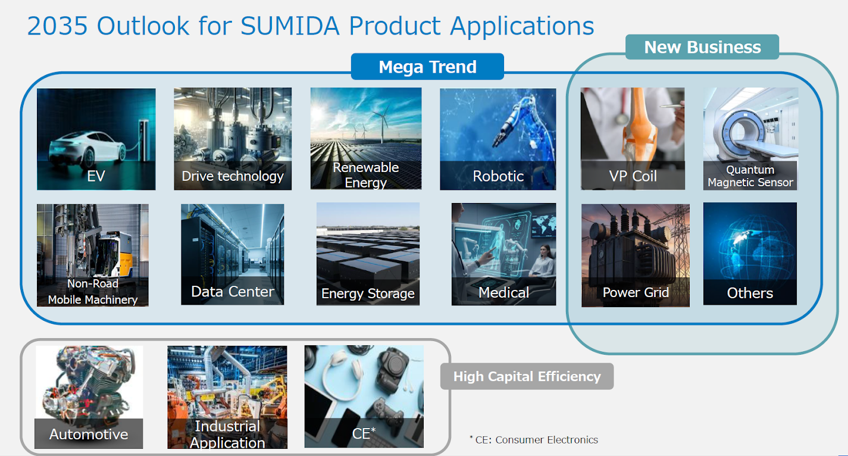
Source: Company materials
Overview of the Niche-Top Strategy
To realize its Vision, the Company plans to promote the “Niche-Top Strategy”, which consists of three layers, and its key points are as follows. Put simply, it is a well-balanced strategy comprising defensive reinforcement focused on capital efficiency and cash-generation capability, offensive initiatives that leverage megatrends as tailwinds, and initiatives in new businesses that represent seed planting for long-term positioning improvement.
From the perspective of share price formation, the key points of each strategy are linked to the effect of supporting earnings (reduction in earnings volatility and an effect of reducing the cost of capital), expectations for medium-term earnings expansion (expectations for EPS growth), and raising long-term growth potential (an effect of expanding PER).
Niche-Top Strategy
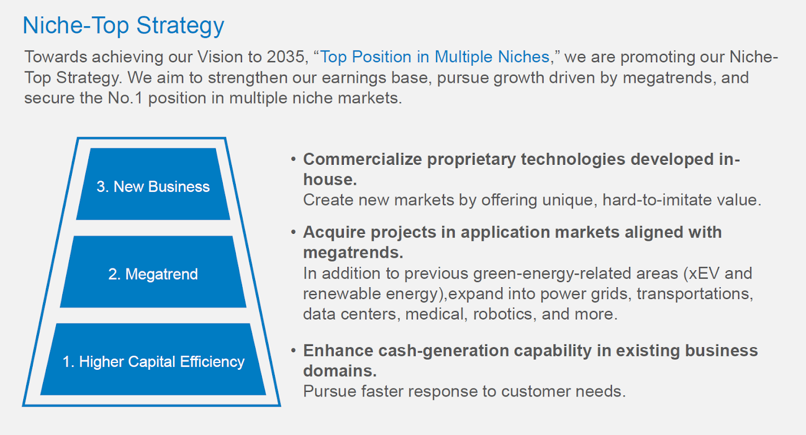
Source: Company materials
Regarding New Business, two initiatives are currently being presented. Although both are expected to require lead time, if successful, expectations are high that they will lead to greater earnings stability and a higher earnings level.
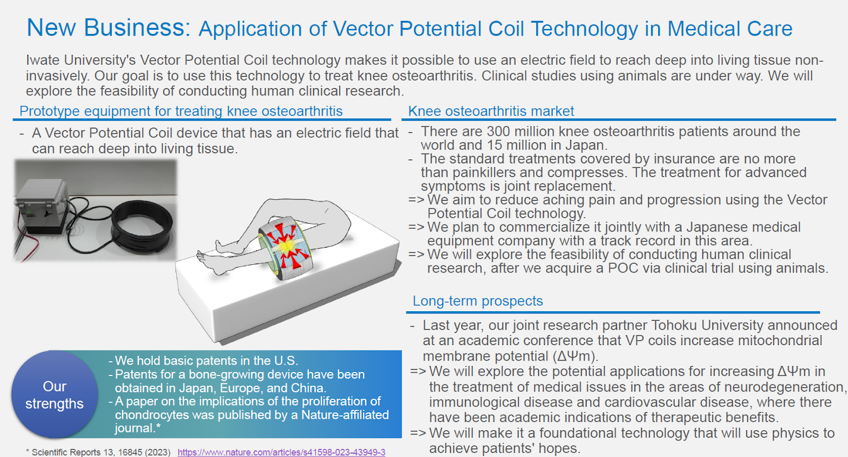
New Business: Application of VP Coil technology in medical care
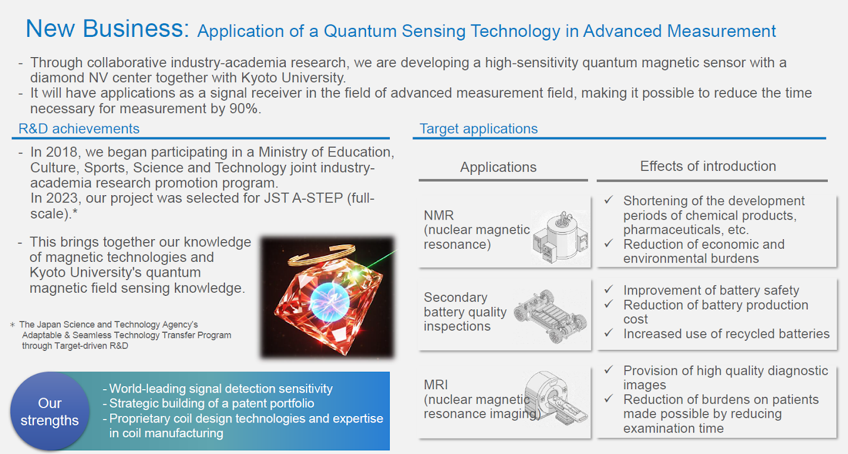
New Business: Application of quantum sensing technology in advanced measurement
Source: Company materials
SUMIDA CORPORATION Vision to 2035 Mid-Term Business Plan 2026-2028
Mid-Term Business Plan 2026-2028
Next, we look at the “Mid-Term Business Plan 2026-2028”.
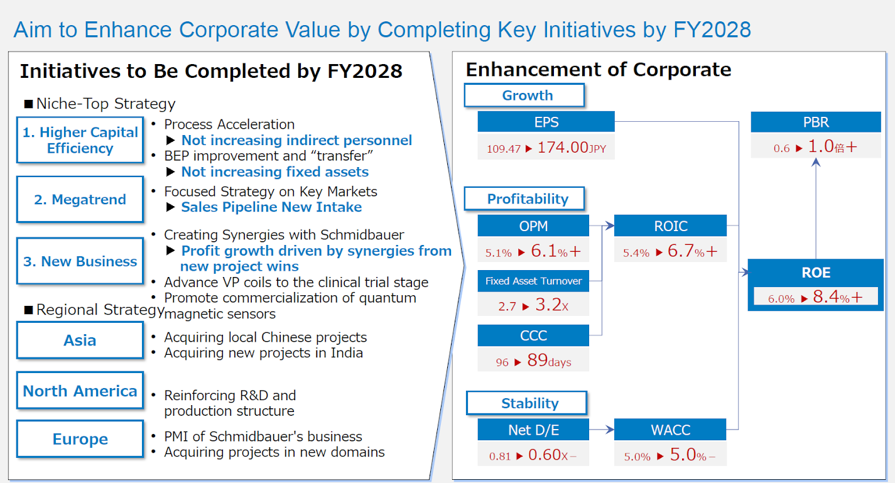
The numerical targets are as follows: over three years, the Company aims to increase revenue by 12%, operating profit by 35%, EPS by 59%, and ROE by at least 2.4 percentage points.
The points are likely to be
· a plan for higher revenue and profit that is conscious of profit margins
· aiming for ROE exceeding 8%
In the initial announcement of the Mid-Term Business Plan, the Company set ROIC as the KPI for capital efficiency and set a target to raise it from 5.4% in FY2025 to 6.7% in FY2028. However, in the announcement of the FY2026 first-quarter results, the KPI was changed from ROIC to ROE. This is the Company’s response to investors’ expectations for PBR improvement and shows the Company’s strong commitment to its share price.
Mid-Term Business Plan 2026-2028 NumericaltargetsintheMTBP2028
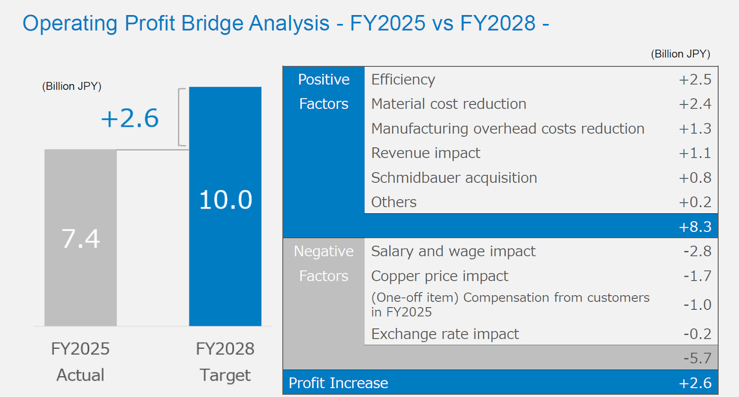
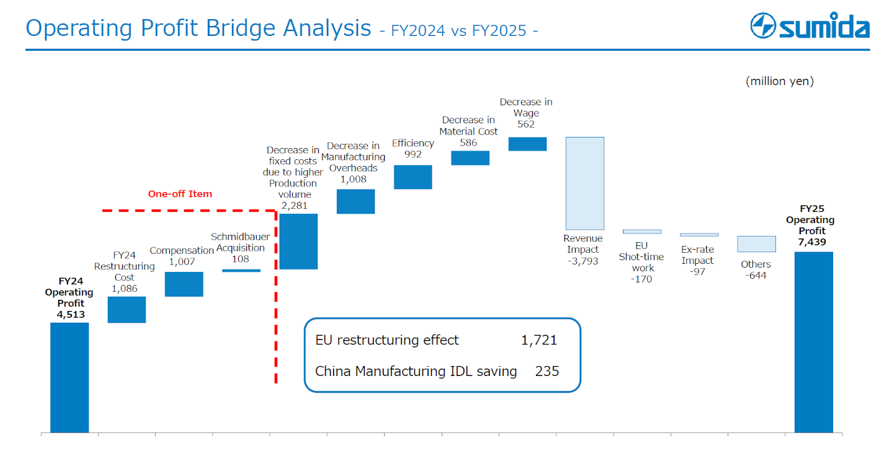
The factors behind changes in operating profit are as follows. This is an ambitious plan that aims to achieve profit growth after covering wage increases and the risk of rising copper prices through cost control, revenue growth, M&A, and other factors.
Mid-Term Business Plan 2026-2028 Operatingprofit bridge analysis
Source: Company materials
The business measures in the new Mid-Term Business Plan are as follows.
The specific measures of the Niche-Top Strategy described above are listed. The first, High Capital Efficiency, is an extension of the Company’s previous initiatives, and the second, Megatrends, can generally be understood as a revision of the thinking in the previous Mid-Term Business Plan, in line with current conditions.
The points to watch are the following two.
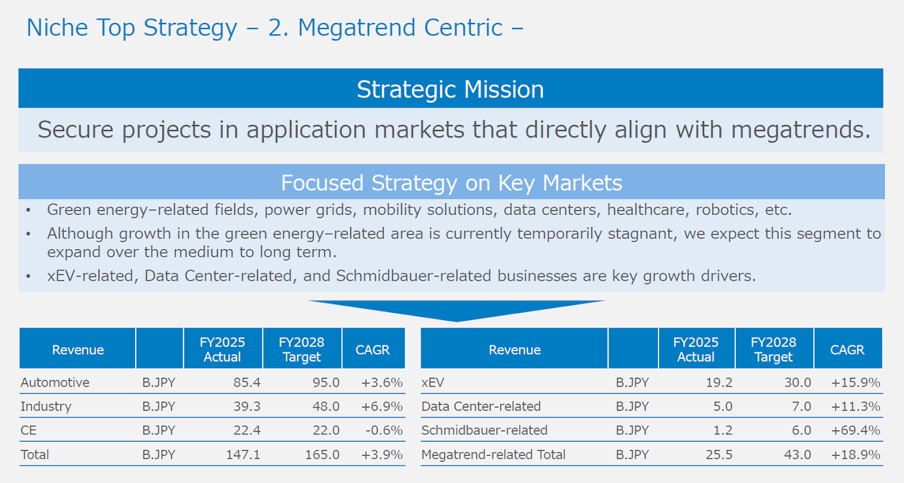
First, in Megatrends, xEV-related, data center-related, and Schmidbauer-related areas are important growth drivers. In xEV-related areas, signs of recovery are emerging amid heightened geopolitical risks, surging energy prices, and lower production costs. In data center-related areas, infrastructure demand is increasing as AI is implemented in society. In this way, the fact that multiple different megatrends will act as tailwinds is considered to increase the likelihood of the Company’s growth story.
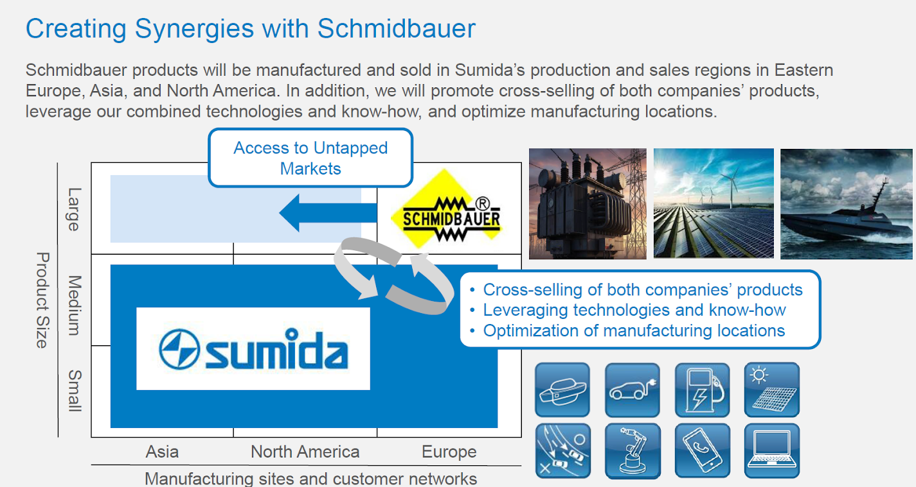
Second, in New Business, the focus is on maximizing synergies with Schmidbauer, which the Company acquired last year. Schmidbauer specializes in the development, manufacture, and sale of products focused on large coils for high-power applications, including drive technology, renewable energy, railways, and defense, and there is little overlap with the Company in terms of products and customers. As a result, after the acquisition, the Company has become able to make a wide range of proposals to the customer bases of both companies. Furthermore, when Schmidbauer’s European customers expand their business in China and the U.S., they can leverage the Company’s global Made in Market production and sales structure, making it easier to achieve profitability for new projects. In this way, synergies appear easy to generate, and expectations are high for this to become a driver of earnings.
Niche-Top Strategy: High Capital Efficiency
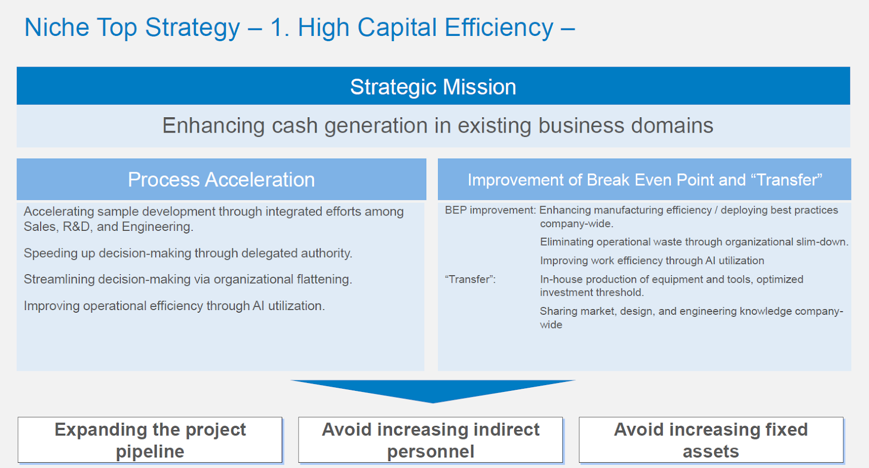
Source: Company materials
Niche-Top Strategy: Megatrend
Source: Company materials
Niche-Top Strategy: New business
Niche-Top Strategy: Regional strategy
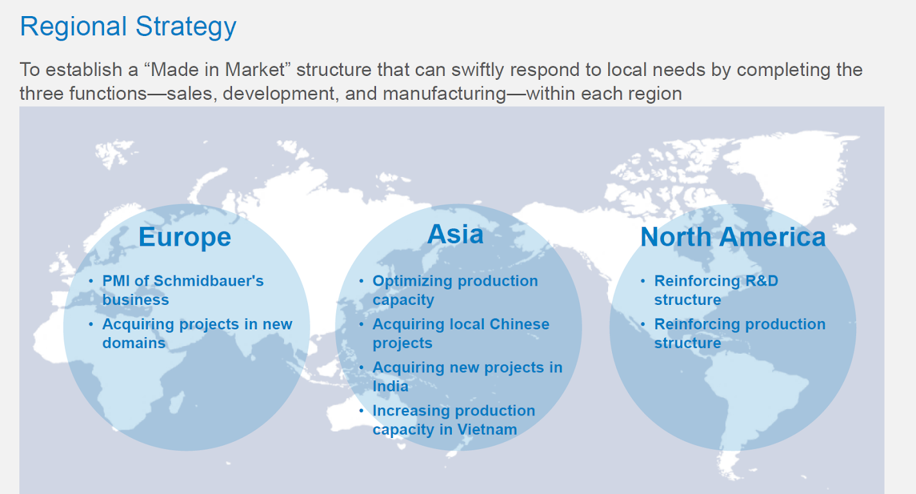
Source: Company materials
The financial measures in the new Mid-Term Business Plan are as follows.
Capital allocation, dividends, and a roadmap for enhancing corporate value are presented, with an emphasis on “growth orientation,” “cash-consciousness,” and “achieving PBR of 1x or more.”
Capital allocation
The plan is to generate cumulative operating cash flow of 49.0 billion yen over three years (the same level as the cumulative total over the past three years), allocate more than 20.0 billion yen first to growth investment, then implement investment in existing facilities and other areas up to around 8.0 billion yen, and generate free cash flow of 23.0 billion yen (compared with 17.3 billion yen cumulatively over the past three years).
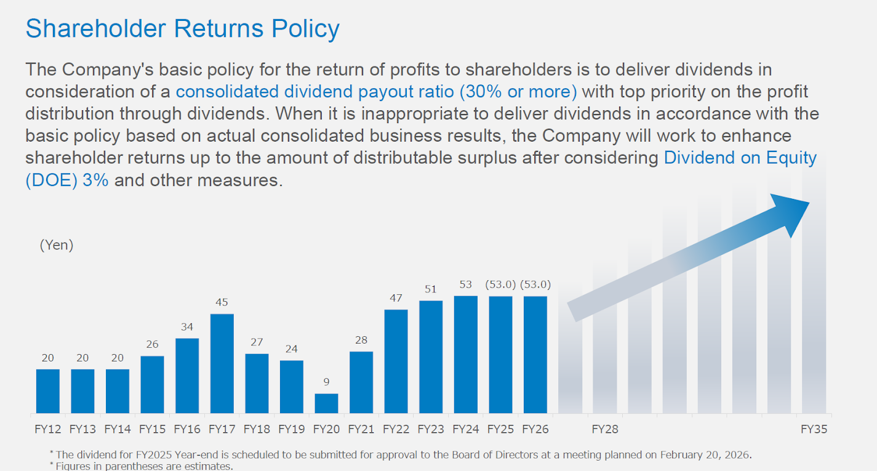
This free cash flow is scheduled to be allocated to shareholder returns and strengthening the financial position. In line with the dividend policy revised in 2025, the Company plans to pay dividends of 6.0 billion yen and, at the same time, proceed with debt reduction of around 10.0 billion yen, thereby securing financial strength for the next large-scale growth strategy, such as M&A.
Capital allocation
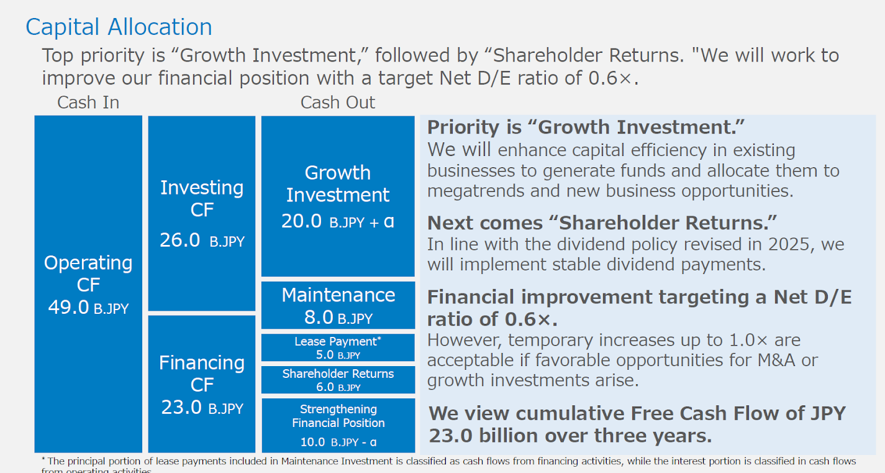
Shareholderreturns policy
Source: Company materials
Roadmap for enhancing corporate value
The roadmap showing the impact of the above measures on the share price is as follows. Simply put, the aim is to steadily improve ROE to 8% or higher and establish a PBR of 1x or higher.
Roadmap for enhancing corporate value
Source: Company materials
Earnings trends
FY12/2025 results: outperformance versus company forecast and solid project wins
The FY12/2025 full-year results the Company announced on February 6, 2026, exceeded the Company’s forecast and showed increases in both revenue and profit. Full-year revenue was 147.19 billion yen (up 2.2% YoY), operating profit was 7.44 billion yen (up 64.8% YoY), profit before income taxes was 4.83 billion yen (up 272.9% YoY), profit attributable to owners of the parent was 3.62 billion yen (up 512.4% YoY), basic earnings per share were 109.47 yen, and the annual dividend was 53 yen.
The key points of these results are as follows.
First, even in a business environment with a high degree of uncertainty, full-year revenue increased through both internal and external growth, and the effects of cost-structure reforms became evident.
On the revenue side, although demand softened in some areas such as automotive-related products, xEV rapid-charging infrastructure-related products, and solar power generation, the Company’s wide-ranging customer base and “Made in Market” global supply network underpinned revenue. Furthermore, the Company promptly acquired Schmidbauer, which is highly complementary to the Company in terms of products and supply structure, and achieved full-year revenue growth.
Source: Company materials
Operating profit, excluding temporary factors, increased by 720 million yen for the full year, reflecting the results of cost structure reforms. The effects of business structure reform in Europe, the optimization of production capacity in China, and the reduction in manufacturing overhead costs in China exceeded the negative impact of revenue-decreasing factors, thereby improving profitability. It can be said that the earnings structure has become more muscular. The impact of foreign exchange gains and losses was limited.
Source: Company materials
Second, the balance sheet and cash flow can be regarded as sound. The Net D/E ratio is 0.81x, and the cash conversion cycle of 96 days is almost flat YoY in both cases. Inventory turnover days are 87, up 2 days YoY, warranting attention. Free cash flow was positive at 3.57 billion yen despite the large-scale acquisition.
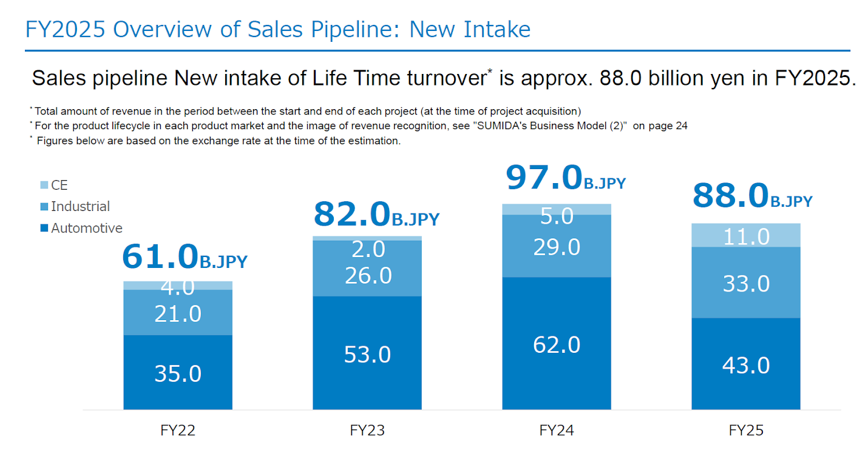
Third, the trend in the amount of acquired projects, a leading indicator of the Company’s medium- to long-term earnings performance, is favorable. In FY12/2025, the Company acquired new projects totaling approximately 88.0 billion yen. Although this is below the 97.0 billion yen in FY12/2024, it is larger than the 82.0 billion yen in FY12/2023. Looking at the breakdown, the pause in automotive-related areas has been successfully covered by increases in Industrial and Consumer Electronics.
Trends in Acquired Projects
Source: Company materials
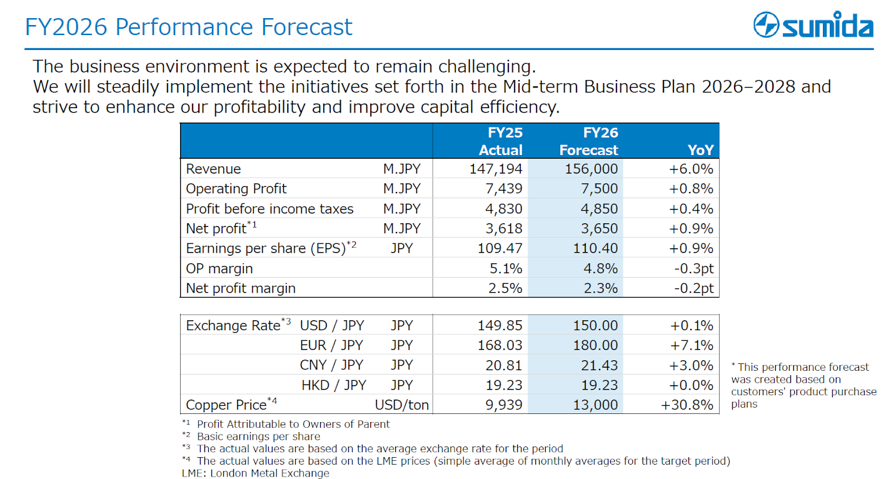
FY12/2026 company forecast and first-quarter results:
We look at the FY12/2026 consolidated earnings forecast presented at the time of the FY12/2025 results announcement. There was no revision to the full-year forecast in the announcement of FY12/2026 first-quarter results.
Although it is a plan for revenue growth, it forecasts a slight increase in profit because uncertainty remains in the business environment, and the temporary positive profit factors that arose in FY12/2025 will disappear.
FY12/2026 consolidated company earnings forecast
· Revenue: 156.00 billion yen (up 6.0% YoY)
· Operating profit: 7.50 billion yen (up 0.9% YoY)
· Profit before income taxes: 4.85 billion yen (up 0.4% YoY)
· Profit attributable to owners of the parent: 3.65 billion yen (up 0.9% YoY)
· EPS: 110.40 yen (up 0.9% YoY)
· Dividend per share: 53 yen (flat YoY)
· Operating profit margin: 4.8% (down 0.3 percentage points YoY)
· Capital expenditures: 6.8 billion yen (up 9.1% YoY)
FY12/2026 company forecast
Source: Company materials
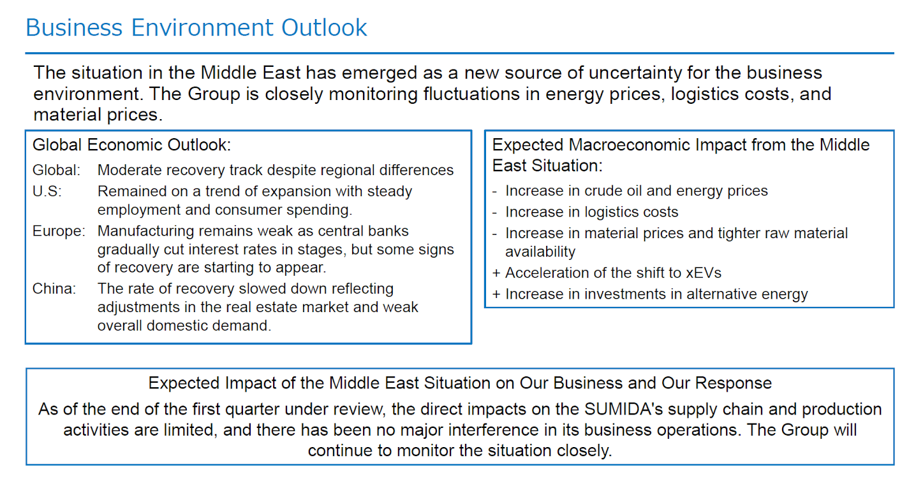
The recognition of the business environment is as follows (the latest recognition in the first quarter is presented). While uncertainty regarding energy, logistics costs, and material prices has increased due to the situation in the Middle East, positive factors such as the recovery of the xEV shift, alternative energy investment, and AI investment are also emerging. However, the recognition that the business environment cannot be viewed optimistically is reasonable.
Business environment outlook
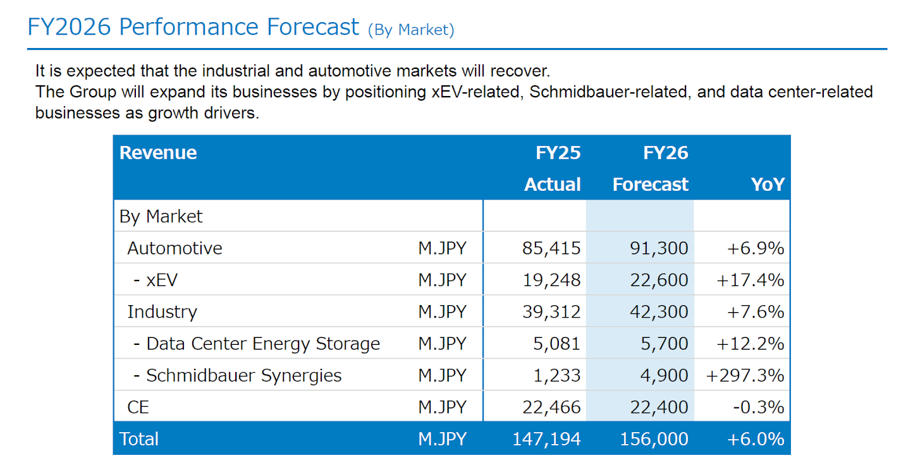
According to the revenue forecast by market, growth is assumed in automotive-related areas, especially xEV-related areas that have begun to recover in Europe, as well as in data center-related and Schmidbauer-related areas in the Industrial market.
Revenue forecast by market
Source: Company materials
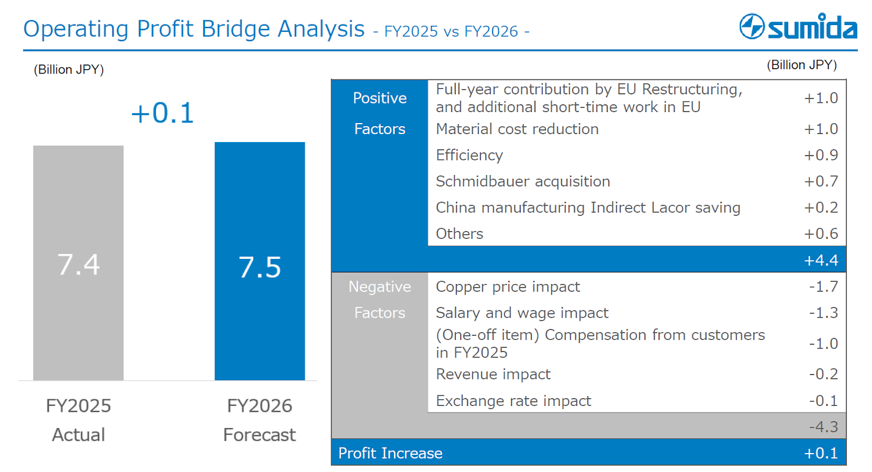
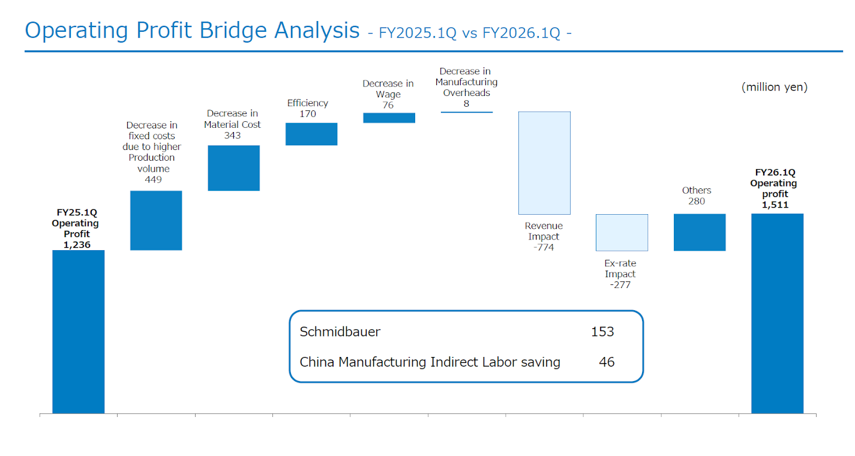
Full-year operating profit is forecast to increase by 0.1 billion yen YoY; however, after accounting for 1.0 billion yen in compensation received from customers in the previous fiscal year, the underlying increase is 1.1 billion yen.
This is based on the assumption that positive factors such as the effects of business structural reform in Europe, raw material costs, improvements in production efficiency, M&A effects related to Schmidbauer, and optimization of manufacturing overhead costs in China will exceed cost increases such as rising copper prices and higher wages.
Factors affecting operating profit
Source: Company materials
Capital expenditures are planned at 6.8 billion yen and are expected to be directed toward new products, capacity expansion, and productivity improvement.
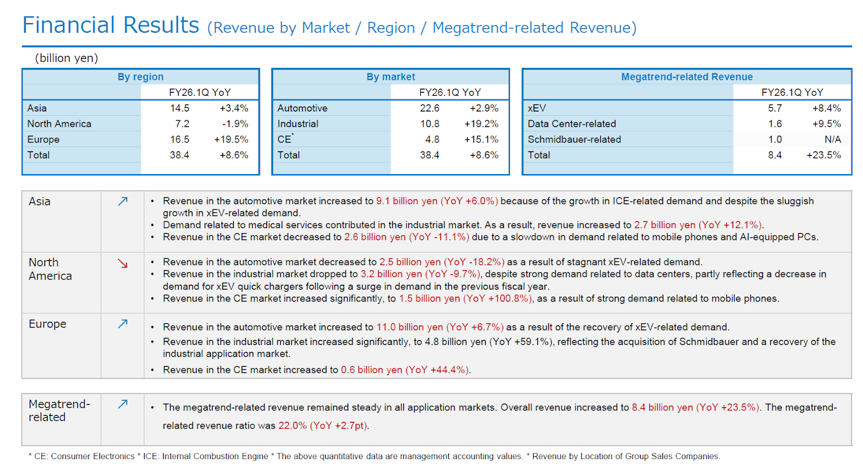
FY12/2026 first-quarter results: a solid start
The first-quarter consolidated results announced on April 30, 2026, were strong results with higher revenue and profit. Schmidbauer’s inclusion in the Group and strength in xEV-related areas in Europe contributed to revenue growth, and data center-related areas also trended higher. On the profit and loss side, profitability continued to improve, partly due to fixed cost reductions resulting from business structural reform. There were no significant changes in the balance sheet.
FY12/2026 first quarter:
· Revenue: 38.43 billion yen (up 3.03 billion yen YoY, up 8.6% YoY)
· Operating profit: 1.51 billion yen (up 0.28 billion yen YoY, up 22.2% YoY)
· Profit before income taxes for the quarter: 0.90 billion yen (up 12.2% YoY)
· Profit attributable to owners of the parent for the quarter: 0.73 billion yen (up 24.0% YoY)
· Impact on earnings from Schmidbauer: an increase of approximately 1.0 billion yen in revenue and approximately 0.15 billion yen in operating profit.
Revenue Trends
Operating profit bridge analysis
Source: Company materials
Stock price trends and catalysts
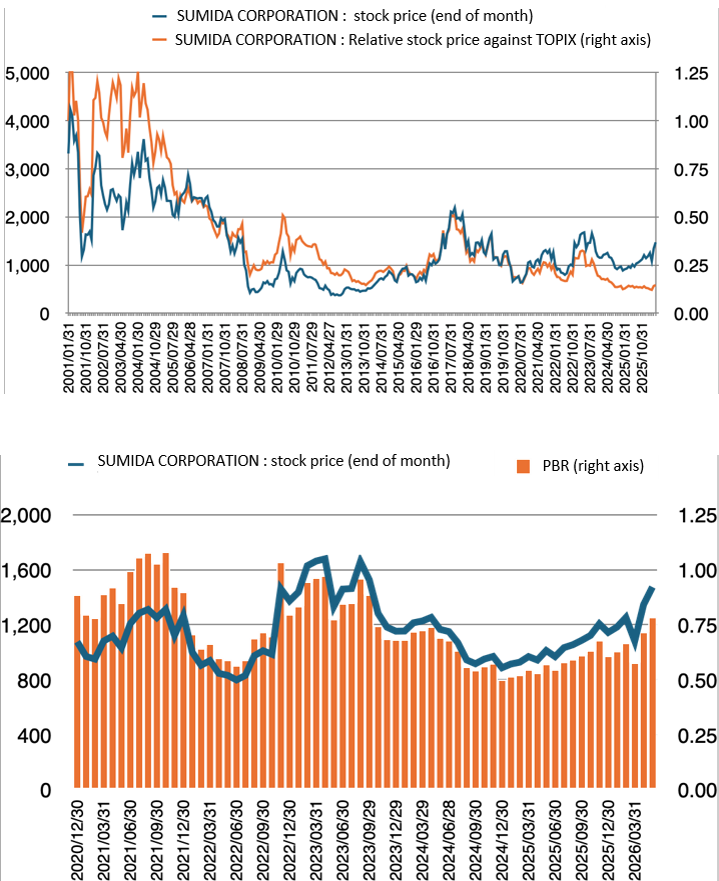
Stock price trends: the share price has recovered to the resistance line of the long-term symmetrical triangle pattern
The Company’s share price was relatively high in the 2000s, but over the past 10 years, it has formed a so-called symmetrical triangle pattern within a range, with a lower bound around 700 yen and an upper bound above 2,000 yen. Since March 2026, the share price has risen, and it is now approaching the resistance line of the symmetrical triangle pattern in place since 2017.
In line with this, PBR has also recovered to the 0.8x range.
Expectations for sustained improvement in ROE are increasing.
At present, the share price is at an important stage, poised either to remain within the long-term symmetrical triangle pattern or to break out to the upside. The recovery in the share price to date is thought to reflect a combination of internal factors, namely the Company’s swift implementation of cost structure reforms, productivity reforms, and M&A, and external factors, namely the bottoming out of demand in green energy-related fields and the benefits of investment in AI data centers, as well as the presentation of a new Mid-Term Business Plan that is conscious of raising the level of ROE and reducing ROE volatility, which had been issues for the Company’s share price.
Stock price catalysts:
Based on the above, the key point to watch going forward is whether the Company can consistently achieve the targets of the renewed Mid-Term Business Plan. As this likelihood increases, the share price can be expected to break out of the long-term symmetrical triangle pattern since 2017 and target a PBR of 1x, or approximately 1,900 yen. As expectations for the Company in the stock market increase, even greater attention than before is expected to be paid to the Company’s capabilities for sustainable growth.
The catalysts to watch are as follows.
- Further improvement in the earnings structure and profit margins: The question is whether the Company can fully control fixed costs, improve the contribution margin, and build a robust earnings structure that exceeds the final target of the Mid-Term Business Plan, an operating profit margin of 6.1%. The results of cost control have already emerged in FY12/2025, and we would also like to see pricing that reflects added value take hold.
- Continuous accumulation of acquired projects: Another point is whether the Company can steadily accumulate newly acquired projects, which is a leading indicator of its earnings, and monetize them while minimizing missed opportunities. We would like to see the Company accumulate multiple layers of projects in xEV, data center-related, and Schmidbauer-related areas, which are cited as megatrend-related areas. The need to maximize M&A synergies is self-evident.
- Achievement and stabilization of the ROE target of 8.4%: If cost control normalizes and multilayered megatrend projects accumulate, the operating profit margin will stabilize at a high level, leading to ROE stabilizing at a high level. The point is whether the Company can reach and stabilize at the near-term target of 8.4%, and we look forward to the results of the various measures.
- Completion of the Made in Market structure and strengthening of risk resilience: Whether the Company can fully establish a “Made in Market” structure that is completed within each region, and establish a resilient supply chain and production structure in response to uncertain factors such as U.S. tariff risk and geopolitical risks around the world, will be the key to enhancing corporate stability and credibility.
- Updates on new businesses and business potential: If progress in commercializing in-house proprietary technologies and their business potential is shown sequentially, growth expectations will rise, and the shape of “Top Position in Multiple Niches” will come into view. Along with this, it is fully conceivable that multiples such as PER will expand and the share price will rise. We would like to receive regular updates.
- Whether the FY12/2026 earnings forecast will be revised upward: If both the full-year revenue and profit forecasts are revised upward, expectations in the stock market will rise further.
Points to note regarding risk factors
Fluctuations in exchange rates, prices of key raw materials such as copper, and shifts in global investment appetite for green energy-related investments may affect the Company’s earnings and therefore require attention.
Financial data (full-year basis)
| Unit: million yen | 2016 | 2017 | 2018 | 2019 | 2020 | 2021 | 2022 | 2023 | 2024 | 2025 |
| (Income Statement) | ||||||||||
| Sales | 81,052 | 90,153 | 97,538 | 94,283 | 84,417 | 104,920 | 138,600 | 147,672 | 143,978 | 147,194 |
| Year-on-year | -6.0% | 11.2% | 8.2% | -3.3% | -10.5% | 24.3% | 32.1% | 6.5% | -2.5% | 2.2% |
| Cost of Goods Sold | 66,191 | 75,019 | 82,192 | 81,414 | 73,319 | 89,563 | 119,298 | 126,561 | 125,970 | 126,270 |
| Gross Income | 14,861 | 15,134 | 15,346 | 12,869 | 11,098 | 15,357 | 19,302 | 21,111 | 18,008 | 20,924 |
| Gross Income Margin | 18.3% | 16.8% | 15.7% | 13.6% | 13.1% | 14.6% | 13.9% | 14.3% | 12.5% | 14.2% |
| SG&A Expense | 8,507 | 8,837 | 9,694 | 9,330 | 8,798 | 9,688 | 11,319 | 12,282 | 12,375 | 12,840 |
| EBIT (Operating Income) | 6,354 | 6,297 | 5,652 | 3,539 | 2,300 | 5,669 | 7,983 | 8,829 | 5,633 | 8,084 |
| Year-on-year | 50.0% | -0.9% | -10.2% | -37.4% | -35.0% | 146.5% | 40.8% | 10.6% | -36.2% | 43.5% |
| Operating Income Margin | 7.8% | 7.0% | 5.8% | 3.8% | 2.7% | 5.4% | 5.8% | 6.0% | 3.9% | 5.5% |
| EBITDA | 9,251 | 9,574 | 9,660 | 8,848 | 8,247 | 12,337 | 16,103 | 18,190 | 16,655 | 19,965 |
| Pretax Income | 5,469 | 5,697 | 4,061 | 2,184 | 1,470 | 3,898 | 6,534 | 5,856 | 1,295 | 4,830 |
| Consolidated Net Income | 3,844 | 4,628 | 2,531 | 1,596 | 839 | 2,695 | 5,168 | 5,102 | 434 | 3,582 |
| Minority Interest | 178 | 123 | 110 | 13 | 11 | 66 | 68 | 37 | -156 | -35 |
| Net Income ATOP | 3,666 | 4,504 | 2,420 | 1,582 | 828 | 2,629 | 5,099 | 5,064 | 590 | 3,618 |
| Year-on-year | 80.4% | 22.9% | -46.3% | -34.6% | -47.7% | 217.5% | 94.0% | -0.7% | -88.3% | 513.2% |
| Net Income Margin | 4.5% | 5.0% | 2.5% | 1.7% | 1.0% | 2.5% | 3.7% | 3.4% | 0.4% | 2.5% |
| (Balance Sheet) | ||||||||||
| Cash & Short-Term Investments | 3,546 | 5,375 | 4,098 | 3,286 | 5,237 | 4,237 | 2,944 | 3,107 | 4,286 | 6,129 |
| Total assets | 69,007 | 84,366 | 94,277 | 96,561 | 98,063 | 117,725 | 134,846 | 142,786 | 147,766 | 163,656 |
| Total Debt | 30,611 | 35,836 | 40,206 | 43,646 | 44,586 | 54,763 | 58,546 | 57,198 | 57,975 | 64,023 |
| Net Debt | 27,065 | 30,461 | 36,108 | 40,360 | 39,349 | 50,526 | 55,602 | 54,091 | 53,689 | 57,894 |
| Total liabilities | 46,982 | 54,242 | 58,835 | 61,963 | 63,503 | 77,622 | 85,966 | 85,471 | 86,849 | 98,298 |
| Total Shareholders’ Equity | 20,629 | 28,570 | 33,829 | 33,013 | 32,990 | 38,338 | 46,829 | 55,056 | 58,648 | 62,008 |
| (Cash Flow) | ||||||||||
| Net Operating Cash Flow | 8,291 | 3,658 | 4,672 | 8,732 | 9,107 | 600 | 10,566 | 18,343 | 14,928 | 16,457 |
| Capital Expenditure | 5,024 | 9,511 | 9,610 | 8,302 | 6,765 | 6,737 | 9,174 | 10,914 | 9,005 | 7,347 |
| Net Investing Cash Flow | -4,961 | -9,254 | -15,153 | -8,133 | -6,669 | -6,712 | -8,174 | -10,702 | -8,834 | -12,886 |
| Net Financing Cash Flow | -3,016 | 7,389 | 9,477 | -1,261 | -447 | 4,751 | -4,130 | -7,782 | -5,268 | -1,958 |
| Free Cash Flow | 3,941 | -5,173 | -3,769 | 1,379 | 3,118 | -5,212 | 2,362 | 8,539 | 7,068 | 10,224 |
| (Profitability ) | ||||||||||
| ROA (%) | 5.36 | 5.87 | 2.71 | 1.66 | 0.85 | 2.44 | 4.04 | 3.65 | 0.41 | 2.32 |
| ROE (%) | 19.27 | 18.31 | 7.76 | 4.74 | 2.51 | 7.37 | 11.98 | 9.94 | 1.04 | 6.00 |
| Net Margin (%) | 4.52 | 5.00 | 2.48 | 1.68 | 0.98 | 2.51 | 3.68 | 3.43 | 0.41 | 2.46 |
| Asset Turn | 1.18 | 1.18 | 1.09 | 0.99 | 0.87 | 0.97 | 1.10 | 1.06 | 0.99 | 0.95 |
| Assets/Equity | 3.60 | 3.12 | 2.86 | 2.86 | 2.95 | 3.03 | 2.97 | 2.72 | 2.56 | 2.58 |
| (Per-share) Unit: JPY | ||||||||||
| EPS | 157.9 | 176.4 | 90.2 | 58.3 | 30.5 | 96.7 | 187.5 | 167.4 | 17.9 | 109.4 |
| BPS | 888.8 | 1,069.6 | 1,250.0 | 1,216.1 | 1,213.7 | 1,409.8 | 1,722.1 | 1,687.4 | 1,774.6 | 1,875.5 |
| Dividend per Share | 34.00 | 45.00 | 27.00 | 24.00 | 9.00 | 28.00 | 47.00 | 51.00 | 53.00 | 53.00 |
| Shares Outstanding (million shares) | 23.94 | 27.44 | 27.44 | 27.44 | 27.44 | 27.44 | 27.44 | 32.88 | 33.10 | 33.11 |
Source: Omega Investment from company materials
Corporate data
Corporate profile/history
SUMIDA CORPORATION
【Head Office 】
KDX Ginza Building 7F, 3-7-2, Irifune, Chuo-ku, Tokyo
【R&D Centers】
Japan (Sendai, Nagano), China, Thailand, Germany, USA
【Sales offices in Japan】
Sendai, Nagano, Nagoya, Osaka, Saitama, Kawasaki
【Sales offices outside of Japan】
Hong Kong, Singapore, China, Taiwan, Thailand, South Korea, USA, Germany, India
【Manufacturing】
Japan (Aomori, Nagano), China (Taiping, Panyu, Nanning, Shanghai, Changde, Ji’an, SuQian), Mexico, Vietnam (Haiphong, Quang Ngai), Thailand, Germany (Obernzell, Neumarkt, Lehesten, Radeberg, Heubelsfelde), Romania, Slovenia, the Czech Republic, and the U.S.
【Business Description】
Electronic components & modules for use in Automotive, Consumer Electronic and Industrial applications
【No. of Employees 】14,964 (Consolidated;As of Dec. 31, 2025)
Sales by product category (fiscal year ended Dec. 2025)
By Market
By Production Area
By Sales Region
Source: Company materials
Corporate data

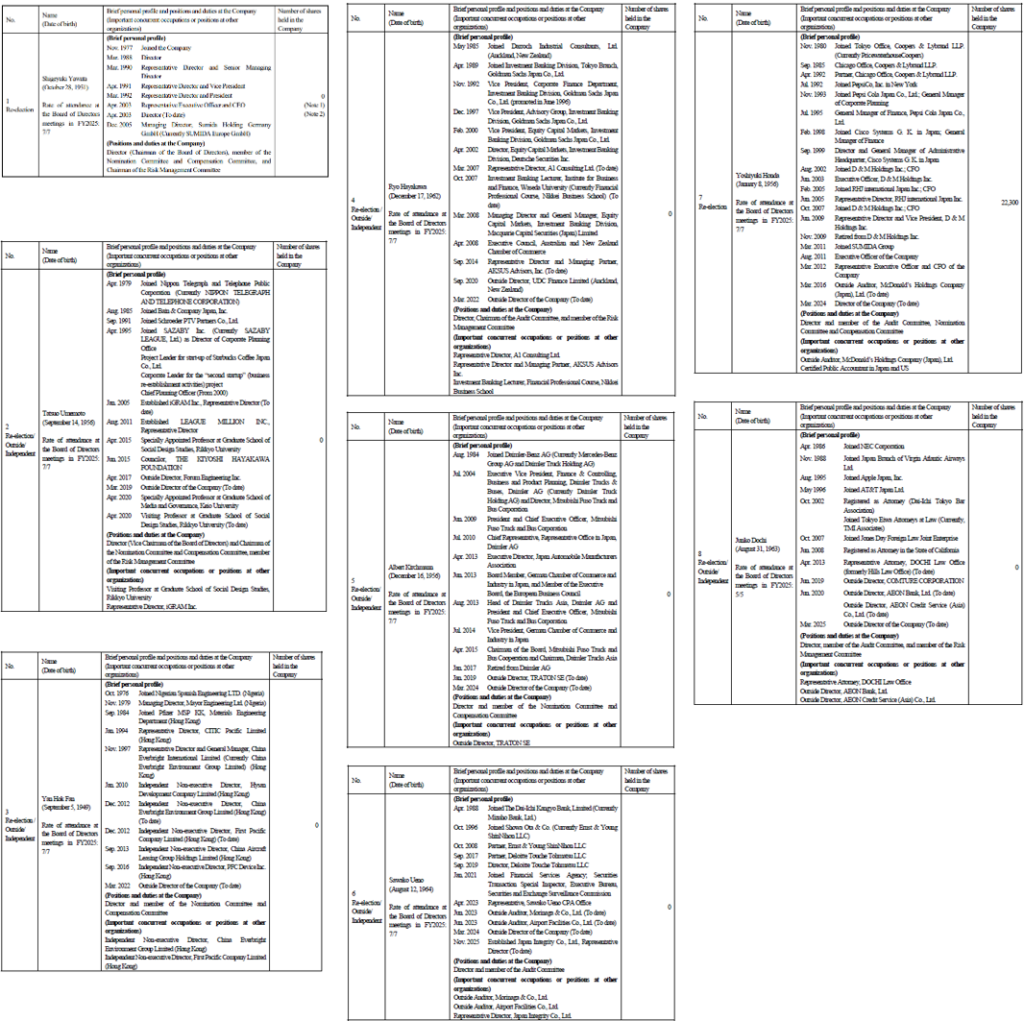
The top management
Source: Company materials
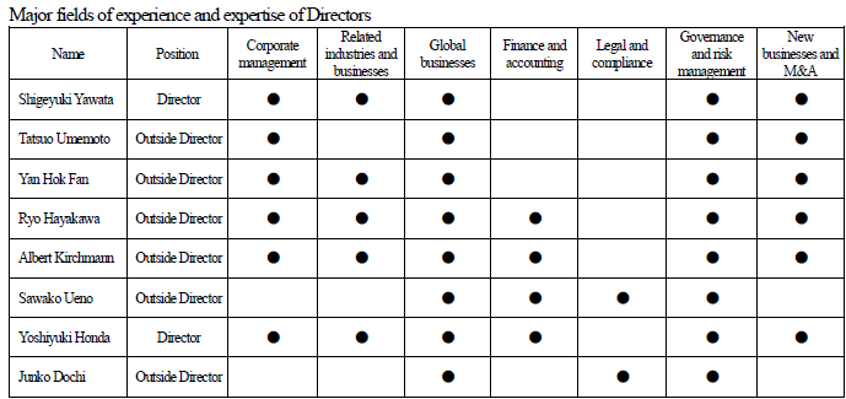
Skills matrix of the Board of Directors’ members
Source: Company materials
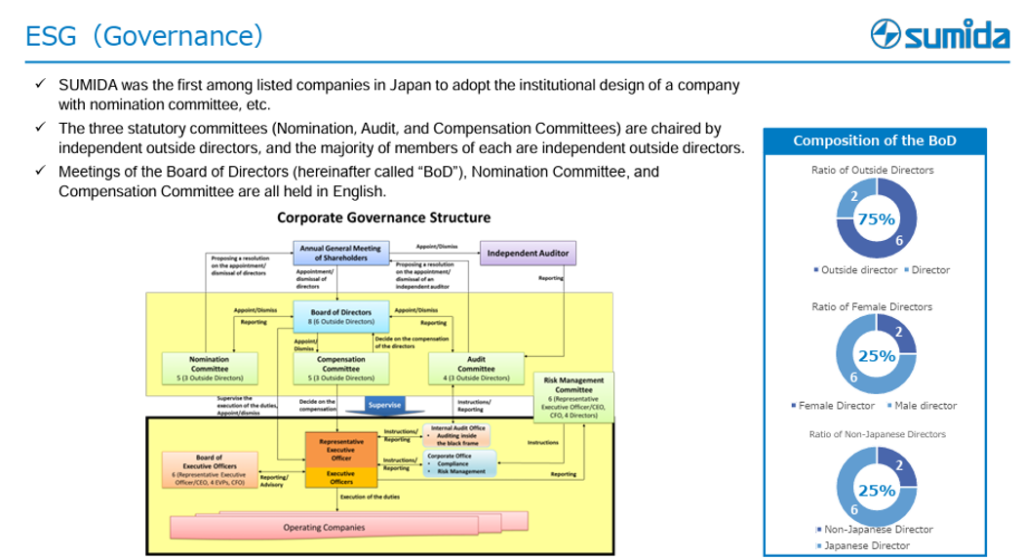
Corporate governance structure
Source: Company materials
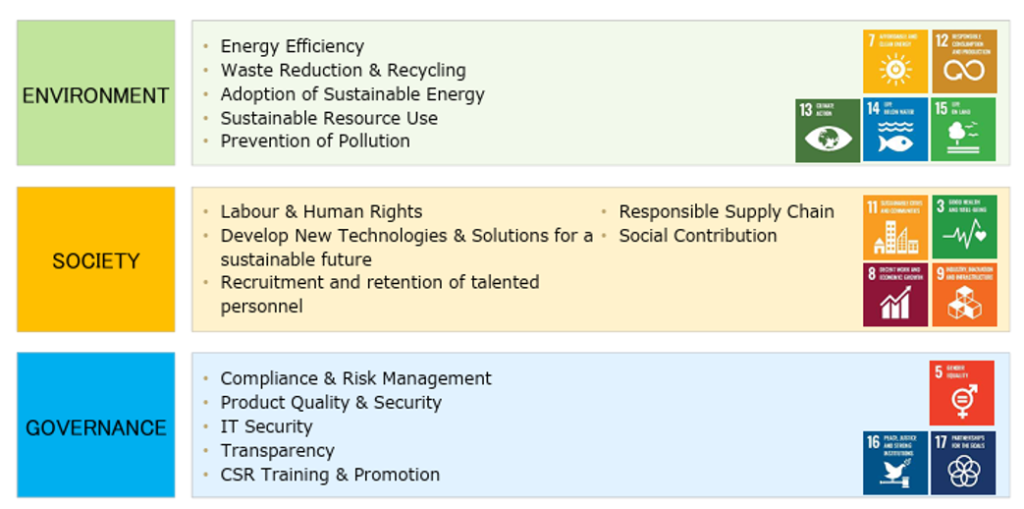
Initiatives toward ESG
Source: Company materials
Major shareholders (As of December 31, 2025)

Source: Company materials
Shareholding by ownership (As of December 31, 2025)
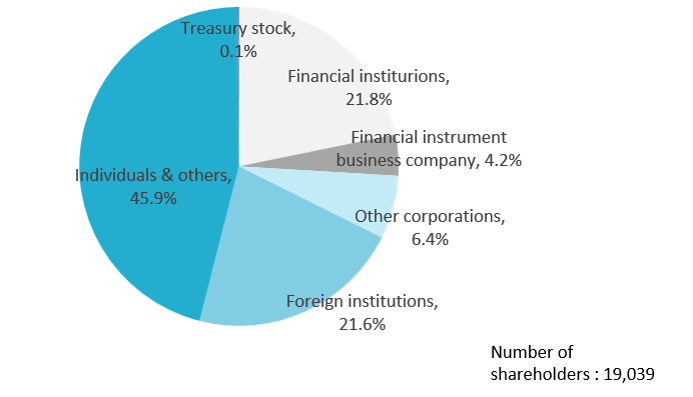
Source: Omega Investment from company materials