2026-07-06
Home
Japanese

Omega Investment Co., Ltd.
Kidswell Bio (Investment report – 4Q report)
| Share price (6/8) | ¥137 | Dividend Yield (27/3 CE) | 0.0 % |
| 52weeks high/low | ¥133/417 | ROE(26/3 act) | -28.1 % |
| Avg Vol (3 month) | 667.1 thou shrs | Operating margin (26/3 act) | -2.1 % |
| Market Cap | ¥6.79 bn | Beta (5Y Monthly) | 1.12 |
| Enterprise Value | ¥6.25 bn | Shares Outstanding | 49.623 mn shrs |
| PER (27/3 CE) | – X | Listed market | TSE Growth |
| PBR (26/3 act) | 4.2 X |
| Click here for the PDF version of this page |
| PDF version |
Operating profit confirmed; a phase to increase holdings on the back of an improved earnings base
Investment conclusion
The investment stance toward Kidswell Bio Corporation (the “Company”) is to maintain the previous bullish view and, in portfolio terms, to continue gradually raising the portfolio weighting. In the previous report, emphasis was placed on the fact that in the cumulative 3Q of FY3/2026, the Company recorded net sales of 5.02 billion yen and operating profit of 84 million yen, securing operating profitability while increasing R&D expenses, and the bullish view was raised further because “simultaneous progress in structural improvement and growth investment” had been confirmed in actual results. In the current full-year results, net sales amounted to 6.589 billion yen, exceeding the upper end of the upwardly revised range. In comparison, the Company recorded an operating loss of 138 million yen, an ordinary loss of 374 million yen, and net loss attributable to owners of the parent of 413 million yen, meaning that the establishment of operating profitability has been carried over to FY3/2027. Therefore, among the views held at the time of the previous report, the strength in demand and sales has largely been confirmed, but the establishment of consolidated operating profitability during FY3/2026 has not yet been achieved.
Even so, the reason the investment stance is not downgraded is that the shortfall was due not to deterioration in demand but to the fact that some early deliveries of biosimilar APIs and other products were not subject to profitability improvement, supply volume fell short of expectations due to the impact of the loss on disposal of inventories, and R&D investment expanded. The Company states that neither the loss on disposal of inventories nor the early deliveries will affect the next fiscal year, and that in FY3/2027, supply price revisions and the switch to products with lower manufacturing costs will contribute for the full year, resulting in expected net sales of 5.0–6.0 billion yen and operating profit of 100–600 million yen. This should be viewed as a shift to a phase in which the Company is not merely a sales growth stock, but is generating operating profit with price revisions, cost reductions, and manufacturing and delivery management as KPIs.
The source of the Company’s strength lies in its two-layer structure, under which it aims to drive upside in corporate value through cell therapy using SQ-SHED, funded by supply earnings from already-launched biosimilars. Biosimilars are responsible for near-term cash generation and downside resilience. At the same time, cell therapy is a re-rating factor as the Company advances clinical development in Japan and overseas with cerebral palsy as the most important indication. In February 2026, the Company reached a preliminary agreement with Treehill Partners to establish a new U.S. company. In March 2026, it announced a plan to reorganize its R&D structure and focus management resources on cerebral palsy. The growth potential is large, but the conditions for realizing it depend on concrete progress in clinical trial applications, manufacturing processes, funding burden, and alliance terms.
The market capitalization of 9.6 billion yen, actual PBR of 5.99x, and beta of 1.34 still reflect high expectations, but market capitalization and PBR have declined since the previous review, and if operating profitability in FY3/2027 improves, room for a re-rating will increase. In the portfolio, given that this is a small-cap biotech stock, it is appropriate not to acquire the shares all at once, but to make an initial addition at the current level, and then add further while confirming gross margin, operating profit, and the absence or presence of recurrence of unexpected expenses in 1Q FY3/2027. If the move into the black is delayed again, the increase in weighting should be halted; however, if the repeatability of operating profitability and the concrete progress of SQ-SHED clinical development are confirmed simultaneously, a stronger portfolio weighting could be considered.
◇ FY3/2026 4Q results highlights: sales exceeded expectations, but the establishment of profitability has been carried over to FY3/2027
The FY3/2026 full-year results confirmed the strength of biosimilar demand but also highlighted challenges in achieving consolidated operating profitability. Net sales increased significantly to 6.589 billion yen (+29.7% YoY), slightly exceeding the upper end of the 6.0–6.5 billion yen sales range revised upward in February 2026. On the other hand, operating profit/loss was a loss of 138 million yen (compared with operating profit of 27 million yen in the previous fiscal year), ordinary profit/loss was a loss of 374 million yen (compared with ordinary profit of 5 million yen in the previous fiscal year), and net profit/loss attributable to owners of the parent was a loss of 413 million yen (compared with a loss of 21 million yen in the previous fiscal year). Sales growth was confirmed, but the repeatability of operating profitability, which investors want to see, remains to be confirmed in FY3/2027.
The main factors behind sales expansion were increased deliveries of biosimilar APIs and other products, supply price revisions for certain products, and the early delivery of items scheduled for the following fiscal year. Gross profit increased to 1.747 billion yen (from 1.640 billion yen in the previous fiscal year), and the KPIs that drive net sales, namely delivery volume and price revisions, worked positively. However, gross margin declined. The Company cites the rebound from the previous fiscal year, when only the amount equivalent to gross profit was recorded as sales in connection with changes in payment terms, higher manufacturing costs due to the weaker yen, and actual supply volume falling short of expectations due to the disposal of some biosimilar APIs and other products. In other words, the anticipated sales growth and price revisions materialized, but foreign exchange, manufacturing processes, and product mix weighed on profits.
On the cost side, R&D expenses increased to 1.119 billion yen (from 767 million yen in the previous fiscal year). This was because the Company invested in cost-reduction measures for biosimilars, the development of new biosimilars, preparations for domestic and overseas clinical trials targeting cerebral palsy in cell therapy, non-clinical studies, and the development of large-scale manufacturing methods. This is not simply an increase in expenses but an investment to maintain the Company’s two-layer structure, in which biosimilars serve as the earnings base and cell therapy serves as future value. However, non-operating items included fees paid in connection with the arrangement of a syndicated loan and a loss on disposal of inventories. In contrast, extraordinary losses included a loss on the cancellation of lease contracts associated with the consolidation of research sites, which pushed down bottom-line profit.
On the positive side, despite the consolidated loss, the Company secured non-consolidated operating profit of 434 million yen. Supply earnings from already-launched biosimilar APIs and other products are functioning as an existing earnings base that supports R&D investment. On the negative side, the Company was unable to fully absorb cell therapy investment and one-off expenses on a consolidated basis. The way to overcome this is clear: improving gross margin through supply price revisions, switching to products with lower manufacturing costs, and preventing recurrence of manufacturing deviations and disposal losses. The Company explains that neither the loss on disposal of inventories nor the early deliveries will affect the next fiscal year, and this assumption will determine the reliability of the FY3/2027 operating profitability plan.
The sales upside can be evaluated positively, but this time, the quality of profit remained an issue. The next focus is whether price revisions and cost reductions actually appear as improvements in gross margin in 1Q FY3/2027.
◇ Segment analysis: a single segment for disclosure purposes, but in substance a two-layer structure of “biosimilars that generate earnings” and “cell therapy that expands value.”
For accounting purposes, the Company has a single segment, the “pharmaceutical development business,” but investors need to distinguish between the biosimilar and cell therapy businesses clearly. In the financial results, the Company states that its business segment is the sole pharmaceutical development segment, and that because net sales to external customers in a single product and service category exceed 90% of consolidated net sales, disclosure of net sales by product and service category is omitted. Therefore, a formal composition ratio by reporting segment is not disclosed; however, in substance, the supply of already-launched biosimilar APIs and other products accounts for the majority of sales, while cell therapy is positioned as a business that creates future value at the R&D stage.
The biosimilar business generates earnings from the supply of APIs and drug products after development products are launched, as well as royalty income. Customers are partner pharmaceutical companies, and the Company is in a position to manage manufacturing plans at CDMOs, deliveries, supply prices, and manufacturing cost reductions. In FY3/2026, demand for biosimilar APIs and other products exceeded that of the previous fiscal year, and progress in deliveries, the effects of price revisions, and the switch to lower-cost products pushed up sales and gross profit. Consolidated net sales were 6.589 billion yen, and gross profit was 1.747 billion yen, and on a non-consolidated basis, the Company secured operating profit of 434 million yen. Because the Company has a single segment, the pharmaceutical development business, this should not be equated with segment profit for the biosimilar business, but the Company’s near-term earnings can be understood as being supported by the existing earnings base centered on the supply of already-launched biosimilar APIs and other products. Its role in corporate value formation is to create the funding base and share price downside resilience required for an R&D-oriented biotech company. The key KPIs are the number of delivery lots, supply prices, gross margin, foreign exchange impact, the presence or absence of manufacturing deviations and disposal losses, and the market share of already-launched products such as GBS-007.
The cell therapy business aims to commercialize regenerative medicine products using SQ-SHED, which S-Quatre independently developed. Its current role is not about short-term earnings, but about building pipeline value that provides upside potential to the Company’s corporate value. With cerebral palsy as the most important indication, the Company is preparing for a clinical trial application in Japan with Mochida Pharmaceutical, and overseas, it is moving toward establishing a new U.S. company with Treehill Partners following a pre-IND meeting with the U.S. FDA. In addition, AMED adopted a research project with Kyushu University on congenital isolated hypoganglionosis. The key KPIs are submission of a clinical trial notification, IND application, establishment of the manufacturing process, external fundraising, alliance terms, and the timing of clinical data publication. The Company’s plan incorporates focused investment in cerebral palsy, with upside factors including concrete progress in the overseas development structure and downside factors including delays in clinical trial preparations and increased R&D expenses.
◇ FY3/2027 earnings forecast: sales temporarily adjust; the quality of operating profitability is the dividing line for a re-rating
FY3/2027 will be a year to confirm not the level of net sales itself, but the degree of certainty and quality with which operating profitability can be achieved. The Company forecasts net sales of 5.0–6.0 billion yen and operating profit of 100–600 million yen, meaning that from the FY3/2026 results of net sales of 6.589 billion yen and an operating loss of 138 million yen, sales are planned to decline, while operating profit/loss is planned to turn positive. The Company has not disclosed ordinary profit or net profit attributable to owners of the parent. At present, the forecast is only a range for net sales and operating profit. Therefore, investors need first to confirm the repeatability of operating profit, rather than anticipating the level of bottom-line profit in advance.
There are three major factors incorporated into the Company’s plan. First is the impact on GBS-007 from the entry of Eylea authorized generics and aflibercept biosimilars, which began sales from January 2026 onward. As a result, net sales are estimated conservatively. Second is the supply price revisions for some biosimilar APIs and other products, which began in the second half of FY3/2026. Third is the switch to lower-cost manufacturing for some APIs and other products. With these factors contributing for the full year, the plan assumes operating profitability even amid a decline in sales. In other words, the Company’s plan is driven mainly not by volume growth but by gross margin improvement through price revisions and cost reductions.
Upside factors are that the competitive impact on GBS-007 is lower than the Company’s conservative estimates, the delivery schedules for already-launched products including GBS-010 remain stable, and the effects of supply price revisions and manufacturing cost reductions are reflected in gross margin to a greater extent than expected. Furthermore, for new biosimilars, joint development with Alfresa Holdings, Chiome Bioscience, and Mycenax is progressing, and the framework for developing domestic manufacturing facilities and the CDMO business is becoming more concrete. These will make a limited contribution to short-term earnings but will serve as factors in evaluating future supply stability and the expansion of the earnings base.
Downside factors include a decline in GBS-007 sales volume due to competing products; higher manufacturing costs due to foreign exchange and overseas inflation; the recurrence of disposal losses or delivery delays associated with manufacturing processes; and an increase in clinical development expenses in the cell therapy business. In particular, because the Company outsources the manufacturing of biosimilar APIs to overseas CDMOs, foreign exchange and process control at manufacturing contractors are important KPIs that affect operating profit. The way to overcome these factors is through price negotiations with partner pharmaceutical companies, expanding the switch to lower-cost products, refining manufacturing and delivery plans, and prioritizing R&D investment. The Company has designated cerebral palsy as the most important indication in the cell therapy business and plans to continue investing toward the start of domestic and overseas clinical trials. The growth potential should be evaluated alongside concrete progress in clinical trial applications, manufacturing processes, and external fundraising.
In FY3/2027, the assessment will change if “operating profitability despite lower sales” is achieved. In 1Q, the top priorities to confirm are gross margin, operating profit, the competitive impact on GBS-007, and the absence or presence of unexpected expenses.
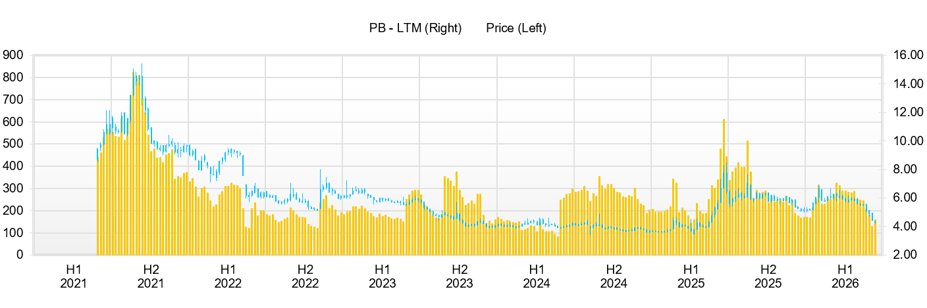
◇ Share price trend and key points to watch: growth scenario maintained; next focus is the quality of operating profitability and concrete progress on SQ-SHED
The Company’s share price tends to rise temporarily on expectations of cell therapy-related news, but after the FY3/2026 results, it has shifted to confirming the repeatability of operating profitability. Over the past three months, the share price declined by about 19%, from 248 yen on February 2, 2026, to 201 yen on May 15. During the period, the high was 301 yen on February 17, the closing price was 285 yen on March 10, and on May 15, the share price reached a year-to-date low of 192 yen. Compared with the closing price of 222 yen on May 14, the closing price on May 15, the day after the results announcement, was 201 yen, down 9.46% from the previous day, and this can be understood as the market cautiously receiving the fact that full-year net sales exceeded expectations, while the Company recorded a consolidated operating loss, a larger bottom-line loss, and a forecast for lower sales in FY3/2027.
In terms of valuation, market capitalization is 9.6 billion yen, actual PBR is 5.99x, and beta is 1.34. ROA is -6.32%, ROE is -27.0%, and ROIC is -12.8%, and capital efficiency on an actual results basis remains at the level of a loss-making biotech company. Net cash is approximately 740 million yen, and a certain degree of short-term financial resilience remains. The market valuation is determined not by the current level of profit, but by the Company’s FY3/2027 plan for operating profit of 100–600 million yen, the effects of price revisions and cost reductions in biosimilars, and the pipeline value of cell therapy centered on SQ-SHED. Therefore, the current share price should be viewed not simply as an undervalued stock, but as a growth-expectation stock that buys into the “likelihood of achieving profitability” and the “likelihood of commercialization of cell therapy.”
The share price reaction to news releases tends to be more strongly influenced by the concreteness of overseas expansion, funding, and monetization than by the research theme itself. The clearest example was the basic agreement announced on February 16, 2026, with Treehill Partners to establish a new U.S. company. On the following day, February 17, the share price rose to a high of 301 yen, up 16.2% from the previous closing price of 259 yen. The closing price was also 278 yen, up 7.3%, as the establishment of a new U.S. company to promote the overseas clinical development of SQ-SHED was seen as a positive catalyst.
On the other hand, AMED’s adoption of SHED clinical research targeting congenital isolated hypoganglionosis, announced on April 6, was important from an R&D perspective, but the share price reaction was limited. Compared with the closing price of 248 yen on April 3, the closing price was 249 yen on April 6 and 246 yen the following day, April 7, and it was not viewed as a strong short-term share price catalyst. This is because although AMED adoption indicates a partial reduction in the development cost burden and progress in research, the timing and scale of contributions to sales and profits remain difficult to discern. Its importance as IR is high, but there is still distance to the concrete progress that investors seek in “clinical trial start timing,” “external fundraising,” “alliance terms,” and “future earnings.”
The full-year results announced on May 14 negatively affected the share price. According to the Company’s materials, net sales were 6.589 billion yen, operating loss was 138 million yen, ordinary loss was 374 million yen, and net loss attributable to owners of the parent was 413 million yen. Sales exceeded expectations, partly due to early deliveries, but in terms of profit, the loss on disposal of inventories, fees paid, expenses related to the consolidation of research sites, and increased R&D expenses offset the gains. The market has shifted its focus from “sales growth” to “quality of profit,” and this reaction is reasonable.
The key identifiable catalysts are U.S. expansion with Treehill, AMED adoption, reorganization of the R&D structure, and the earnings announcement. In terms of trading volume, volume exceeded 6.87 million shares on February 17, the day after the Treehill-related news, and exceeded 1.73 million shares on May 15, the day after the results announcement. This suggests that market participants’ attention is concentrated on overseas expansion of cell therapy and the reliability of operating profitability.
From a technical perspective, the first upside level is the 260–270 yen range, which will serve as a short-term profit-taking-on-rallies zone. Trading expanded at this level from late February to mid-March, and the closing price of 285 yen on March 10 and the high of 301 yen on February 17 are the next clear resistance levels. The share price once reached the 300 yen range on the Treehill-related news but failed to hold there, and breaking through again will require not merely R&D news but operating profitability in 1Q FY3/2027, improvement in gross margin, limited competitive impact on GBS-007, or concrete progress in SQ-SHED clinical trial applications, establishment of the new U.S. company, or external fundraising. On the downside, the year-to-date low of 192 yen on May 15 is the first support level, and a clear break below it would signal that the market has begun to price in reduced confidence in the Company’s FY3/2027 plan.
Considering the Company’s market capitalization, liquidity, and share price volatility, in portfolio terms, this is not a phase in which an overweight position should be clearly indicated as with large-cap stocks, but rather it should be positioned as a target whose portfolio weighting is raised gradually in small lots according to supporting evidence from news flow and earnings. There are four conditions for this. First, in 1Q FY3/2027, gross margin must improve by more than net sales, and the effects of supply price revisions and the switch to lower-cost products must be reflected in the figures. Second, operating profitability must not be one-off, and the recurrence of unexpected expenses, such as losses on the disposal of inventories and fees paid, must be contained. Third, regarding the impact of the entry of aflibercept authorized generics and biosimilars on GBS-007, the impact on sales volume, delivery plans, and gross margin must be disclosed quantitatively. Fourth, for SQ-SHED, the domestic clinical trial notification, U.S. IND application, establishment of the new U.S. company with Treehill, fundraising, and support structure from Thermo Fisher Scientific and others must become concrete with timing and division of roles.
Investment timing should be considered in two stages. In the short term, in a phase where the share price has corrected to around 200 yen due to disappointment over the results, an initial addition in small lots can be considered, taking into account net cash and the FY3/2027 operating profitability plan. However, rather than mechanically viewing a break below 200 yen as a buying opportunity, it is preferable to wait and see whether gross margin improvement and operating profitability can be confirmed in the next results. Full-scale additional acquisition would realistically come when any of the following emerges: 1Q FY3/2027 results, refinement of earnings forecasts, disclosure of the competitive impact on GBS-007, or SQ-SHED clinical trial-related IR. Conversely, if the assumptions underlying the operating profitability plan break down, manufacturing-related losses recur, or only development expenses for cell therapy run ahead, the increase in the weighting should be halted.
The Company’s shares have moved from a phase in which they were bought on news flow alone to one in which the link between news flow and profit, cash generation, and clinical progress is being verified. The area around 200 yen is a certain buy-on-dips level, but chasing the upside requires the quality of operating profitability and concrete progress in the SQ-SHED commercialization process.
Company profile
◇ A two-layer biotech company that aims for upside in corporate value through cell therapy, based on the earnings base of biosimilars
Kidswell Bio Corporation is an R&D-oriented biotech company that uses cash flow from already-launched biosimilars as a near-term source of cash and develops cell therapy using stem cells from human exfoliated deciduous teeth as a medium- to long-term growth driver. It has adopted “Biotech Engineering Company, Striving for Value Creation -For Comprehensive Healthcare System for Children as well as Families and Society -” as its corporate philosophy, and sets “KIDS WELL, ALL WELL” as its management vision.
The Company was established on March 1, 2001, and has 37 non-consolidated employees as of March 31, 2025. It has a structure that advances development and supply through a small-scale organization while leveraging collaboration with external partners, including pharmaceutical companies, CDMOs, universities, and research institutions.
Its business consists of two pillars: the biosimilar business, which develops biosimilars and supplies APIs and drug products after launch, and the cell therapy business, which aims to commercialize regenerative medicine products using “SQ-SHED,” stem cells from human exfoliated deciduous teeth, independently developed by the subsidiary S-Quatre.
Key financial data
| Unit: million yen | 2022/3 | 2023/3 | 2024/3 | 2025/3 | 2026/3 | 2027/3 CE |
| Sales | 1,569 | 2,776 | 2,431 | 5,082 | 6,590 | 5,000 -6,000 |
| EBIT | -976 | -551 | -1,336 | 28 | -139 | 100 -600 |
| Pretax Income | -550 | -656 | -1,421 | 73 | -403 | |
| Net Profit Attributable to Owner of Parent | -551 | -657 | -1,422 | -21 | -414 | na |
| Cash & Short-Term Investments | 1,161 | 1,067 | 2,231 | 2,995 | 3,295 | |
| Total assets | 3,470 | 3,895 | 5,086 | 7,008 | 6,088 | |
| Total Debt | 700 | 1,950 | 2,575 | 1,838 | 2,550 | |
| Net Debt | -461 | 883 | 344 | -1,157 | -745 | |
| Total liabilities | 1,767 | 2,661 | 4,254 | 5,598 | 4,434 | |
| Total Shareholders’ Equity | 1,703 | 1,234 | 831 | 1,411 | 1,654 | |
| Net Operating Cash Flow | -1,170 | -1,421 | -454 | 937 | -1,093 | |
| Capital Expenditure | 0 | 0 | 0 | 6 | 18 | |
| Net Investing Cash Flow | 527 | -29 | 0 | 65 | -13 | |
| Net Financing Cash Flow | 369 | 1,356 | 1,618 | -240 | 1,398 | |
| ROA (%) | -14.88 | -17.85 | -31.67 | -0.35 | -6.32 | |
| ROE (%) | -33.25 | -44.78 | -137.73 | -1.89 | -27.02 | |
| EPS (Yen) | -17.9 | -20.8 | -40.2 | -0.5 | -8.5 | na |
| BPS (Yen) | 54.2 | 38.5 | 21.4 | 32.2 | 33.3 | |
| Dividend per Share (Yen) | 0.00 | 0.00 | 0.00 | 0.00 | 0.00 | 0.00 |
| Shares Outstanding (Million shares) | 31.44 | 31.90 | 37.31 | 40.66 | 49.58 |
Source: Calculated by Omega Investment based on FactSet’s standard criteria, rounded to the nearest whole number.
Share price
Key stock price data
Financial data (quarterly basis)
| Unit: million yen | 2024/3 | 2025/3 | 2026/3 | ||||||
| 4Q | 1Q | 2Q | 3Q | 4Q | 1Q | 2Q | 3Q | 4Q | |
| (Income Statement) | |||||||||
| Sales | 864 | 483 | 1,267 | 1,286 | 2,046 | 1,721 | 1,556 | 1,743 | 1,571 |
| Year-on-year | -17.6% | 950.4% | 136.4% | 30.6% | 136.6% | 256.3% | 22.8% | 35.5% | -23.2% |
| Cost of Goods Sold (COGS) | 688 | 259 | 998 | 748 | 1,436 | 1,123 | 1,160 | 1,405 | 1,154 |
| Gross Income | 176 | 224 | 269 | 538 | 610 | 597 | 396 | 337 | 417 |
| Gross Income Margin | 20.4% | 46.3% | 21.2% | 41.8% | 29.8% | 34.7% | 25.4% | 19.4% | 26.6% |
| SG&A Expense | 845 | 383 | 372 | 414 | 444 | 413 | 365 | 468 | 640 |
| EBIT | -669 | -159 | -104 | 125 | 166 | 185 | 31 | -131 | -223 |
| Year-on-year | 60.9% | -65.1% | -60.9% | 136.8% | -124.8% | -216.2% | -129.6% | -205.3% | -234.3% |
| Operating Income Margin | -77.3% | -32.9% | -8.2% | 9.7% | 8.1% | 10.7% | 2.0% | -7.5% | -14.2% |
| EBITDA | -668 | -159 | -103 | 125 | 166 | 185 | 31 | -131 | -223 |
| Pretax Income | -676 | -176 | -65 | 107 | 207 | 176 | -88 | -212 | -279 |
| Consolidated Net Income | -675 | -177 | -65 | 54 | 167 | 157 | -97 | -203 | -271 |
| Minority Interest | 0 | 0 | 0 | 0 | 0 | 0 | 0 | 0 | 0 |
| Net Income ATOP | -675 | -177 | -65 | 54 | 167 | 157 | -97 | -203 | -271 |
| Year-on-year | 45.9% | -62.5% | -79.0% | 64.4% | -124.7% | -188.9% | 48.3% | -476.5% | -262.7% |
| Net Income Margin | -78.0% | -36.6% | -5.1% | 4.2% | 8.1% | 9.1% | -6.2% | -11.7% | -17.3% |
| (Balance Sheet) | |||||||||
| Cash & Short-Term Investments | 2,231 | 1,167 | 1,695 | 1,318 | 2,995 | 2,840 | 1,542 | 3,785 | 3,295 |
| Total assets | 5,086 | 4,609 | 4,646 | 4,575 | 7,008 | 6,579 | 5,815 | 6,320 | 6,088 |
| Total Debt | 2,575 | 2,402 | 2,131 | 2,034 | 1,838 | 1,549 | 1,134 | 2,625 | 2,550 |
| Net Debt | 344 | 1,235 | 436 | 715 | -1,157 | -1,291 | -407 | -1,160 | -745 |
| Total liabilities | 4,254 | 3,895 | 3,789 | 3,523 | 5,598 | 4,531 | 3,629 | 4,394 | 4,434 |
| Total Shareholders’ Equity | 831 | 714 | 857 | 1,052 | 1,411 | 2,048 | 2,186 | 1,926 | 1,654 |
| (Profitability %) | |||||||||
| ROA | -31.67 | -29.48 | -22.54 | -17.65 | -0.35 | 5.59 | 5.38 | 0.44 | -6.32 |
| ROE | -137.73 | -152.15 | -91.46 | -69.11 | -1.89 | 22.64 | 18.48 | 1.60 | -27.02 |
| (Per-share) Unit: JPY | |||||||||
| EPS | -17.5 | -4.5 | -1.6 | 1.3 | 3.8 | 3.3 | -1.9 | -4.1 | -5.5 |
| BPS | 21.4 | 18.1 | 21.1 | 25.9 | 32.2 | 43.0 | 44.1 | 38.8 | 33.3 |
| Dividend per Share | 0.00 | 0.00 | 0.00 | 0.00 | 0.00 | 0.00 | 0.00 | 0.00 | 0.00 |
| Shares Outstanding (million shares) | 38.43 | 39.41 | 40.66 | 40.66 | 43.88 | 47.63 | 49.56 | 49.58 | 49.62 |
Source: Calculated by Omega Investment based on FactSet’s standard criteria, rounded to the nearest whole number
Financial data (full-year basis)
| Unit: million yen | 2017/3 | 2018/3 | 2019/3 | 2020/3 | 2021/3 | 2022/3 | 2023/3 | 2024/3 | 2025/3 | 2026/3 |
| (Income Statement) | ||||||||||
| Sales | 1,089 | 1,060 | 1,022 | 1,078 | 997 | 1,569 | 2,776 | 2,431 | 5,082 | 6,590 |
| Year-on-year | -6.2% | -2.7% | -3.6% | 5.5% | -7.5% | 57.5% | 76.9% | -12.4% | 109.0% | 29.7% |
| Cost of Goods Sold | 398 | 423 | 413 | 653 | 120 | 553 | 1,251 | 1,393 | 3,443 | 4,843 |
| Gross Income | 692 | 637 | 609 | 425 | 877 | 1,017 | 1,525 | 1,038 | 1,639 | 1,747 |
| Gross Income Margin | 63.5% | 60.1% | 59.6% | 39.4% | 88.0% | 64.8% | 54.9% | 42.7% | 32.3% | 26.5% |
| SG&A Expense | 1,876 | 1,551 | 1,414 | 1,586 | 1,847 | 1,992 | 2,076 | 2,374 | 1,611 | 1,886 |
| EBIT | -1,184 | -913 | -806 | -1,161 | -970 | -976 | -551 | -1,336 | 28 | -139 |
| Year-on-year | 44.4% | -22.9% | -11.8% | 44.2% | -16.5% | 0.6% | -43.5% | 142.4% | -102.1% | -596.8% |
| Operating Income Margin | -108.7% | -86.2% | -78.8% | -107.8% | -97.3% | -62.2% | -19.8% | -54.9% | 0.5% | -2.1% |
| EBITDA | -1,184 | -913 | -805 | -1,161 | -969 | -973 | -550 | -1,335 | 29 | -138 |
| Pretax Income | -1,222 | -903 | -854 | -7,314 | -1,000 | -550 | -656 | -1,421 | 73 | -403 |
| Consolidated Net Income | -1,225 | -905 | -856 | -7,316 | -1,001 | -551 | -657 | -1,422 | -21 | -414 |
| Minority Interest | 0 | 0 | 0 | 0 | 0 | 0 | 0 | 0 | 0 | 0 |
| Net Income ATOP | -1,225 | -905 | -856 | -7,316 | -1,001 | -551 | -657 | -1,422 | -21 | -414 |
| Year-on-year | 55.5% | -26.1% | -5.3% | 754.4% | -86.3% | -45.0% | 19.3% | 116.3% | -98.5% | 1858.3% |
| Net Income Margin | -112.4% | -85.4% | -83.8% | -678.9% | -100.5% | -35.1% | -23.7% | -58.5% | -0.4% | -6.3% |
| (Balance Sheet) | ||||||||||
| Cash & Short-Term Investments | 2,380 | 1,891 | 2,009 | 2,033 | 1,461 | 1,161 | 1,067 | 2,231 | 2,995 | 3,295 |
| Total assets | 3,706 | 3,025 | 3,151 | 3,592 | 3,934 | 3,470 | 3,895 | 5,086 | 7,008 | 6,088 |
| Total Debt | 0 | 0 | 0 | 1,225 | 1,100 | 700 | 1,950 | 2,575 | 1,838 | 2,550 |
| Net Debt | -2,380 | -1,891 | -2,009 | -808 | -361 | -461 | 883 | 344 | -1,157 | -745 |
| Total liabilities | 206 | 421 | 420 | 2,105 | 2,324 | 1,767 | 2,661 | 4,254 | 5,598 | 4,434 |
| Total Shareholders’ Equity | 3,500 | 2,604 | 2,731 | 1,487 | 1,610 | 1,703 | 1,234 | 831 | 1,411 | 1,654 |
| (Cash Flow) | ||||||||||
| Net Operating Cash Flow | -1,759 | -438 | -860 | -1,325 | -1,267 | -1,170 | -1,421 | -454 | 937 | -1,093 |
| Capital Expenditure | 0 | 0 | 0 | 2 | 3 | 0 | 0 | 0 | 6 | 18 |
| Net Investing Cash Flow | -150 | -50 | -0 | -137 | -22 | 527 | -29 | 0 | 65 | -13 |
| Net Financing Cash Flow | 3,472 | 0 | 978 | 1,222 | 718 | 369 | 1,356 | 1,618 | -240 | 1,398 |
| (Profitability ) | ||||||||||
| ROA (%) | -45.35 | -26.88 | -27.73 | -216.99 | -26.61 | -14.88 | -17.85 | -31.67 | -0.35 | -6.32 |
| ROE (%) | -62.74 | -29.64 | -32.10 | -346.86 | -64.66 | -33.25 | -44.78 | -137.73 | -1.89 | -27.02 |
| Net Margin (%) | -112.41 | -85.36 | -83.81 | -678.87 | -100.49 | -35.10 | -23.68 | -58.49 | -0.42 | -6.28 |
| Asset Turn | 0.40 | 0.31 | 0.33 | 0.32 | 0.26 | 0.42 | 0.75 | 0.54 | 0.84 | 1.01 |
| Assets/Equity | 1.38 | 1.10 | 1.16 | 1.60 | 2.43 | 2.23 | 2.51 | 4.35 | 5.39 | 4.27 |
| (Per-share) Unit: JPY | ||||||||||
| EPS | -68.5 | -47.3 | -43.8 | -264.7 | -34.8 | -17.9 | -20.8 | -40.2 | -0.5 | -8.5 |
| BPS | 182.9 | 136.1 | 134.3 | 53.8 | 54.4 | 54.2 | 38.5 | 21.4 | 32.2 | 33.3 |
| Dividend per Share | 0.00 | 0.00 | 0.00 | 0.00 | 0.00 | 0.00 | 0.00 | 0.00 | 0.00 | 0.00 |
| Shares Outstanding (million shares) | 18.74 | 19.14 | 19.68 | 27.65 | 29.06 | 31.44 | 31.90 | 37.31 | 40.66 | 49.58 |
Source: Omega Investment from company data, rounded to the nearest whole number