2026-04-02
Home
Japanese

Omega Investment Co., Ltd.
Cosmo Bio (Company note – 1Q update)

| Share price (6/26) | ¥1,039 | Dividend Yield (24/12 CE) | 2.88 % |
| 52weeks high/low | ¥1,072/937 | ROE(23/12) | 5.4 % |
| Avg Vol (3 month) | 7.1 thou shrs | Operating margin (23/12) | 5.6 % |
| Market Cap | ¥6.28 bn | Beta (5Y Monthly) | 0.61 |
| Enterprise Value | ¥3.24 bn | Shares Outstanding | 5.834 mn shrs |
| PER (24/12 CE) | 20.3 X | Listed market | TSE Standard |
| PBR (23/12 act) | 0.71 X |
| Click here for the PDF version of this page |
| PDF Version |
Contribute to the advancement of life science by providing research reagents and life science equipment.
◇The company’s results for the first quarter of FY12/2024: Sales increase and profit decrease, but in line with expectations
Cosmo Bio’s 1Q (Jan-Mar) FY12/2024 results, announced after the close of trading on May 9, 2024, showed increased sales and decreased profits. Sales were 2.94 billion yen (+4% YoY), operating profit was 300 million yen (-23% YoY), ordinary profit was 290 million yen (-28% YoY), and net profit attributable to owner of parent company was 230 million yen (-12% YoY).
According to the company, results were in line with expectations. Sales and ordinary profit were 30% and 66% of the company’s full-year forecasts, respectively. It should be noted that the company’s full-year forecasts are for higher sales and lower profits, but the rate of progress is fine.
It should also be noted that under the new President Shibayama’s leadership, the company is progressing in developing its business structure.
◇Forecasts for the FY12/2024: unchanged
The 2Q cumulative and full-year forecasts have not been changed. The assumed exchange rate for the full year is 150 yen to the US dollar.
◇Share price trend and future focus: expect progress in growth strategy and countermeasures for low PBR
The share price has recently started to rise. The following points are worth noting for the share price to get on a full-fledged upward trajectory.
Firstly, what are the future trends in the dollar/yen exchange rate (will the yen stop weakening) and with this, will there be (upward) revisions to the full-year forecast at or after the announcement of the 2Q results? Will foreign exchange risk management methods become more sophisticated?
Secondly, will concrete projects be built up regarding strengthening and expanding the trading company function, developing and expanding the manufacturing function, and globalising the business, as set out in the medium-term growth strategy? As a result, will investors be able to see a path towards a structure that will allow the company to increase sales and profits while structurally reducing foreign exchange risks?
Finally, will there be concrete measures on the medium-term business strategy to improve ROE and the prospects of PBR rising above 1x?
◇Cosmo Bio’s 1Q FY12/2024 results: sales and profits up, but in line with expectations
Cosmo Bio’s 1Q (Jan-Mar) results for FY12/2024, announced after the close of trading on May 9, 2024, showed an increase in sales and a decrease in profit. Sales were 2.94 billion yen (+4% YoY), operating profit was 300 million yen (-23% YoY), ordinary profit was 290 million yen (-28% YoY), and net profit attributable to owner of parent company was 230 million yen (-12% YoY).
In terms of sales, demand from the private sector appears to have been strong. The operating profit margin was 10.3%, down 3.7 percentage points YoY. This was mainly due to higher purchase and delivery costs, as the yen depreciated 9% YoY against the US dollar to 146 yen. As a result, profits decreased despite the increase in sales.
Thus, the company captured demand in 1Q, which is positive. According to the company, its performance was in line with expectations, which is also noteworthy. Progress against the company’s full-year forecasts is in line with expectations, with sales at 30% and ordinary profit at around 66%.
However, the results also reiterate the need to raise added value by strengthening manufacturing, improving labour productivity, and shifting from an import-oriented business structure to one that balances imports and exports in order to fundamentally improve profitability.
As a point of interest other than financial results, it should be pointed out that under the new President Shibayama’s leadership, organisational reforms are underway to promote the medium-term plan. Specifically, as of April 1, 2024, the Human Resources Department, Marketing Department, Product Legal Department and Manufacturing Engineering Department were newly established, and the Sapporo Business Department was abolished and its functions transferred mainly to the Business Development Department and Manufacturing Engineering Department. The aim appears to be to establish a structure to increase exports and to improve the efficiency of in-house product development. This is a serious approach to the company’s business structure management issues mentioned above.
In addition, the contract service matching website Scientist3 (Scientist Cube) is being closely tested during the quarter under review.
For reference, the key measures for the current year are shown below.
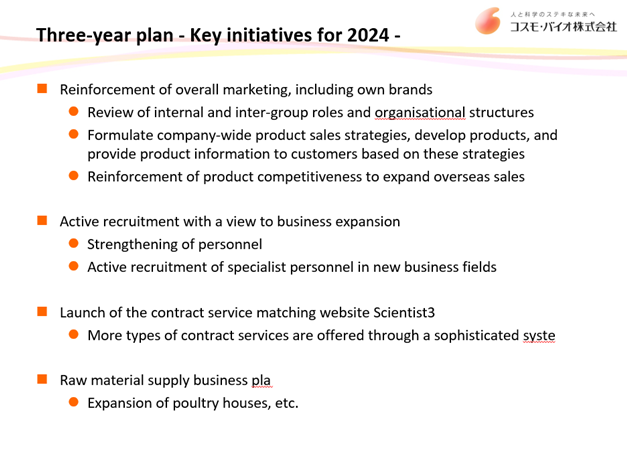
Source: Company materials
| JPY, mn, % | Net sales | YoY % |
Oper. profit |
YoY % |
Ord. profit |
YoY % |
Profit ATOP |
YoY % |
EPS (¥) |
DPS (¥) |
| 2019/12 | 7,590 | 4.5 | 405 | 23.5 | 470 | 16.5 | 237 | -8.6 | 40.14 | 14.00 |
| 2020/12 | 8,092 | 6.6 | 752 | 85.6 | 817 | 73.7 | 674 | 183.2 | 113.70 | 34.00 |
| 2021/12 | 9,231 | 14.1 | 1,048 | 39.4 | 1,099 | 34.5 | 737 | 9.4 | 126.94 | 36.00 |
| 2022/12 | 9,553 | 3.5 | 816 | -22.2 | 790 | -28.1 | 517 | -29.8 | 89.13 | 36.00 |
| 2023/12 | 9,340 | -2.2 | 519 | -36.3 | 653 | -17.4 | 442 | -14.4 | 75.97 | 30.00 |
| 2024/12 (CE) | 9,800 | 4.9 | 390 | -25.0 | 450 | -31.1 | 310 | -30.0 | 53.12 | 30.00 |
| 2023/12 1Q | 2,828 | -7.2 | 400 | -30.7 | 416 | -26.2 | 264 | -17.8 | 45.46 | 0.00 |
| 2024/12 1Q | 2,943 | 4.1 | 305 | -23.8 | 299 | -28.1 | 230 | -12.6 | 39.56 | 0.00 |
◇Company forecasts for FY12/2024: unchanged
The 2Q cumulative and full-year forecasts have not been changed. The assumed exchange rate for the full year is 150 yen to the US dollar.
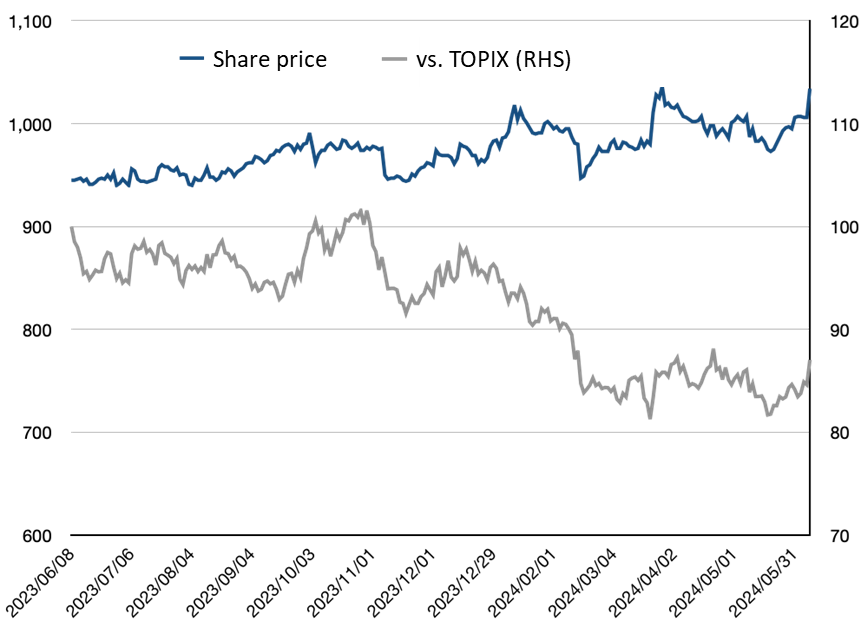
◇Stock price trends and future highlights: expect progress in growth strategies and countermeasures for low PBR
The company’s share price has underperformed the TOPIX over the past year, although it has been slowly rising. The share price has recently increased. This is due to the company’s undervalued PBR of 0.71x, the high rate of progress in 1Q profits against the full-year plan as mentioned above, and the fact that the company is attracting increasing attention as a ‘dementia-related stock’ dealing in dementia products.
Thus, the stock price recovery may have been triggered, but for a full-fledged recovery, the following factors should be noted.
Firstly, what are the future trends in the dollar/yen exchange rate (will the yen stop weakening) and with this, will there be (upward) revisions to the full-year forecast at or after the announcement of the 2Q results? Will foreign exchange risk management methods become more sophisticated?
Secondly, will concrete projects be built up regarding strengthening and expanding the trading company function, developing and expanding the manufacturing function, and globalising the business, as set out in the medium-term growth strategy? As a result, will we see a path towards a structure that will allow the company to increase sales and profits while structurally reducing foreign exchange risks?
Finally, will there be concrete measures on the medium-term business strategy to improve ROE and the prospects of PBR rising above 1x?
President Shibayama is fully aware of the low ROE and PBR issues. We expect the stock market to take a greater interest in future news flows.
Financial data
| Unit: million yen | 2012/12 | 2013/12 | 2014/12 | 2015/12 | 2016/12 | 2017/12 | 2018/12 | 2019/12 | 2020/12 | 2021/12 | 2022/12 | 2023/12 | 2024/12 (Forecast) |
| [Statements of income] | |||||||||||||
| Net sales | 7,241 | 7,050 | 7,235 | 7,357 | 7,427 | 7,068 | 7,261 | 7,590 | 8,092 | 9,231 | 9,553 | 9,340 | 9,800 |
| Year-on-year | 0.7% | -2.6% | 2.6% | 1.7% | 1.0% | -4.8% | 2.7% | 4.5% | 6.6% | 14.1% | 3.5% | -2.2% | 4.9% |
| Cost of sales | 4,057 | 4,429 | 4,811 | 4,976 | 4,655 | 4,535 | 4,602 | 4,710 | 4,940 | 5,572 | 6,112 | 6,090 | |
| Gross profit | 3,184 | 2,620 | 2,424 | 2,380 | 2,772 | 2,532 | 2,659 | 2,879 | 3,152 | 3,658 | 3,440 | 3,249 | |
| SG&A expenses | 2,386 | 2,349 | 2,261 | 2,180 | 2,257 | 2,339 | 2,330 | 2,474 | 2,399 | 2,609 | 2,624 | 2,729 | |
| Operating profit | 798 | 271 | 162 | 200 | 514 | 193 | 328 | 405 | 752 | 1,048 | 816 | 519 | 390 |
| Year-on-year | -10.4% | -66.0% | -40.2% | 23.5% | 157.0% | -62.5% | 69.9% | 23.5% | 85.7% | 39.4% | -22.2% | -36.3% | -25.0% |
| Operating profit margin | 11.0% | 3.8% | 2.2% | 2.7% | 6.9% | 2.7% | 4.5% | 5.3% | 9.3% | 11.4% | 8.5% | 5.6% | 4.0% |
| Non-operating profit | 46 | 177 | 128 | 175 | 21 | 208 | 89 | 72 | 71 | 71 | 57 | 136 | |
| Non-operating expenses | 43 | 3 | 5 | 2 | 51 | 3 | 13 | 7 | 6 | 20 | 83 | 2 | |
| Ordinary Profit | 801 | 444 | 285 | 373 | 483 | 397 | 403 | 470 | 817 | 1,099 | 790 | 653 | 450 |
| Extraordinary profit | 3 | 9 | 46 | 34 | 55 | 8 | 190 | ||||||
| Extraordinary expenses | 30 | 2 | 1 | 0 | 82 | 5 | 81 | ||||||
| Income before income taxes | 774 | 451 | 330 | 407 | 456 | 400 | 403 | 388 | 1,008 | 1,099 | 790 | 653 | |
| Total income taxes | 336 | 137 | 131 | 158 | 180 | 148 | 126 | 142 | 307 | 331 | 238 | 191 | |
| net profit attributable to owner of parent | 411 | 313 | 201 | 230 | 254 | 237 | 260 | 237 | 674 | 737 | 517 | 442 | 310 |
| Year-on-year | -10.3% | -23.8% | -35.8% | 14.4% | 10.4% | -6.7% | 9.7% | -8.8% | 184.4% | 9.3% | -29.9% | -14.4% | -30.0% |
| Net profit ratio | 5.7% | 4.4% | 2.8% | 3.1% | 3.4% | 3.4% | 3.6% | 3.1% | 8.3% | 8.0% | 5.4% | 4.7% | 3.2% |
| [Balance Sheets] | |||||||||||||
| Current assets | 5,413 | 5,527 | 5,234 | 5,266 | 5,495 | 5,143 | 5,668 | 5,927 | 6,756 | 7,310 | 7,136 | 7,102 | |
| Cash equivalents and short-term securities | 2,143 | 2,036 | 1,482 | 1,498 | 1,948 | 1,483 | 2,268 | 2,516 | 3,259 | 3,555 | 3,036 | 3,025 | |
| Non-current assets | 1,541 | 2,750 | 2,927 | 2,523 | 2,438 | 2,982 | 2,832 | 2,962 | 2,883 | 2,761 | 3,176 | 3,770 | |
| Property, plant and equipment | 178 | 185 | 213 | 227 | 319 | 690 | 636 | 695 | 636 | 599 | 577 | 572 | |
| Investments and other assets | 1,201 | 2,456 | 2,613 | 2,071 | 1,842 | 2,041 | 1,943 | 2,068 | 2,081 | 1,979 | 2,428 | 3,042 | |
| Total assets | 6,955 | 8,277 | 8,161 | 7,790 | 7,934 | 8,126 | 8,501 | 8,890 | 9,640 | 10,072 | 10,313 | 10,872 | |
| Current liabilities | 916 | 818 | 1,130 | 1,017 | 916 | 799 | 945 | 987 | 1,226 | 1,093 | 1,038 | 1,123 | |
| Short-term borrowings | 20 | 20 | 20 | 20 | 20 | 20 | 20 | 20 | 20 | 20 | 20 | 20 | |
| Non-current liabilities | 317 | 660 | 497 | 394 | 436 | 488 | 502 | 581 | 552 | 658 | 656 | 722 | |
| Total liabilities | 1,234 | 1,479 | 1,628 | 1,412 | 1,352 | 1,288 | 1,448 | 1,568 | 1,779 | 1,752 | 1,695 | 1,846 | |
| Total net assets | 5,720 | 6,797 | 6,532 | 6,378 | 6,581 | 6,838 | 7,053 | 7,321 | 7,861 | 8,319 | 8,617 | 9,026 | |
| Shareholders’ equity | 5,230 | 6,311 | 6,050 | 5,951 | 6,135 | 6,381 | 6,581 | 6,843 | 7,358 | 7,787 | 8,052 | 8,443 | |
| Share capital | 918 | 918 | 918 | 918 | 918 | 918 | 918 | 918 | 918 | 918 | 918 | 918 | |
| Capital surplus | 1,221 | 1,221 | 1,221 | 1,251 | 1,251 | 1,251 | 1,251 | 1,251 | 1,251 | 1,258 | 1,260 | 1,261 | |
| Retained earnings | 3,119 | 3,314 | 3,397 | 3,521 | 3,680 | 3,812 | 4,026 | 4,181 | 4,761 | 5,274 | 5,560 | 5,805 | |
| Treasury shares | -67 | -67 | -67 | -67 | -67 | -67 | -67 | -67 | -67 | -239 | -216 | -194 | |
| Valuation and exchange differences | 37 | 924 | 579 | 327 | 352 | 466 | 451 | 558 | 494 | 574 | 530 | 654 | |
| Total liabilities and net assets | 6,955 | 8,277 | 8,161 | 7,790 | 7,934 | 8,126 | 8,501 | 8,890 | 9,640 | 10,072 | 10,313 | 10,872 | |
| (Equity ratio) | 75.2% | 76.2% | 74.1% | 76.4% | 77.3% | 78.5% | 77.4% | 77.0% | 76.3% | 77.3% | 78.1% | 77.7% | |
| [Statements of cash flows] | |||||||||||||
| Cash flow from operating activities | 347 | 126 | 297 | 129 | 573 | 89 | 908 | 549 | 803 | 648 | 284 | 736 | |
| Cash flow from investing activities | -167 | -99 | -227 | -263 | 99 | -235 | -185 | -115 | 42 | -145 | -291 | -758 | |
| Cash flow from financing activities | -126 | -126 | -122 | -151 | -107 | -109 | -85 | -85 | -97 | -420 | -236 | -201 | |
| Net increase in cash and cash equiv. | 61 | -97 | -52 | -285 | 549 | -264 | 684 | 348 | 743 | 95 | -218 | -210 | |
| Cash and cash equiv. at beginning of period | 1,471 | 1,532 | 1,435 | 1,383 | 1,098 | 1,648 | 1,383 | 2,068 | 2,416 | 3,159 | 3,255 | 3,036 | |
| Cash and cash equiv. at end of period | 1,532 | 1,435 | 1,383 | 1,098 | 1,648 | 1,383 | 2,068 | 2,416 | 3,159 | 3,255 | 3,036 | 2,826 | |
| FCF | 180 | 27 | 70 | -134 | 672 | -146 | 723 | 434 | 845 | 503 | -7 | -22 |