2026-04-02
Home
Japanese

Omega Investment Co., Ltd.
Hamee (Company note – 4Q update)

| Share price (7/18) | ¥1,156 | Dividend Yield (25/4 CE) | 1.9 % |
| 52weeks high/low | ¥1,425 / 813 | ROE(24/4) | 11.9 % |
| Avg Vol (3 month) | 73 thou shrs | Operating margin (24/4) | 10.9 % |
| Market Cap | ¥18.8 bn | Beta (5Y Monthly) | 1.7 |
| Enterprise Value | ¥16.6 bn | Shares Outstanding | 16.3 mn shrs |
| PER (25/4 CE) | 13.8 X | Listed market | TSE Standard |
| PBR (24/4 act) | 1.8 X |
| Click here for the PDF version of this page |
| PDF Version |
To increase sales and profits for the second consecutive year. Re-acceleration of growth awaited.
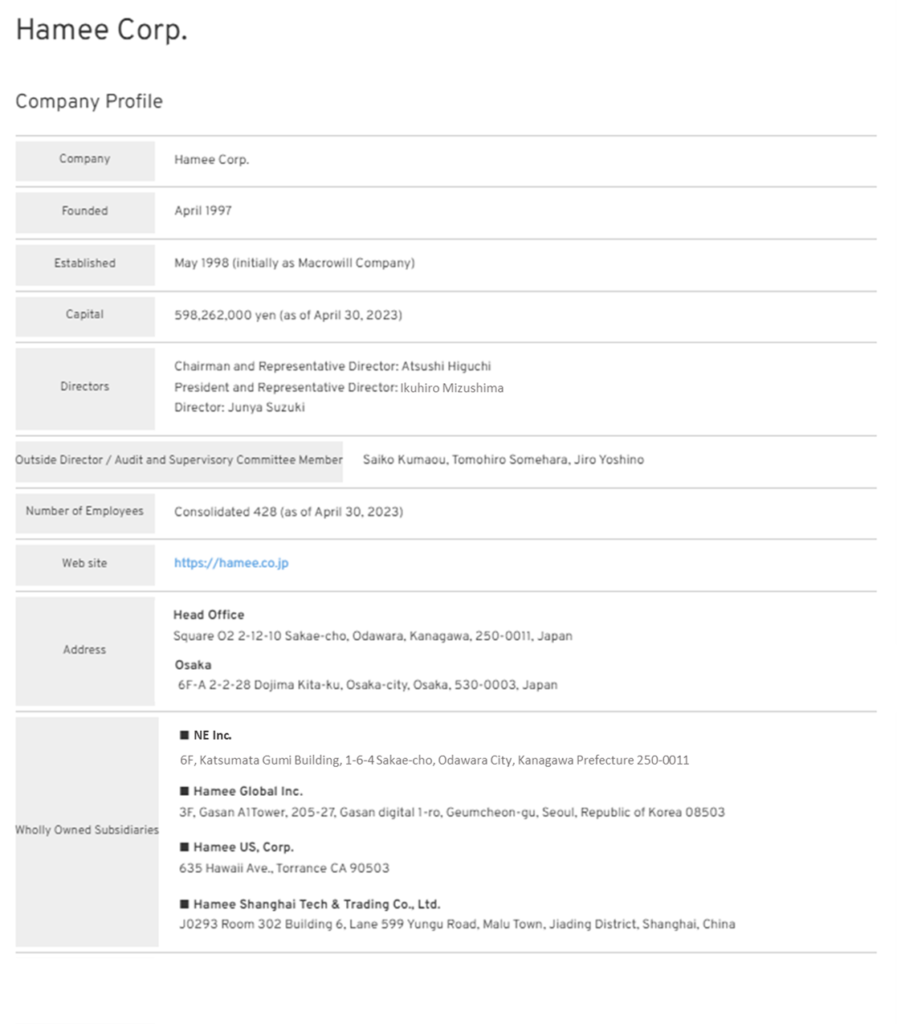
Company profile
◇Hamee Corp. was founded in 1997, went public on the TSE Mothers in 2015 and is currently listed on the Standard Market. The company operates through the Spin-off of two segments. Commerce Segment, which includes Mobile Accessories, Gaming Accessories Business, Cosmetics Business, and Global Business. The Platform Segment is mainly engaged in the provision of cloud-based (SaaS) EC Attractions “NextEngine”, which automates operations related to online shop management and enables cross-mall, multi-store order processing and centralised inventory management.
The company plans the following reorganisation by 2025. NE Inc., which is responsible for the Platform Segment, will be spun off in a share-distribution-type spin-off, with the current shareholders of the company becoming shareholders of both the company and NE Inc. in the future. Furthermore, NE Inc. will be listed on the stock exchange. The aim is to avoid a conglomerate discount and to ensure that the potential of the two businesses is reflected in the share price in an appropriate and timely manner.
Financial results and future highlights
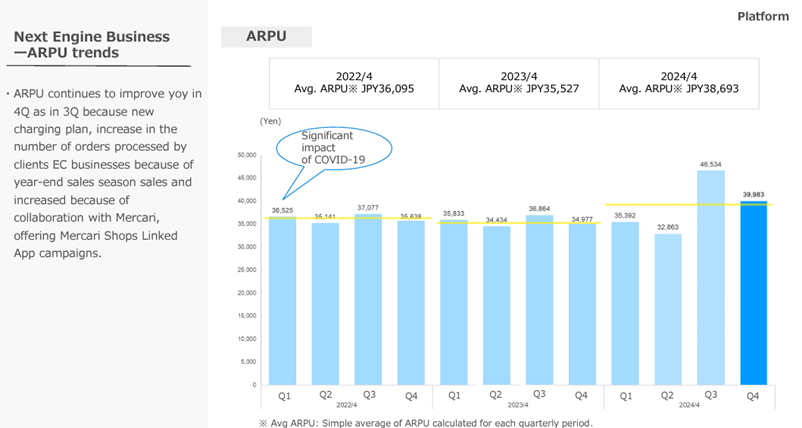
◇ FY04/2024 results: net sales of JPY 17.61 billion (+25% YoY), operating income of JPY 1.91 billion (+50% YoY), ordinary income of JPY 2.01 billion (+44% YoY) and net profit attributable to owners of parent company of JPY 1.12 billion (+18% YoY), all exceeding the revised full-year forecasts as of Q3 with both sales and profits increasing significantly. Both the Commerce Segment and the Platform Segment recorded increases in revenue and profit. In the former, each segment performed well, with Cosmetics Business in particular returning to an operating profit in Q4. The latter continues to generate high profits as the number of Next Engine Business clients grows and the churn rate remains low, while APRU improves as a result of the service’s price revision and the additional revenues associated with the sales collaboration with Mercari.
◇Revised forecasts for FY04/2025 and Mid-term management plan: net sales JPY 19.74 billion (+12% YoY), operating income JPY 2.08 billion (+8% YoY), ordinary income JPY 2.05 billion (+1% YoY), net profit attributable to owners of parent JPY 1.36 billion (+21% YoY). Growth in operating income margin and ordinary income is modest. Note that operating income has been revised downwards compared to the forecasts revealed in June 2023 (net sales of JPY 19.40 billion and operating income of JPY 2.75 billion).
In conjunction with the announcement of the results, the target figures for the medium-term plan announced in June 2023 were revised. While it is assumed that the trend of increasing sales and profits will continue, the targets for FY04/2026 have been revised upwards from JPY 22.51 billion to JPY 24.05 billion for net sales and downwards from JPY 3.32 billion to JPY 3.03 billion for operating income.
◇Stock price trend and future focus: The share price fell sharply following the announcement of these results and has since been consolidating at lower prices. This move reflects the fact that the company’s operating income forecasts for the current and next fiscal years have been revised down, particularly for the Platform Segment, which is a key indicator to value the shares.
However, the long-term uptrend from January 2016 and the medium-term uptrend from January 2023 onwards continue, and the company’s growth expectations remain unchanged.
The two most important factors to watch going forward are (1) the Cosmetics Business in the Commerce Segment turning profitable for the full year and becoming a stable growth structure with multiple drivers, and (2) the NextEngine Business in the Platform Segment steadily growing in the number of orders received, consolidating its position as a platformer and re-accelerating its growth.
Table of contents
| Summary | 1 |
| Key financial data | 2 |
| Full year results for FY04/2024 | 3 |
| Corporate forecast for FY04/2025 and updated Mid-term management plan | 7 |
| Share price trend | 9 |
| Points of interest | 10 |
| Financial results | 11 |
| Useful information | 13 |
Key financial data
| Fiscal Year | FY04/2017 | FY04/2018 | FY04/2019 | FY04/2020 | FY04/2021 | FY04/2022 | FY04/2023 | FY04/2024 | |
| Net sales | JPY, mn | 8,502 | 9,377 | 10,303 | 11,325 | 12,364 | 13,413 | 14,038 | 17,612 |
| Ordinary profit | JPY, mn | 1,048 | 1,267 | 1,179 | 1,757 | 2,149 | 2,330 | 1,400 | 2,019 |
| Net profit attributable to owners | JPY, mn | 696 | 873 | 821 | 1,069 | 1,556 | 1,744 | 945 | 1,122 |
| Number of shares outstanding | Shares, mn | 15.8 | 16.1 | 16.1 | 16.1 | 16.3 | 16.3 | 16.3 | 16.3 |
| Net asset | JPY, mn | 2,756 | 3,597 | 4,189 | 4,824 | 6,528 | 8,253 | 8,961 | 10,157 |
| Total asset | JPY, mn | 4,240 | 5,042 | 5,761 | 8,097 | 8,339 | 10,518 | 12,320 | 14,512 |
| Book value per share | JPY | 170 | 216 | 254 | 297 | 405 | 513 | 557 | 632 |
| EPS | JPY | 44 | 55 | 51 | 67 | 98 | 110 | 59 | 70 |
| Equity to asset | % | 64 | 69 | 70 | 58 | 77 | 78 | 72 | 69 |
| ROE | % | 30 | 28 | 22 | 25 | 28 | 24 | 11 | 12 |
| Cash flow from operating activities | JPY, mn | 576 | 1,246 | 651 | 1,934 | 1,941 | 1,186 | 695 | 886 |
| Cash flow from investing activities | JPY, mn | -433 | -674 | -671 | -1,020 | -412 | -886 | -1,507 | -877 |
| Cash flow from financing activities | JPY, mn | 69 | -230 | -7 | 933 | -1,736 | 298 | 263 | 380 |
| Cash and cash equivalents at end of period | JPY, mn | 1,324 | 1,695 | 1,660 | 3,453 | 3,355 | 4,026 | 3,536 | 4,022 |
| Number of employees | Person | 233 | 285 | 309 | 353 | 387 | 403 | 428 | 463 |
Source: Omega Investment from company data, rounded to the nearest whole number
Full year results for FY04/2024
Hamee Corp. announced its FY04/2024 results after the close of business on 14 June 2024.
Significant increase in sales and profits, beating the revised forecasts
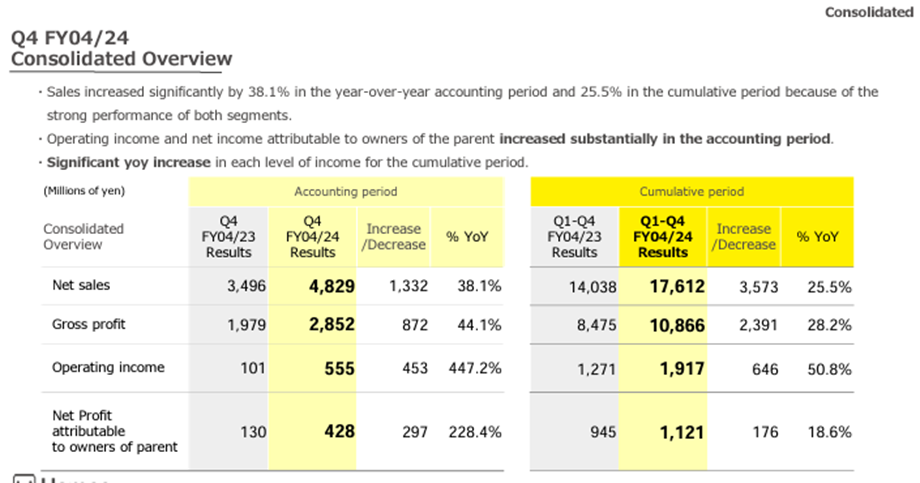
Net sales were JPY 17.61 billion (+25% YoY), operating income JPY 1.91 billion (+50% YoY), ordinary income JPY 2.01 billion (+44% YoY) and net profit attributable to owners of parent JPY 1.12 billion (+18% YoY). All of these results exceeded the revised full-year plan as of Q3, with a significant increase in sales and profits.
Both the Commerce Segment and Platform Segment recorded increases in both revenue and profit, and profit margins also improved.
The dividend per share remained unchanged at JPY 22.5 a share, while the balance sheet showed an increase in merchandise inventories.
Source: Omega Investment from company materials
Source: Omega Investment from company materials
Commerce Segment
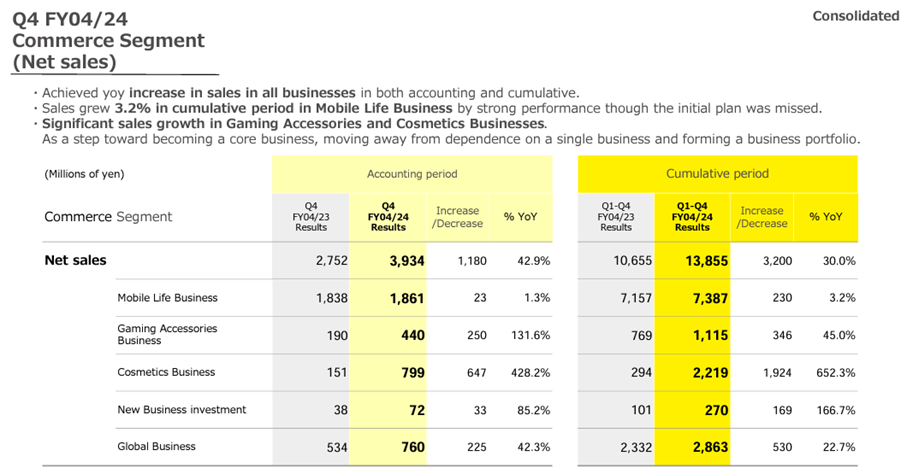
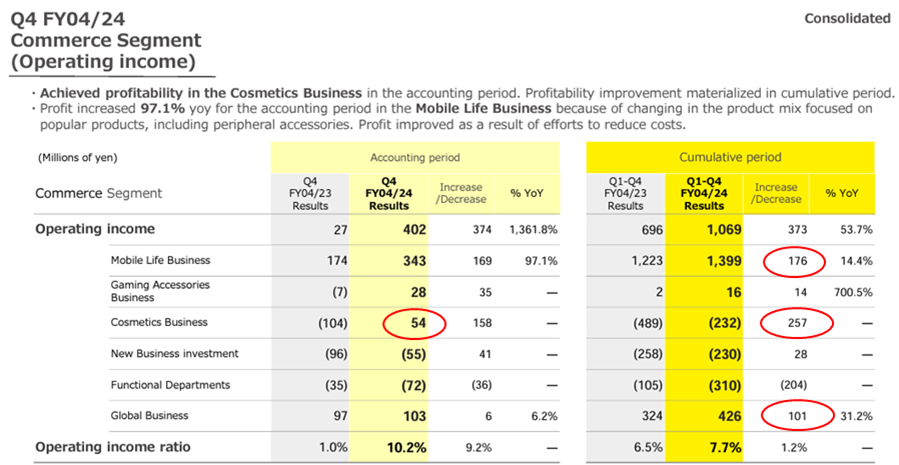
The five constituent businesses all saw an increase in sales, with the Cosmetics Business returning to operating income in Q4.
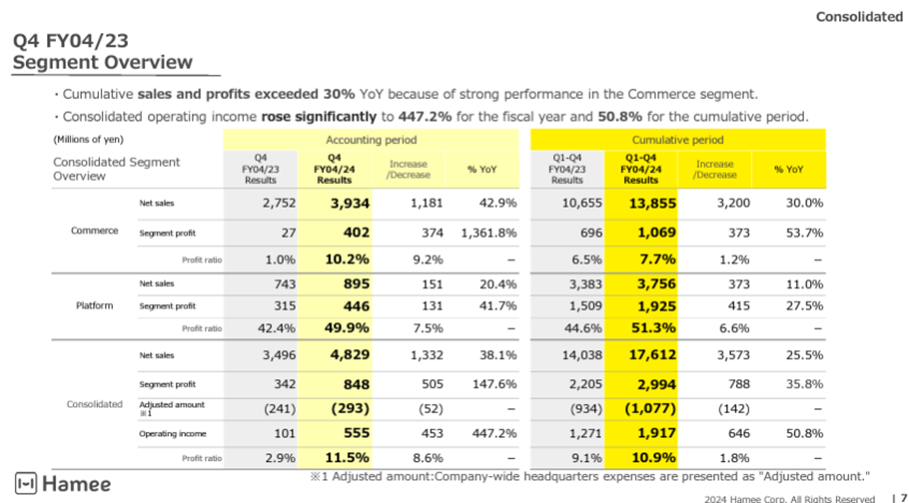
Net sales were JPY 13.85 billion (+30% YoY) and operating income was JPY 1.06 billion (+53% YoY).
The growth was driven by the Cosmetics Business (JPY 2.21 billion, +652% YoY), Global Business (JPY 2.86 billion, +22% YoY), followed by the Gaming Accessories Business (JPY 1.11 billion, +45% YoY), with the Mobile Life Business also performing well.
Operating income benefited from improved profitability in the Cosmetics Business, a contribution from product mix management and cost reductions in the Mobile Life Business, and higher profits in the Global Business. The Gaming Accessories Business also improved its profitability due to the successful expansion of its product line-up. The Cosmetics Business now handles more than 5,000 shops, and its operating income achieved a long-awaited return to profitability in Q4.
Overall, the Commerce Segment as a whole appears to be on a resilient growth trajectory, with each of its businesses making progress in growth and improving profitability.
Source: Omega Investment from company materials
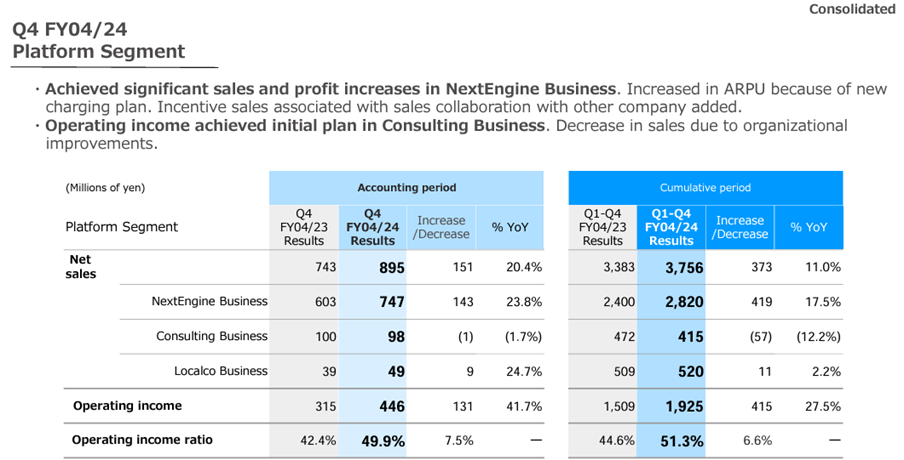
Platform Segment
Full-year net sales were JPY 3.75 billion (+11% YoY), operating income was JPY 1.92 billion (+27% YoY) and operating income margin was 51.3% (+6.6 points improvement YoY).
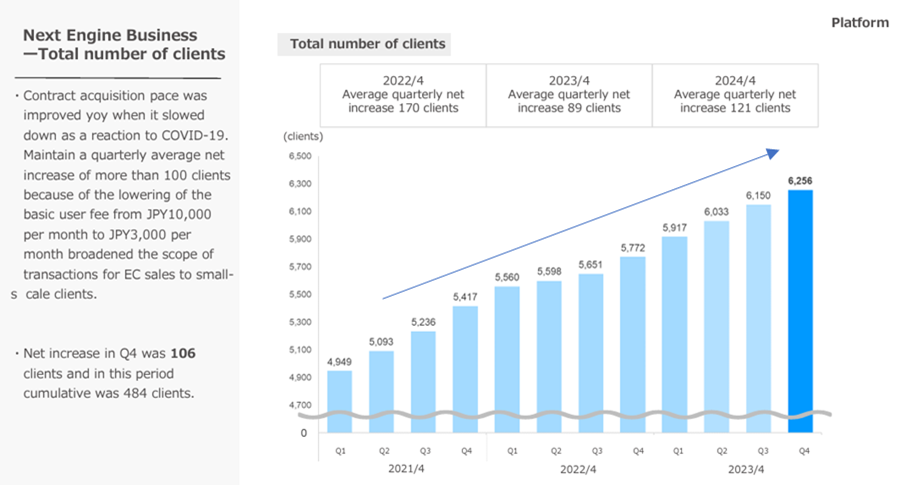
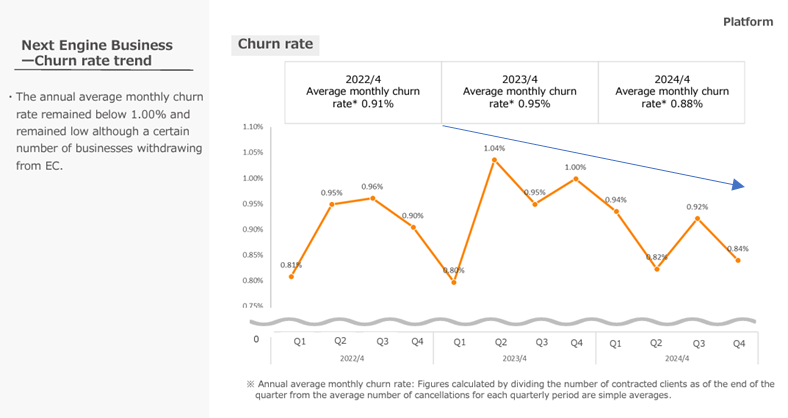
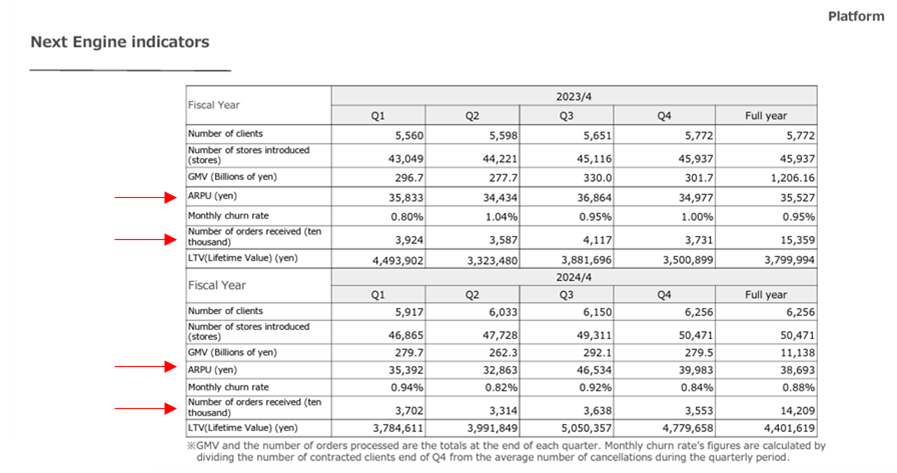
In the mainstay NextEngine Business, the number of clients grew steadily, but the number of orders received declined. This is thought to be due to sluggish growth in the e-commerce market handled by the company’s clients. In response, the company has improved its APRU by revising service prices and promoting sales cooperation with Mercari, thereby counteracting the impact of the decline in the number of orders received.
Source: Omega Investment from company materials
Platform Segment
Source: Omega Investment from company materials
Corporate forecast for FY04/2025 and updated Mid-term management plan
Revised plans for the next two years. Sales and profits to continue to increase, but profit forecasts revised downwards.
In the current accounts, the company has revised its Mid-term management plan published on 14 June 2023 and has published its forecasts for the next two years. The plan is for continued increases in sales and profits and is summarised as follows.
Source: Omega Investment from company materials
Points of interest include;
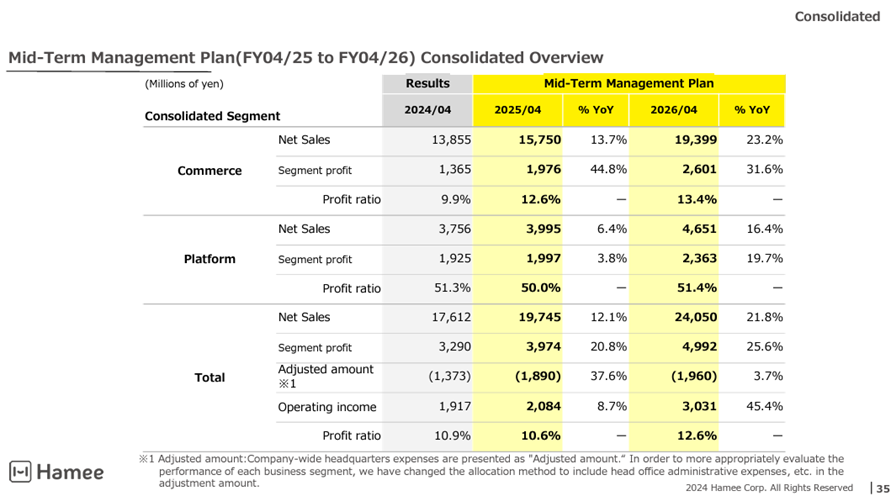
1. Driven by Commerce Segment, increase in inter-segment adjustments: operating income is planned to increase by JPY 1.11 billion from FY04/2024 to FY04/2026, broken down as follows: increase in Commerce Segment by JPY 1.23 billion, increase in Platform Segment by JPY 0.46 billion, and increase in expenses due to adjustments of JPY 0.58 billion. In other words, the Commerce Segment is expected to contribute more and the adjustments are larger.
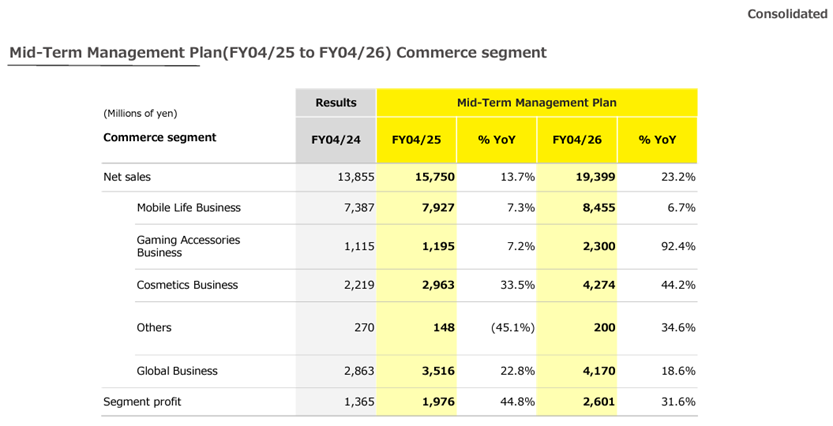
2. Cosmetics becoming a mainstay business, Commerce Segment taking off in all major businesses: in the profit-driven Commerce Segment, in addition to steady growth in the Mobile Life Business, the Cosmetics Business is planned to become a mainstay business, the Global Business to grow at a high rate and the Gaming Accessories Business to deliver rising growth. As a result, the segment profit margin will improve from 9.9 per cent in FY04/2024 to 13.4 per cent.
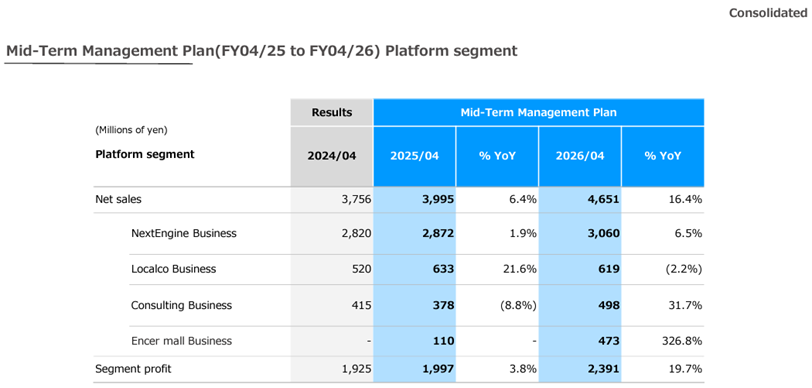
3. Growth in the Platform Segment to slow down: The Platform Segment also plans to continue to increase sales and profits. However, the company’s forecast for FY04/2025 is net sales of JPY 3.99 billion (+6% YoY), operating income of JPY 1.99 billion (+3% YoY) and segment income margin of 50.0% (- 1.3 points YoY), which means that growth will decelerate once more. The main reason for this is that in the NextEngine Business, the effect of the ARPU increase from the sales collaboration with Mercari, which contributed from Q3 FY04/2024 onwards, will have run its course, and net sales in this business will remain at JPY 2.87 billion (+1% YoY). Excluding this effect, the company estimates a net sales growth rate of +8.4% for the NextEngine Business. In FY04/2026, the company expects the NextEngine Business to see net sales growth accelerate again, the Consulting Business to expand and the Encer mall Business to start up in earnest, leading to double-digit growth in sales and profit for the segment as a whole.
4. Increase in segment profit adjustments: the difference between total segment profit and consolidated operating income is the adjustment (company-wide HQ costs). This figure increased significantly from FY04/2024 Results (JPY 1.37 billion) to JPY 1.89 billion in FY04/2025 and JPY 1.96 billion in FY04/2026 in the Mid-term management plan. While there is no full disclosure of this increase, based on discussions with the company, it appears that it includes increased costs essential for reorganisation (share-distribution-type spin-off and listing of NE Inc.), as well as planned strategic expenditure. The incurrence of these costs should be closely monitored, as they represent a significant weighting of the consolidated operating income.
5. lower operating income and ordinary income growth margins in the company’s forecast for FY04/2025: Based on the above, the company’s forecast for FY04/2025 is net sales of JPY 19.74 billion (+12% YoY), operating income of JPY 2.08 billion (+8% YoY), ordinary income of JPY 2.05 billion (+1% YoY) and net profit attributable to owners of parent company of JPY 1.36 billion (+21% YoY), which means that the growth rate of operating income and ordinary income will decline.
6. Operating income forecast revised down: a comparison of before and after the Mid-term management plan update shows that consolidated net sales have been revised up for both FY04/2025 and FY04/2026, but consolidated operating income has been revised down for both, and the operating income margin has also been revised down.
Share price trend
Hamee share price trends
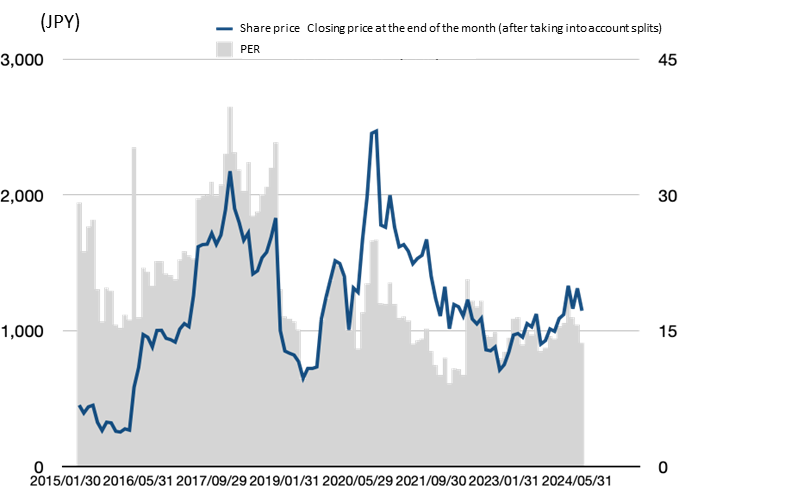
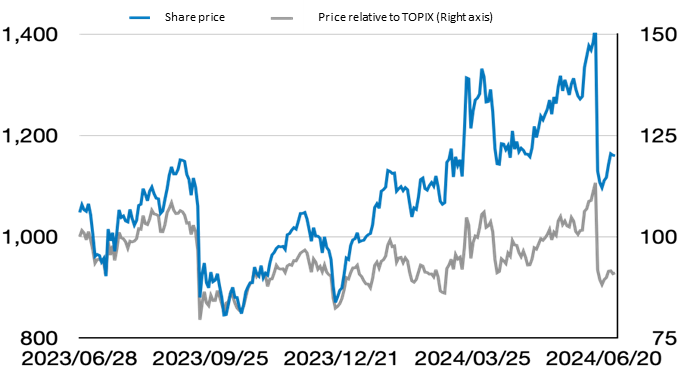
The upper graph shows the company’s share price closing price at the end of the month and PER over time, while the lower graph shows the daily share price movements over the past year.
As the lower graph shows, the share price fell sharply following the announcement of the results and has since consolidated at a lower level. As the upper graph shows, the PER has fallen from the high 10x range to the low 10x range.
This can be understood as a move to factor in the downward revision of operating income forecasts for this and next year, and in particular the downward revision of the operating income forecast for the Platform Business, a key valuation indicator, and a temporary pause in its growth rate.
However, the long-term uptrend since January 2016 and the medium-term uptrend from January 2023 onwards continue, and there is no significant change in growth expectations for the company.
Points of interest
The key to future share price formation is that both of the two businesses continue on a growth trajectory on their own, especially if the growth rate of the Platform Segment re-accelerates.
More specifically,
1. In the Commerce Segment, the Cosmetics Business will return to profitability for the full year and the segment will become a stable growth structure with multiple drivers
2. In the Platform Segment’s NextEngine Business, the number of orders received will grow steadily, consolidating its position as a platformer and re-accelerating profit growth.
3. The potential of the Platform Segment’s new Encer mall Business to grow into a new pillar driving the business valuation of the Platform Segment should lead to a full-fledged rebound in the share price.
Note: The Encer mall business is a wholesale marketplace that connects manufacturers with e-commerce shops and other retailers and was released in beta version in January 2024. This business model involves charging for GMV and is expected to be officially released in FY04/2025.
Financial results
Full-year financial results
Financial period |
FY04/2017 |
FY04/2018 |
FY04/2019 |
FY04/2020 |
FY04/2021 |
FY04/2022 |
FY04/2023 |
FY04/2024 |
FY04/2025 |
FY04/2026 |
Consolidated,Japanese GAAP |
Company
|
Medium-term
|
Medium-term
|
|||||||
[Statements of income] |
||||||||||
Net sales |
8,502 |
9,377 |
10,303 |
11,325 |
12,364 |
13,413 |
14,038 |
17,612 |
19,745 |
24,050 |
Operating income |
1,106 |
1,380 |
1,164 |
1,745 |
2,180 |
2,202 |
1,271 |
1,917 |
2,084 |
3,031 |
Ordinary profit |
1,048 |
1,267 |
1,179 |
1,757 |
2,149 |
2,330 |
1,400 |
2,019 |
||
Net profit before income taxes |
1,010 |
1,259 |
1,179 |
1,582 |
2,144 |
2,463 |
1,396 |
2,009 |
||
Net profit attributable to owners of the parent |
696 |
873 |
821 |
1,069 |
1,556 |
1,744 |
945 |
1,122 |
||
[Balance Sheets] |
||||||||||
Total assets |
4,240 |
5,042 |
5,761 |
8,097 |
8,339 |
10,518 |
12,320 |
14,512 |
||
Total liabilities |
1,484 |
1,445 |
1,572 |
3,272 |
1,811 |
2,265 |
3,360 |
4,355 |
||
Total net assets |
2,756 |
3,597 |
4,189 |
4,824 |
6,528 |
8,253 |
8,961 |
10,157 |
||
Total borrowings |
468 |
298 |
500 |
1,740 |
104 |
544 |
1,300 |
2,197 |
||
[Statements of cash flows] |
||||||||||
Cash flow from operating activities |
576 |
1,246 |
651 |
1,934 |
1,941 |
1,186 |
695 |
886 |
||
Cash flow from investing activities |
-433 |
-674 |
-671 |
-1,020 |
-412 |
-886 |
-1,507 |
-877 |
||
Cash flow from financing activities |
69 |
-230 |
-7 |
933 |
-1,736 |
298 |
263 |
380 |
||
Cash and cash equivalents at end of period |
1,324 |
1,695 |
1,660 |
3,453 |
3,355 |
4,026 |
3,536 |
4,022 |
||
[Efficiency] |
||||||||||
Ratio of ordinary profit to sales |
12% |
14% |
11% |
16% |
17% |
17% |
10% |
11% |
||
ROA |
19% |
15% |
15% |
19% |
18% |
8% |
8% |
|||
ROE |
30% |
28% |
22% |
25% |
28% |
24% |
11% |
12% |
||
[Per-share] Unit : JPY |
||||||||||
EPS |
44 |
55 |
51 |
67 |
98 |
110 |
59 |
70 |
||
BPS |
170 |
216 |
254 |
297 |
405 |
513 |
557 |
632 |
||
DPS |
4.5 |
5.5 |
6.5 |
7.0 |
10.0 |
22.5 |
22.5 |
22.5 |
||
[Number of employees] |
||||||||||
Number of consolidated employees |
233 |
285 |
309 |
353 |
387 |
403 |
428 |
463 |
Source: Omega Investment from company materials.
Rounding half up
Key PL items
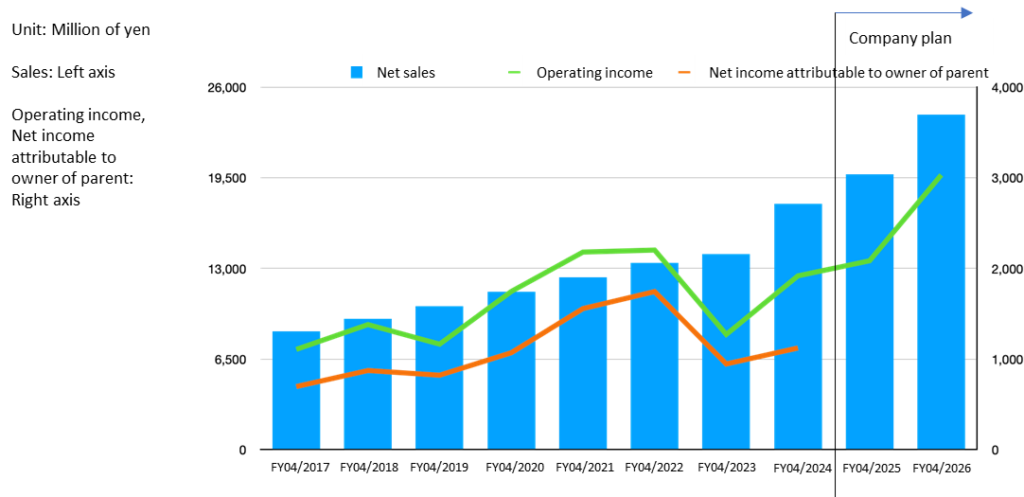
Sales, operating margin, and ROE
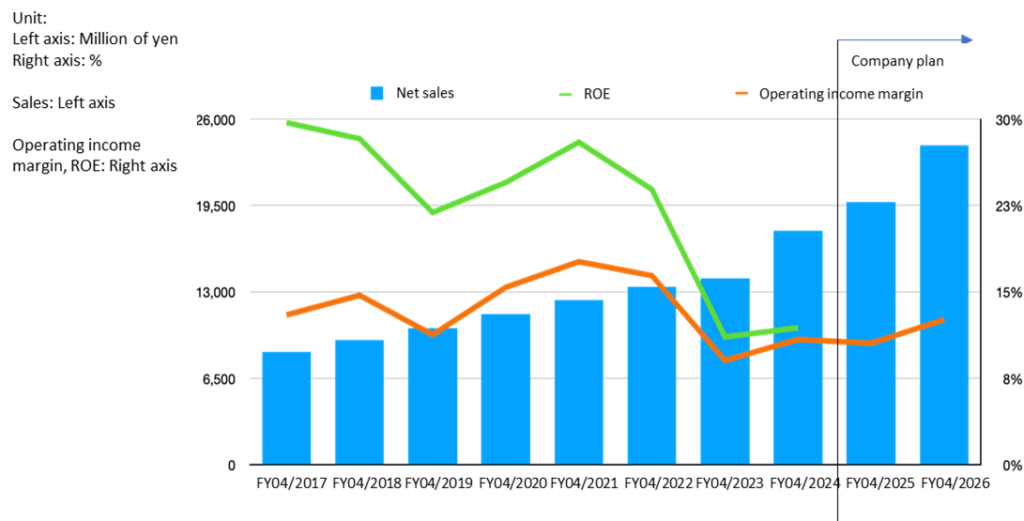
Source: Omega Investment from company materials
Useful information
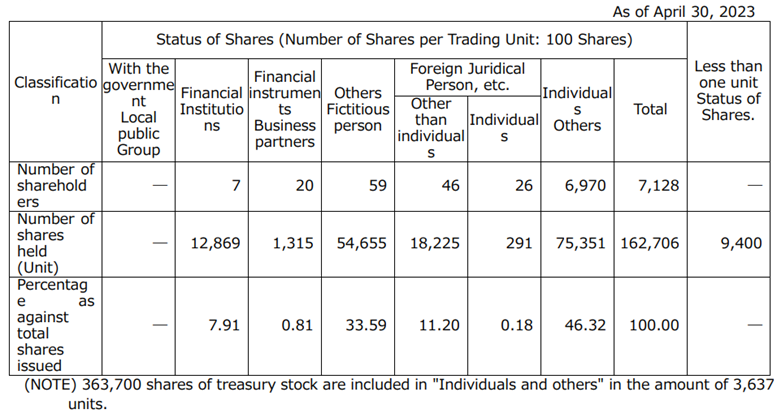
Principal shareholders
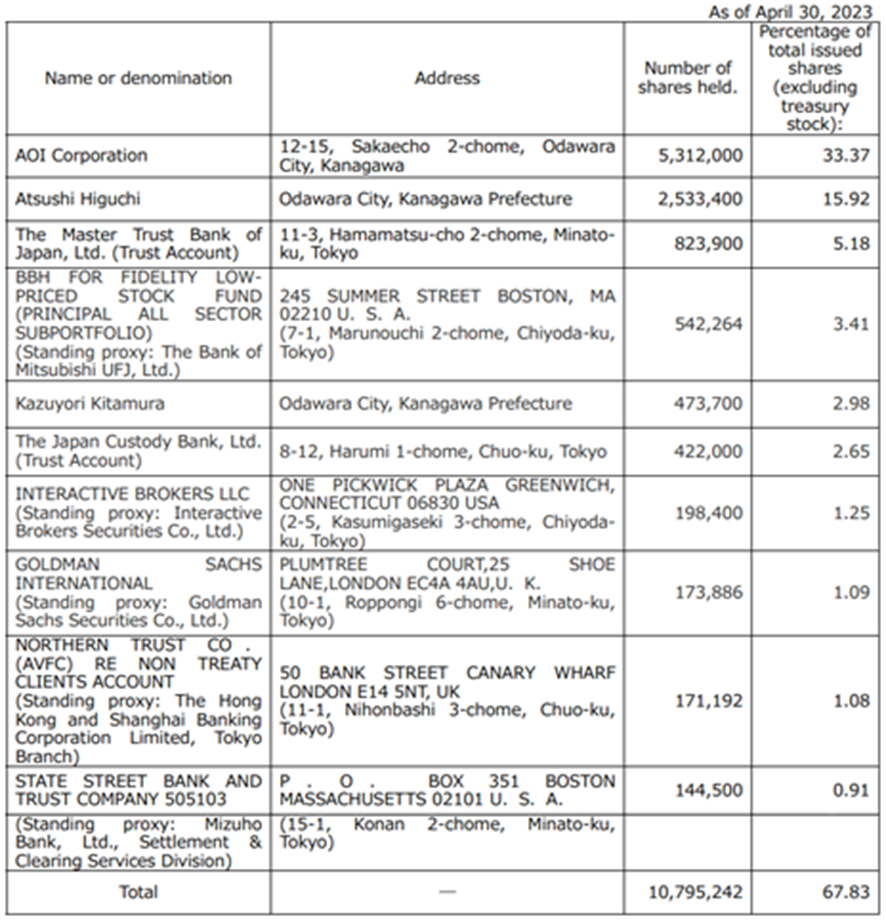
Shareholder composition