2026-04-10
Home
Japanese

Omega Investment Co., Ltd.
BlueMeme (Company note – 4Q update)

| Share price (7/18) | ¥1,230 | Dividend Yield (25/3 CE) | – % |
| 52weeks high/low | ¥2,350 / 1,029 | ROE(24/3 act) | 6.6 % |
| Avg Vol (3 month) | 4.4 thou shrs | Operating margin (24/3 act) | 10.1 % |
| Market Cap | ¥4.4 bn | Beta (5Y Monthly) | NA |
| Enterprise Value | ¥1.9 bn | Shares Outstanding | 3.420 mn shrs |
| PER (25/3 CE) | 22.0 X | Listed market | TSE Growth |
| PBR (24/3 act) | 1.61 X |
| Click here for the PDF version of this page |
| PDF Version |
A year to wait for the results of Digital Labor investments
◇BlueMeme (hereafter referred to as the Company) is a pioneer in Japan in the development of ‘low-code agile methods’ and was the first company in Japan to introduce ‘OutSystems’ low-code technology after its foundation in 2006 and has been providing system development services based on this technology. The company is actively investing in promoting its unique automation concept called ‘Digital Labor’. This initiative is expected to overcome the issue of the shortage and uneven distribution of IT personnel in Japan and accelerate DX initiatives not only in large companies but also in small and medium-sized enterprises while at the same time improving the company’s productivity. As a result, the company expects its revenues to grow dramatically when the development of Digital Labor technology moves into the payback phase.
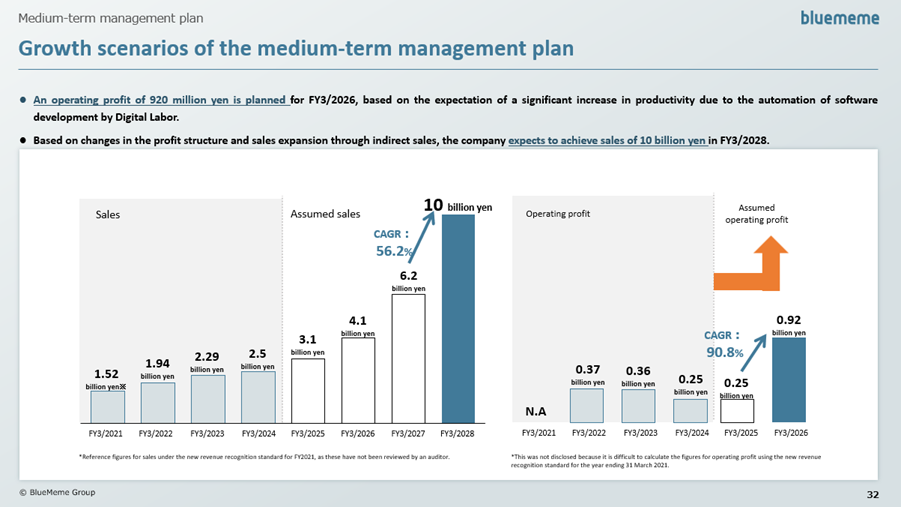
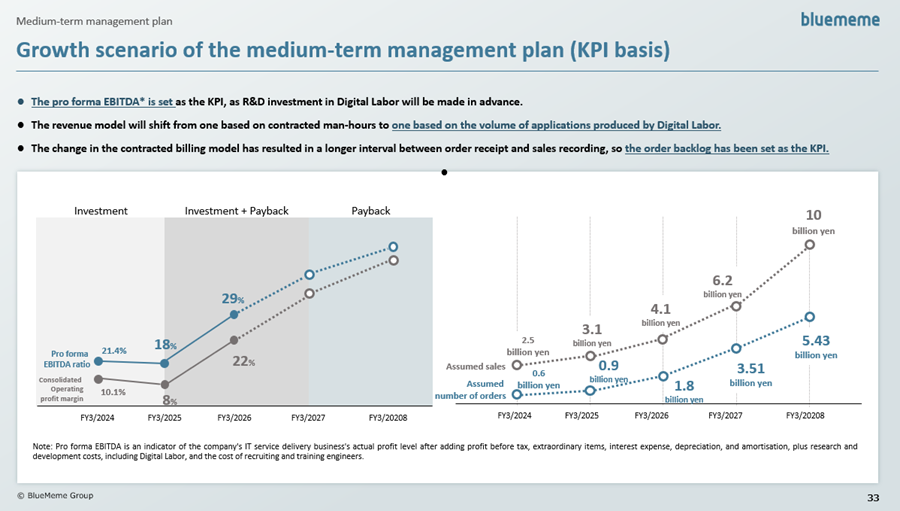
◇Growth strategy: According to the medium-term management plan (published 14 November 2023), the company aims to achieve sales of 4.1 billion yen, operating profit of 920 million yen and pro forma EBITDA of 1.19 billion yen in FY3/2026 when the development of Digital Labor is underway, and sales of 10 billion yen by FY3/2028 through full-scale application of Digital Labor and expansion of partner business. These targets have been maintained in the announcement of the latest results.
◇Corrections to previous years’ results: the company has published corrected figures for FY3/2022 and beyond due to some reasons, including the decision that it is appropriate to recognize revenue at the time of contract, whereas previously revenue was recognized in a single year for license transactions, including long-term contracts. However, the impact on profit and loss is limited.
◇Full-year results for FY3/2024: Full-year results for FY3/2024 show sales of 2.50 billion yen (+9.5% YoY) and operating profit of 250 million yen (-29.4% YoY), which is below the company’s forecasts. However, pro forma EBITDA (see note) exceeded forecasts, and the order backlog increased, so the actual situation is not bad. There was no significant change in cash on hand.
As previously reported, on 15 March 2024, the company announced the launch of an ‘Agile on Demand for OutSystems’ service using Digital Labor and that MITSUI KNOWLEDGE INDUSTRY Co., Ltd, the company’s largest shareholder, will start selling this service.
◇FY3/2025 company forecasts: The full-year company forecasts for FY3/2025 are net sales of 3.10 billion yen (+23.7% YoY), operating profit of 250 million yen (-1.2% YoY), ordinary profit of 250 million yen (-1.9% YoY), and net profit attributable to owners of parent of 200 million yen (+14.4 % YoY). These figures are inherited from the aforementioned medium-term management plan.
While sales are expected to increase due to increased orders, operating profit and ordinary profit are expected to remain essentially unchanged due to the continued burden of Digital Labor-related investments.
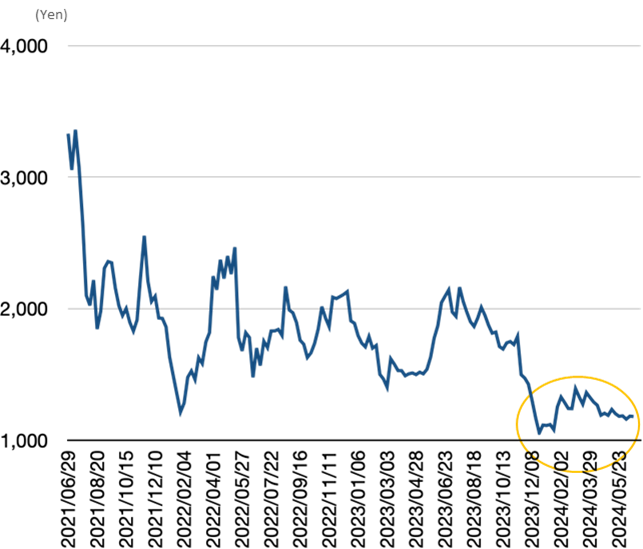
◇Share price trends and highlights: The share price once fell to 1,135 immediately after the announcement of Q3 results on 15 February 2024 but quickly rebounded to 1,499 yen. The share price then declined moderately and adjusted to 1,100 yen, but then rose slowly. After the announcement of the full-year results on 29 May, the share price fell again, but only temporarily, and quickly recovered to the 1,200 yen level.
In FY3/2025, the development of Digital Labor and other projects will climax, and these projects’ costs will put pressure on earnings. However, earnings are expected to enter a J-curve growth trajectory if this development proceeds smoothly. Therefore, for the share price to enter a full-fledged upward trajectory, it will be necessary to see an accelerated increase in ‘orders, sales and pro forma EBITDA’ each quarter while at the same time seeing this development burden peak out.
Note: Pro forma EBITDA is an indicator of the company’s IT service delivery business’s actual profit level after adding profit before tax, extraordinary items, interest expense, depreciation, and amortisation, plus research and development costs, including Digital Labour, and the cost of recruiting and training engineers.
Table of contents
| Summary | 1 |
| Key financial data | 2 |
| Correction of previous years’ results | 3 |
| FY3/2024 full-year results | 4 |
| FY3/2025 full-year forecast | 5 |
| Share price trends and the focus | 6 |
| Financial data | 8 |
Key financial data
| Fiscal Year | 2020/3 | 2021/3 | 2022/3 | 2023/3 | 2024/3 | 2025/3 (Forecast) |
| Net sales | 1,800 | 2,101 | 1,929 | 2,244 | 2, 506 | 3,100 |
| Cost of sales | 1,275 | 1,410 | 885 | 1,129 | 1,241 | – |
| Gross profit | 524 | 691 | 1,044 | 1,160 | 1,265 | – |
| SG&A expenses | 492 | 515 | 680 | 802 | 1,012 | – |
| Operating profit | 31 | 175 | 363 | 358 | 253 | 250 |
| Ordinary profit | 30 | 174 | 348 | 354 | 254 | 250 |
| Net profit | 10 | 130 | 253 | 259 | 174 | 200 |
| Current assets | 1,073 | 1,179 | 2,754 | 3,324 | 3,389 | – |
| Cash and deposits | 584 | 645 | 2,356 | 2,224 | 2,228 | – |
| Non-current assets | 199 | 206 | 201 | 206 | 344 | – |
| Total assets | 1,272 | 1,386 | 2,956 | 3,531 | 3,733 | – |
| Total liabilities | 914 | 862 | 601 | 819 | 1,071 | – |
| Total net assets | 358 | 523 | 2,354 | 2,659 | 2,609 | – |
| Equity ratio (%) | 28.1 | 37.8 | 79.6 | 75.3 | 69.9 | – |
| Cash flow from operating activities | 174 | 182 | 338 | 94 | 252 | – |
| Cash flow from investing activities | -13 | -21 | -9 | -46 | -106 | – |
| Cash flow from financing activities | 59 | -100 | 1,381 | -179 | -141 | – |
| Cash and cash equivalents at end of period | 584 | 645 | 2,356 | 2,224 | 2,228 | – |
| EPS | 5.15 | 62.49 | 78.48 | 74.00 | 50.49 | 58.34 |
| DPS | 0 | 0 | 0 | 0 | 0 | 0 |
| BPS | -168.57 | 190.38 | 688.72 | 750.50 | 762.93 |
Note: From FY3/2022, the new accounting standard for revenue recognition (new standard) is applied. Therefore, there is no continuity between FY3/2021 and FY3/2022 onwards.
Source: Omega Investment from company materials
Correction of previous years’ results
Correction of previous years’ results:
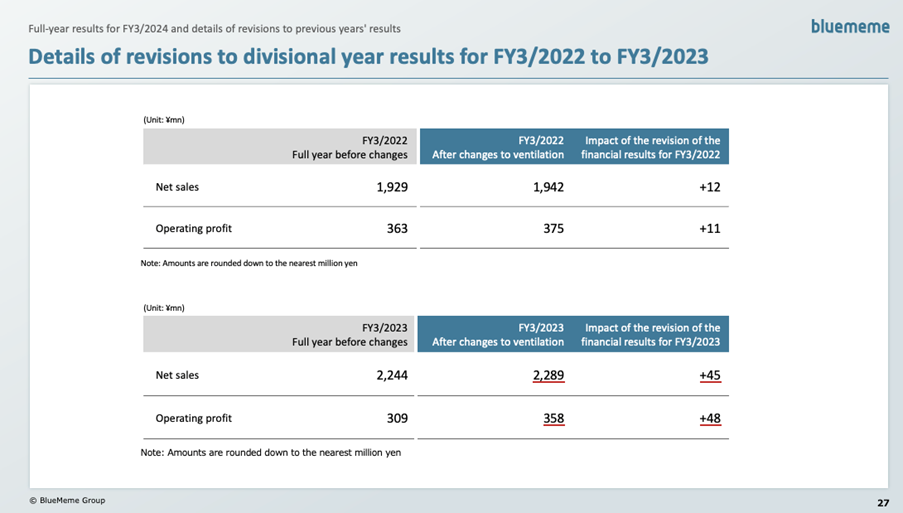
The company postponed the publication of its financial results on 14 May 2024 and announced corrections to its financial statements and prior years’ results on 29 May 2024. In addition, on 21 June 2024, the company announced partial corrections to the above two disclosures.
The reason for this postponement is that the company found it necessary to reconsider the accounting policy it should adopt for the recognition of revenue from software license sales in light of the Accounting Standard for Revenue Recognition (ASBJ Statement No. 29, 31 March 2020), which is effective from the beginning of the financial year ending 31 March 2022.
Specifically,
1. It was decided that the appropriate accounting treatment for license transactions involving long-term contracts was to recognize revenue collectively at the time of the contract. In contrast, revenue had previously been recognized on a single-year basis.
2. It was discovered that some transactions originally classified as software license sales had been aggregated and presented as professional services revenue.
As a result, it was decided that the financial reports and other documents for previous years should be amended.
This has resulted in revisions of profit and loss, net assets, and total assets. Quite simply, sales and profits have been recognized earlier than in previous years. Although the revision to total assets is somewhat large (up 14% from 2,876 million yen to 3,293 million yen in 3Q FY3/2024), the impact on profit and loss is limited, and no major change to the company’s valuation is considered necessary.
Source: Omega Investment from company materials
FY3/2024 full-year results
FY3/2024 full-year results: revenue and profit are below the company forecast, but KPIs are firm.
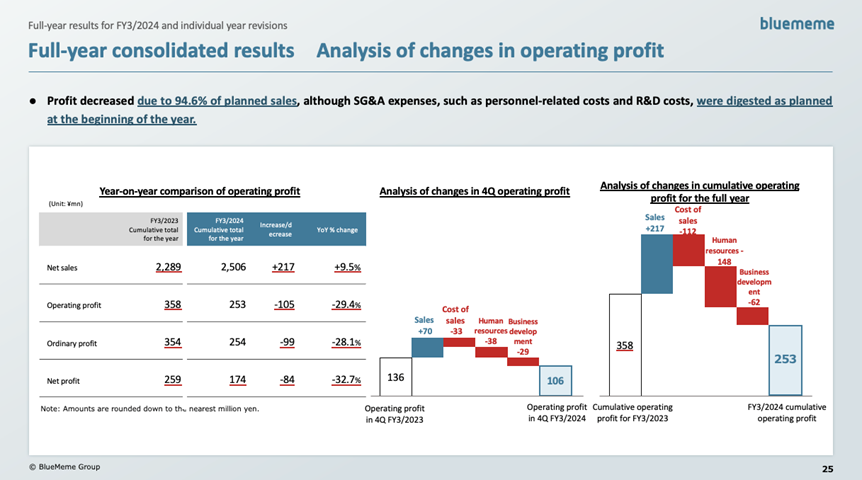
Full-year results for FY3/2024 show sales of 2.50 billion yen (+9.5% YoY) and operating profit of 250 million yen (-29.4% YoY), below the company’s forecasts.
According to the company, the number of customers increased as expected, but new customers tended to start with smaller projects, which resulted in sluggish growth in order unit prices. As a result, sales did not reach the company’s forecast despite the increase in revenue.
On the other hand, operating profit fell YoY and against the company’s forecasts due to personnel-related costs and research and development costs incurred as expected at the beginning of the year, despite the company’s efforts to improve operating efficiency.
Source: Omega Investment from company materials
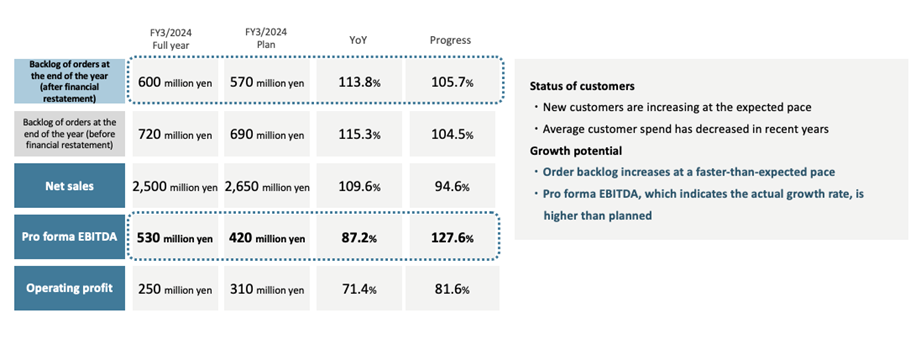
However, the actual situation is not bad, as pro forma EBITDA (see note) is higher than planned, and the order backlog is also increasing. The cash-on-hand balance has remained the same.
Note: Pro forma EBITDA is an indicator of the company’s IT service delivery business’s actual profit level after adding profit before tax, extraordinary items, interest expense, depreciation, and amortisation, plus research and development costs, including Digital Labor, and the cost of recruiting and training engineers.
FY3/2025 full-year forecast
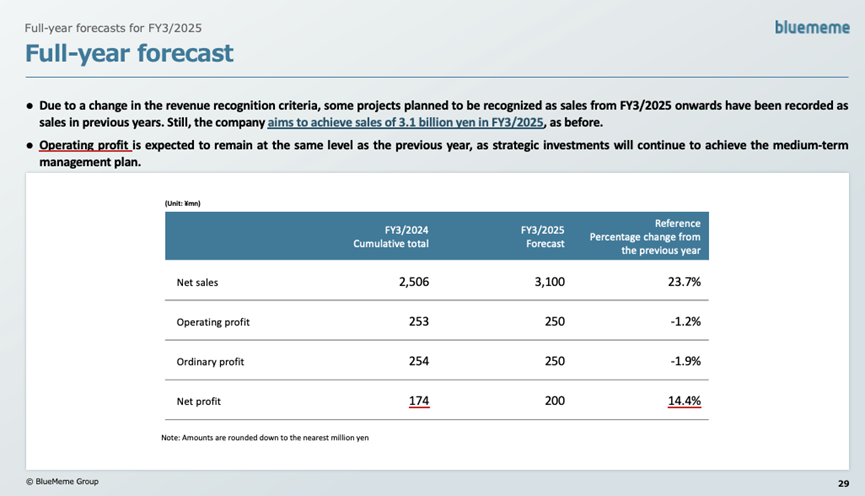
FY3/2025 full-year forecast:The company’s full-year forecasts for FY3/2025 are revenue of 3.10 billion yen (+23.7% y/y), operating profit of 250 million yen (-1.2% YoY), ordinary profit of 250 million yen (-1.9% YoY), and net profit attributable to owners of parent of 200 million yen (+14.4 % YoY). These figures were inherited from the aforementioned medium-term management plan.
While revenue is expected to increase due to increased orders, operating profit and ordinary profit are expected to remain essentially unchanged due to the continued burden of Digital Labor-related investments.
Overall, the company’s forecast contains a few surprises.
There is no disclosure on company forecasts for the first six months of FY3/2025.
Source: Omega Investment from company materials
Share price trends and the focus
Share Price Trend
The share price once fell to 1,135 immediately after the announcement of Q3 results on 15 February 2024 but quickly rebounded to 1,499. The share price then fell slowly and adjusted to 1,100 yen, but then rose steadily. After the announcement of the full-year results on 29 May, the share price fell again, but only temporarily, and quickly recovered to the 1,200 yen level.
Thus, the share price has recently consolidated, which should indicate that while investors appreciate the continued revenue growth and pro forma EBITDA growth, the visibility of investment results for Digital Labor has not increased sufficiently.
4069:BlueMeme share price move
Share price trends and the focus
Points of interest from here on
In FY3/2025, the development of Digital Labor and other projects will climax, and these projects’ costs will put pressure on earnings. However, earnings are expected to enter a J-curve growth trajectory if this development proceeds smoothly. Therefore, for the share price to enter a full-fledged upward trajectory, it will be necessary to see an accelerating increase in ‘orders, sales and pro forma EBITDA’ in the coming quarters while at the same time seeing this development burden peak out.
Source: Omega Investment from company materials
Source: Omega Investment from company materials
Financial data (full-year basis)
| FY(\mn) | 2019/3 | 2020/3 | 2021/3 | 2022/3 | 2023/3 | 2024/3 |
| [Statements of income] | ||||||
| Net sales | 1,496 | 1,800 | 2,101 | 1,942 | 2,289 | 2,506 |
| Year-on-year basis (%) | 95.7 | 20.2 | 16.8 | – | 17.9 | 9.5 |
| Cost of sales | 1,036 | 1,275 | 1,410 | 885 | 1,129 | 1,241 |
| Gross profit | 461 | 524 | 691 | 1,044 | 1,160 | 1,265 |
| Gross profit margin (%) | 30.8 | 29.2 | 32.9 | 54.1 | 50.7 | 50.4 |
| SG&A expenses | 374 | 492 | 515 | 680 | 802 | 1,012 |
| Operating profit | 87 | 31 | 175 | 375 | 358 | 253 |
| Year-on-year basis (%) | – | -63.2 | 446.9 | – | -4.5 | -29.4 |
| Operating profit ratio (%) | 5.8 | 1.8 | 8.3 | 19.3 | 15.6 | 10.1 |
| Non-operating income | 0 | 0 | 2 | 0 | 0 | 4 |
| Non-operating expenses | 1 | 1 | 3 | 15 | 3 | 2 |
| Ordinary profit | 86 | 30 | 174 | 355 | 354 | 254 |
| Ordinary profit margin (%) | 5.7 | 1.7 | 8.3 | 18.2 | -0.2 | 10.1 |
| Extraordinary income | 0 | 0 | – | – | – | |
| Extraordinary expenses | 19 | – | 11 | 2 | ||
| Income before income taxes | 67 | 30 | 174 | 348 | 342 | 252 |
| Total income taxes | 6 | 20 | 44 | 95 | 83 | 77 |
| Net income | 61 | 10 | 130 | 259 | 259 | 174 |
| Year-on-year basis (%) | -82.0 | 1,081.8 | – | 0.3 | -32.7 | |
| Net income ratio (%) | 4.1 | 0.6 | 6.2 | 13.3 | 11.3 | 6.9 |
| [Balance Sheets] | ||||||
| Current assets | 814 | 1,073 | 1,179 | 2,754 | 3,324 | 3,389 |
| Cash and deposits | 363 | 584 | 645 | 2,356 | 2,224 | 2,228 |
| Notes and accounts receivable – trade, and contract assets | 264 | 294 | 227 | 366 | 978 | 1,071 |
| Non-current assets | 202 | 199 | 206 | 201 | 206 | 344 |
| Property, plant and equipment | 116 | 105 | 92 | 91 | 80 | 153 |
| Intangible assets | 0 | 7 | 24 | 18 | 0 | 0 |
| Investments and other assets | 85 | 85 | 89 | 91 | 125 | 187 |
| Total assets | 1,016 | 1,272 | 1,386 | 2,956 | 3,531 | 3,733 |
| Current liabilities | 584 | 666 | 733 | 564 | 819 | 1,071 |
| Short-term borrowings | 235 | 135 | 116 | 96 | – | – |
| Non-current liabilities | 84 | 247 | 129 | 37 | 52 | 53 |
| Long-term borrowings | 53 | 212 | 96 | 4 | – | – |
| Total liabilities | 668 | 914 | 862 | 601 | 871 | 1,124 |
| Total net assets | 348 | 358 | 523 | 2,397 | 2,659 | 2,609 |
| Shareholders’ equity | 348 | 358 | 523 | 2,354 | 2,659 | 2,606 |
| Share capital | 189 | 188 | 206 | 962 | 970 | 971 |
| Capital surplus | 180 | 179 | 197 | 953 | 961 | 962 |
| Retained earnings | -21 | -10 | 120 | 439 | 742 | 917 |
| Treasury shares | -0 | -14 | -245 | |||
| Total liabilities and net assets | 1,016 | 1,272 | 1,386 | 3,350 | 3,531 | 3,733 |
| [Statements of cash flows] | ||||||
| Cash flow from operating activities | -65 | 174 | 182 | 338 | 94 | 252 |
| Cash flow from investing activities | -148 | -13 | -21 | –9 | -46 | -106 |
| Cash flow from financing activities | 279 | 59 | -100 | 1,381 | -179 | -141 |
| Free cash flow | -213 | 162 | 162 | 328 | 48 | 146 |
| Net increase in cash and cash equiv. | 66 | 221 | 61 | 1,710 | -131 | 3 |
| Cash and cash equiv. at beginning of period | 297 | 363 | 584 | 645 | 2,356 | 2,224 |
| Cash and cash equiv. at end of period | 363 | 584 | 645 | 2,356 | 2,224 | 2,228 |
Source: Omega Investment from company materials