2026-03-12
Home
Japanese

Omega Investment Co., Ltd.
TENPO INNOVATION (Company note – Full report)

Transition to a holdings company on October 1
Total cash dividends have grown at +31.5% CAGR since listing
| Click here for the PDF version of this page |
| PDF version |
SUMMARY
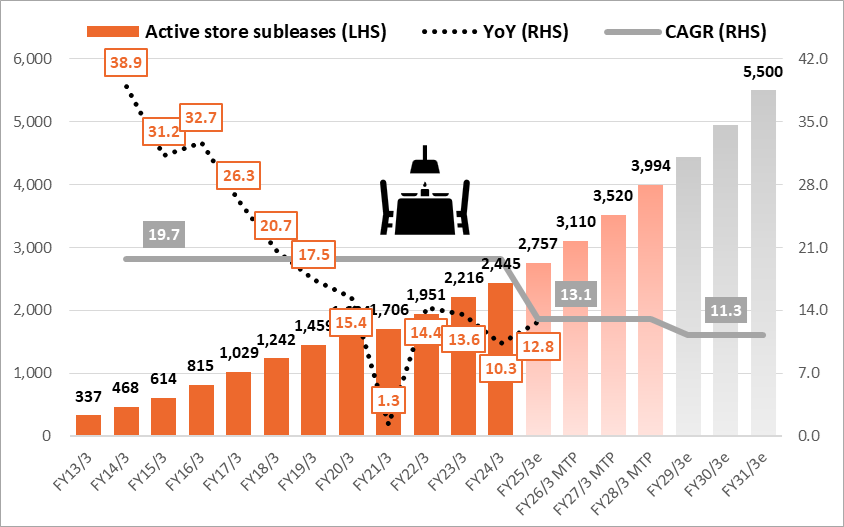
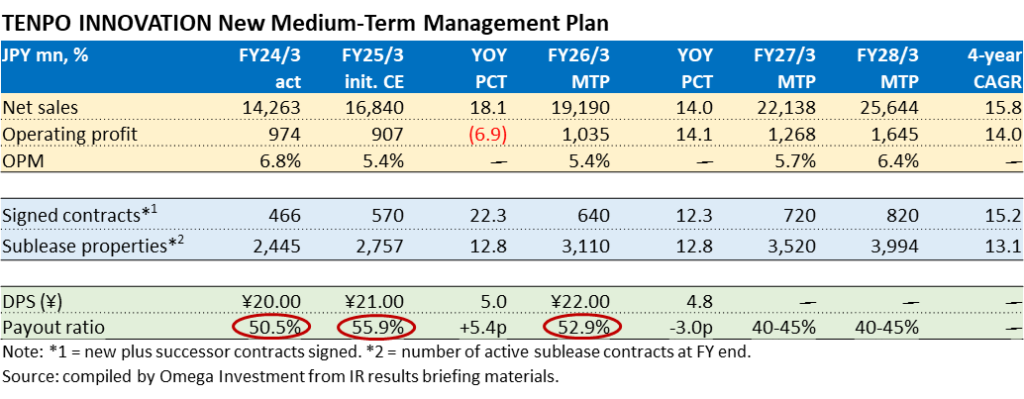
- By transitioning to a holding company structure, the holding company will oversee the management of the entire Group, while each subsidiary will focus on promoting its own business, thereby maximizing the corporate value of the Group. FY25/3 net sales are forecast to increase +18.1% YoY, driven by robust increases in signed contracts (new + successor) 466 → 570 (+22.3% YoY) and active sublease store properties 2,445 → 2,757 (+12.8% YoY). OP is forecast to decline another -6.9% YoY due to the impact of higher SG&A expenses accompanying the increase in headcount for aggressive expansion of each business. FY25/3 is positioned as a transition phase toward accelerating growth going forward, and profits will remain under pressure from upfront investments to strengthen the sales organization and support systems to secure the opportunity.
- From FY24/3, the Company announced a change to its dividend policy, effectively raising the target payout ratio from the 30% level to the 40% level. Since listing, total cash dividends have grown at +31.5% CAGR, with DOE topping 10% in FY24/3, and the payout ratio forecast to exceed 50% for the second consecutive year in FY25/3. While making the necessary investments to accelerate growth going forward, the Company is also strengthening shareholder returns as a priority management issue.
TENPOINNOVATION: Sustainable double-digit growth with high stability
Source: compiled by Omega Investment from IR results briefing materials.
Financial Indicators
| Share price (7/29) | 954 | 25.3 P/E (CE) | 25.4x |
| YH (24/1/4) | 1,050 | 25.3 EV/EBITDA (CE) | 13.2x |
| YL (24/5/30) | 835 | 24.3 ROE (act) | 20.5% |
| 10YH (23/3/10) | 1,340 | 24.3 ROIC (act) | 19.9% |
| 10YL (20/4/6) | 477 | 24.3 P/B (act) | 4.82x |
| Shrs out. (mn shrs) | 17.674 | 25.3 DY (CE) | 2.20% |
| Mkt cap (¥ bn) | 16.861 | | |
| EV (¥ bn) | 12.676 | | |
| Equity ratio (3/31) | 24.2% | | |
Omega Investment’s case for TENPO INNOVATION as an attractive opportunity
Over the last 7 fiscal years since listing in Oct-2017 through FY24/3, net sales have grown at +14.9% CAGR, OP has grown at +17.7% CAGR, and total cash dividends have grown at +31.5% CAGR, with DOE topping 10% in FY24/3, and the payout ratio forecast to exceed 50% for the second consecutive year in FY25/3. As can be seen from the graph on the bottom of P1, double-digit growth in active store sublease contracts is both remarkably stable and sustainable, uncorrelated with the underlying restaurant market, and this report examines TI’s business model strengths, and outlook under the new MTP.
TENPOINNOVATION Financial Highlights and Key Indicators
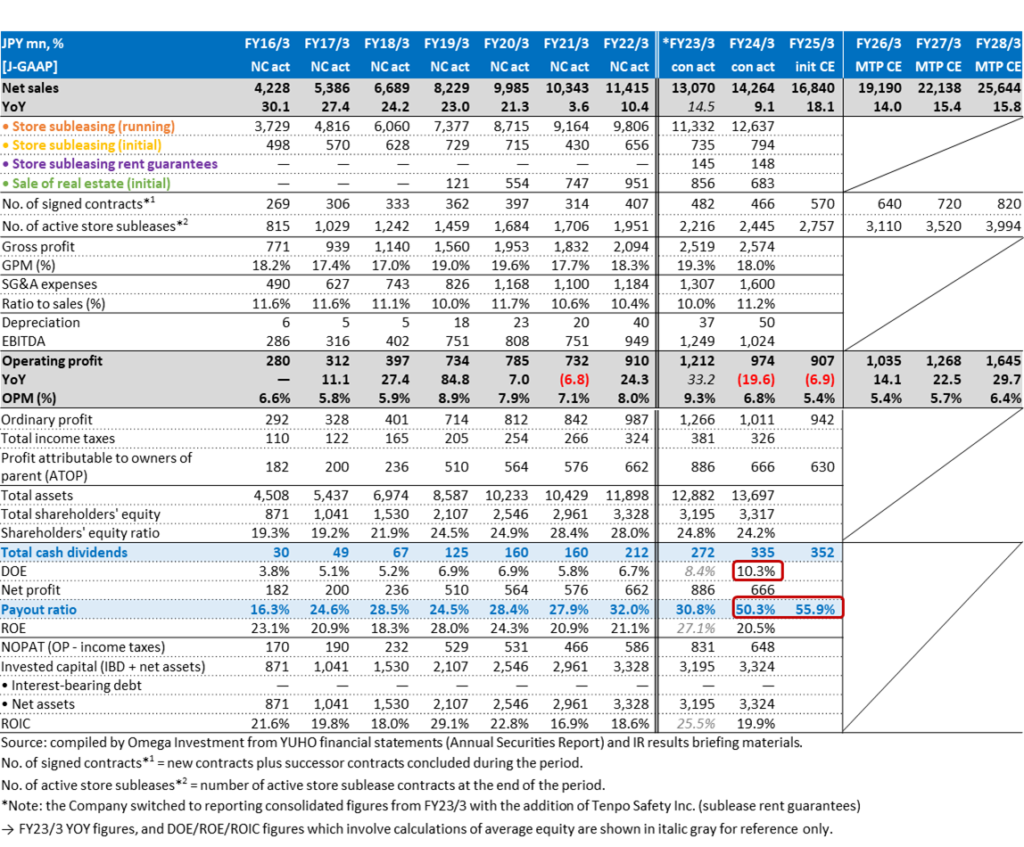
Table of Contents
| ❶ | INTRODUCTION | |
| Overview of Japan’s Food Service Industry, post-pandemic trends | 4 | |
| ❷ | BUSINESS OVERVIEW | |
| Business description, model strengths, corporate history | 11 | |
| ❸ | EARNINGS REVIEW AND NEW MTP TARGETS | |
| 4Q FY24/3 results, and outlook after transition to holding company | 23 | |
| ❹ | SHARE PRICE INSIGHTS | |
| Share price/valuation trends, shareholder return policy | 29 |
TENPOINNOVATION Metropolitan Tokyo restaurant store property subleasing specialist
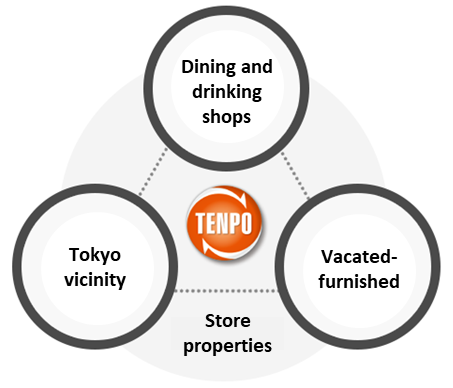
TENPO INNOVATION’s 3 Main Criteria for Selecting Store Sublease Properties Always in High Demand
●The store property is on the 1F facing a street (regardless of station proximity)
●Monthly rent is affordable in absolute terms (averaging around ¥400k/mo.)
●The property is a vacated-furnished store (lowers the initial investment cost)
PART ① INTRODUCTION
JF Monthly and Annual Surveys of the Food Service Industry
For micro-level data, we have found the monthly and annual surveys by the Japan Foodservice Association (JF) provide a timely snapshot of trends in the restaurant industry based on surveys of direct responses from restaurants and food and beverage service providers. The Skylark Group is Japan’s largest directly managed table service restaurant chain with over 3,000 restaurants nationwide and approx. 300 million guests every year. After the first Skylark restaurant was opened in Fuchu, Tokyo in Jul-1970, the Japan Foodservice Association (JF) was established in 1974 under approval of the Ministry of Agriculture, Forestry and Fisheries to contribute to the development of the food service industry and the creation of a rich food culture in Japan. JF celebrates its 50th anniversary in 2024. The number of regular and supporting member companies exceeds 800, including regular members (companies operating restaurant chains) and supporting members (food service-related manufacturers, trading companies, etc.), making it the largest food service industry organization in Japan.
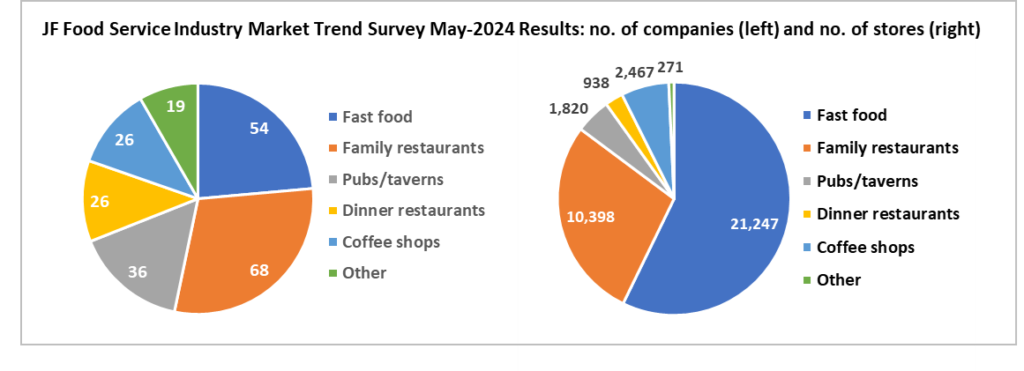
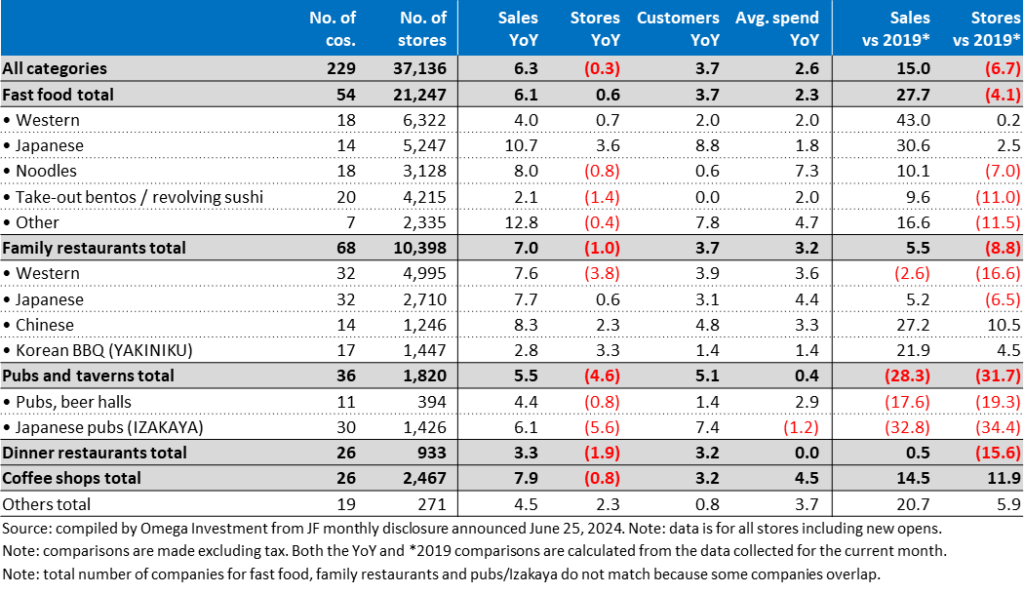
The two pie graphs below show the “JF Food Service Industry Market Trend Survey May-2024 Results Report” was based on responses from 229 companies which operate 37,136 stores (see P9 for full survey data), a more than adequate sample size to accurately reflect the underlying trends, and the pie graphs present the breakdown by restaurant format. The table above the two pie graphs provides a description of each of the restaurant formats, which is based on definitions and the classification system adopted by METI. JF also produces an annual report “Food Service Industry Market Size Estimates,” although finalized figures are released with a significant delay (see P5). Annual, quarterly and monthly data from JF Food Service Industry Market Trend Survey Results Reports from Jan-2019 through April 2024 (annual reports from 2014 through 2023) is summarized on PP6-9.
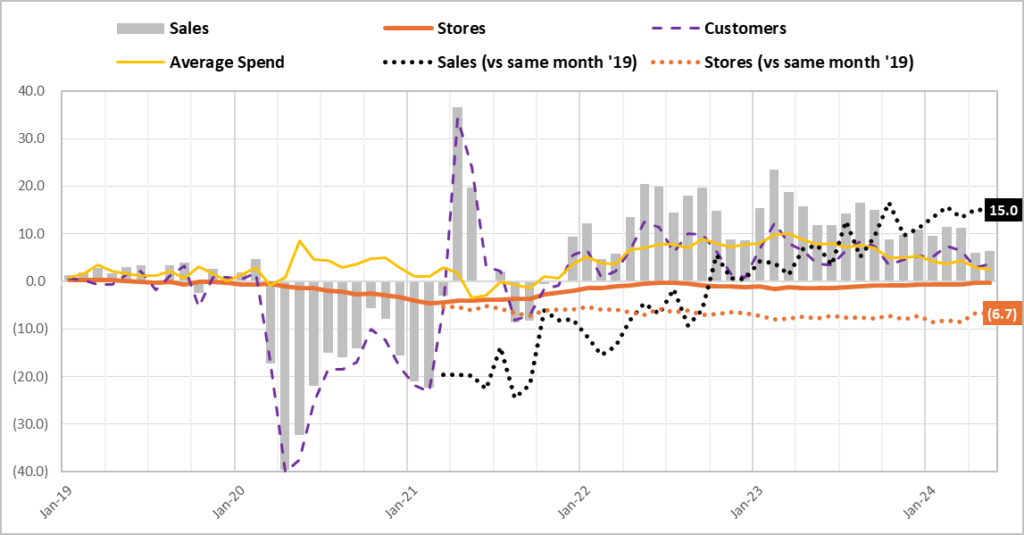
A key feature in JF survey results reports starting from Mar-2021 is, in addition to YoY trend figures, the inclusion of comparisons versus same month of 2019 (pre-pandemic), to help gauge the level of the recovery by stripping out the high volatility of YoY comparisons, which alone can be misleading. As of May-2024, although total sales have recovered to +15.0% versus May-2019, the total number of stores is still down -6.7% (see upper chart on P7).
JF Restaurant Format Classifications Based on METI Statistics Definitions

Source: compiled by Omega Investment from Japan Foodservice Association (JF).
Note: data for all stores incl. new opens. http://www.jfnet.or.jp/data/data_c.html
Japan Foodservice Association (JF) Food Service Industry Market Size Estimates (JPY trn)
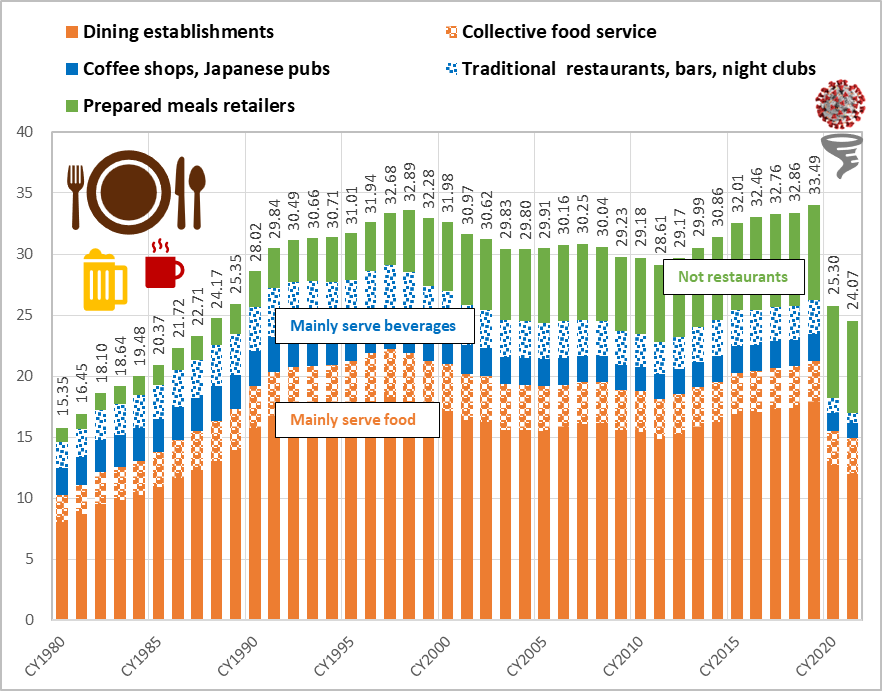
Japan Foodservice Association (JF) Food Service Industry Market Size Estimates (JPY bn)
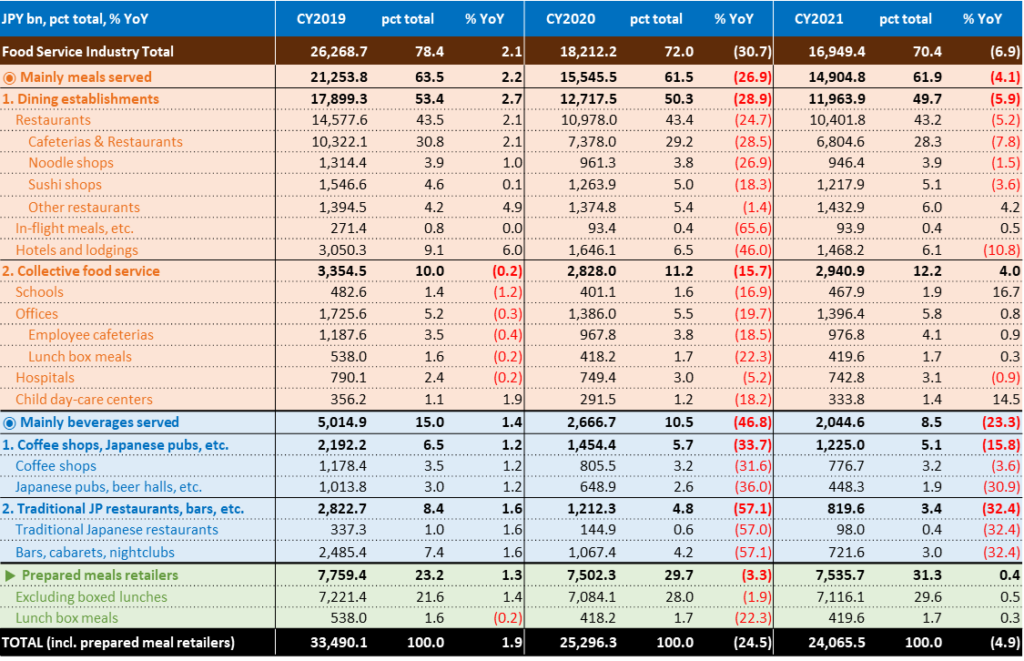
Source: Japan Foodservice Association (JF) “Food Service Industry Market Size Estimates,” March 2023. http://www.jfnet.or.jp/data/data_c.html
CY2020 total sales down -15.1% YoY, the largest drop since the survey began in 1994
In the wake of the outbreak of COVID-19, the government issued a state of emergency declaration in Apr-2020, and total monthly sales dropped -39.6% YoY, ranging from -95.9% for pubs and taverns due to avoidance of the “3Cs” described below, to +2.8% for western fast food chains able to maintain sales through drive-thru/take-out, etc. Although total sales posted a second consecutive YoY gain in 2023, boosted by MHLW downgrading COVID-19 to a class 5 infectious disease (same as flu) in May-2023 and resumption of inbound demand after the easing of immigration restrictions (no longer require valid vaccination certificate or proof of negative test for COVID-19) at the end of Apr-2023, relative to 2019 (pre-pandemic), total sales in 2023 were up only +7.7%, and total number of stores was still down -7.6%. Demand has entered a steady recovery, but it is lacking strong momentum.
JF Food Service Industry Market Trend Survey Annual Results Report
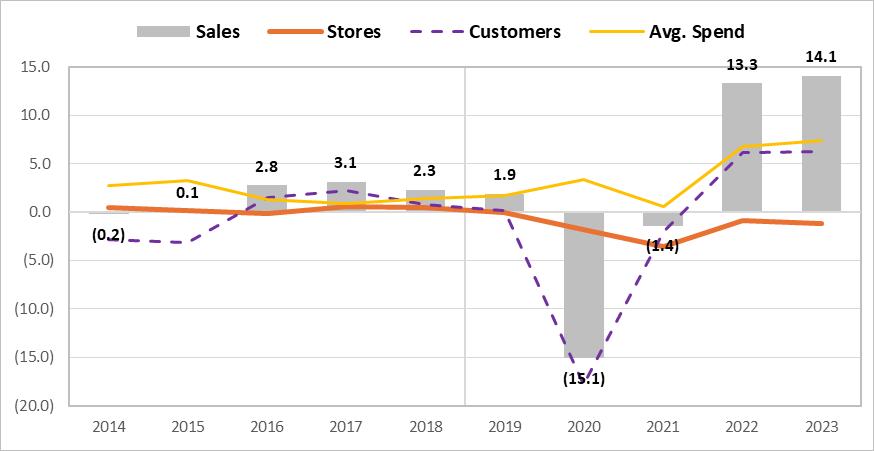
Quarterly YoY Trends by Format from Annual Results Reports
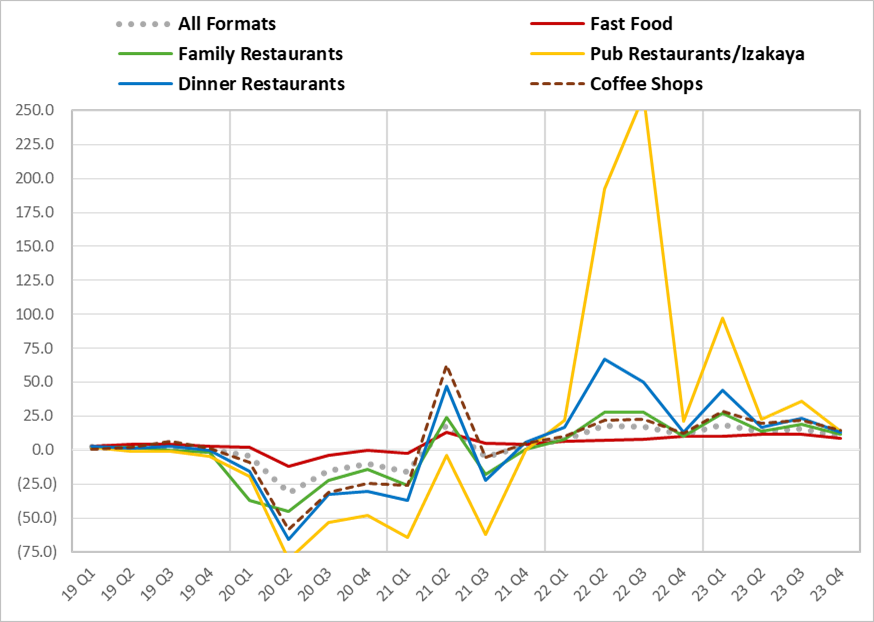
Source: both graphs compiled by Omega Investment from JF annual reports. Note: data is for all stores including new opens.
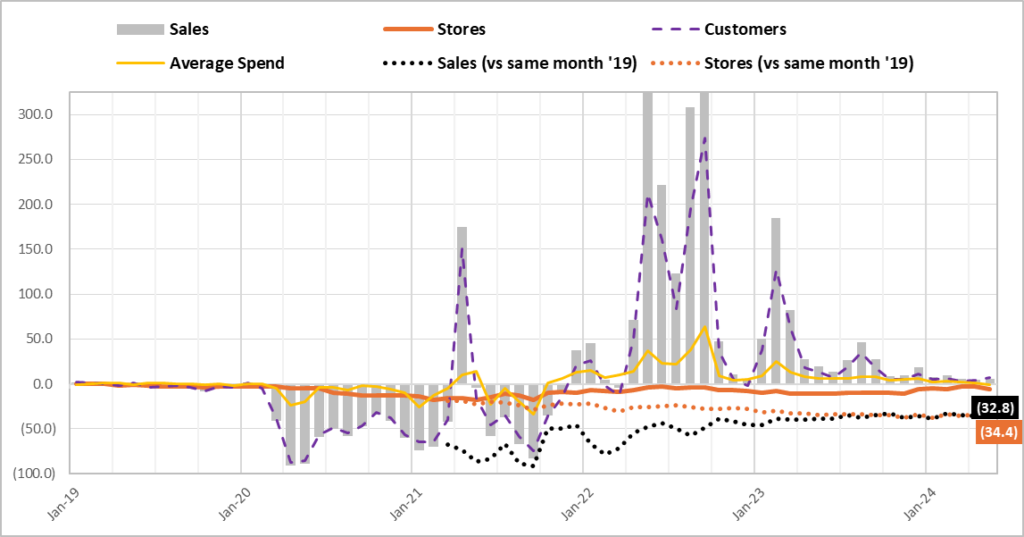
Impact of the “3Cs” under COVID-19:
Pub restaurants/Izakaya were hit hardest during COVID-19 due to government policy restrictions such as shortened operating hours, etc. aimed at avoiding the 3Cs: closed spaces, crowded places, and close-contact settings.
As of May-2024, relative to May-2019 (ie 5 years later), Japanese pubs (IZAKAYA) total sales were still down -32.8% and the total no. of stores was still down-34.4%.
Monthly trends for All Formats and 4 selected, relevant sub-sectors
It is important to keep in mind that JF data is mainly for restaurant chains, and while TENPO INNOVATION tenants include unlisted FTG Company, which operates Futago brand yakiniku and deli stores, and TSE 3198 SFP Holdings, which operates Toriyoshi yakitori and ISOMARU SUISAN seafood pub izakaya stores, the majority of TI tenants are small business owner-operators with one or more restaurants, including ramen, Chinese, yakiniku and izakaya, etc.
JF Food Service Industry Market Trend Survey Monthly Results Reports – All Formats
JF Food Service Industry Market Trend Survey Monthly Results Reports – Fast Food, Noodles
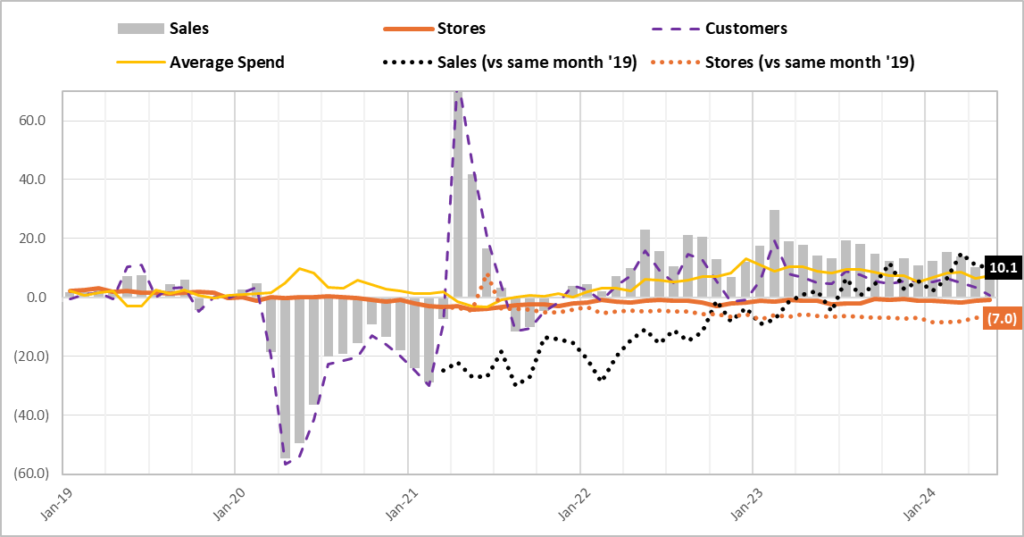
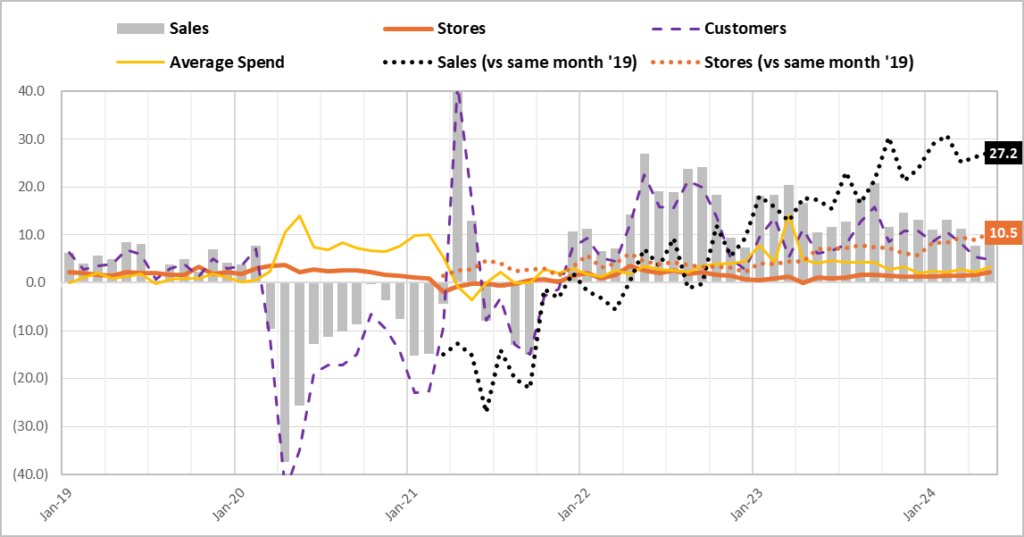
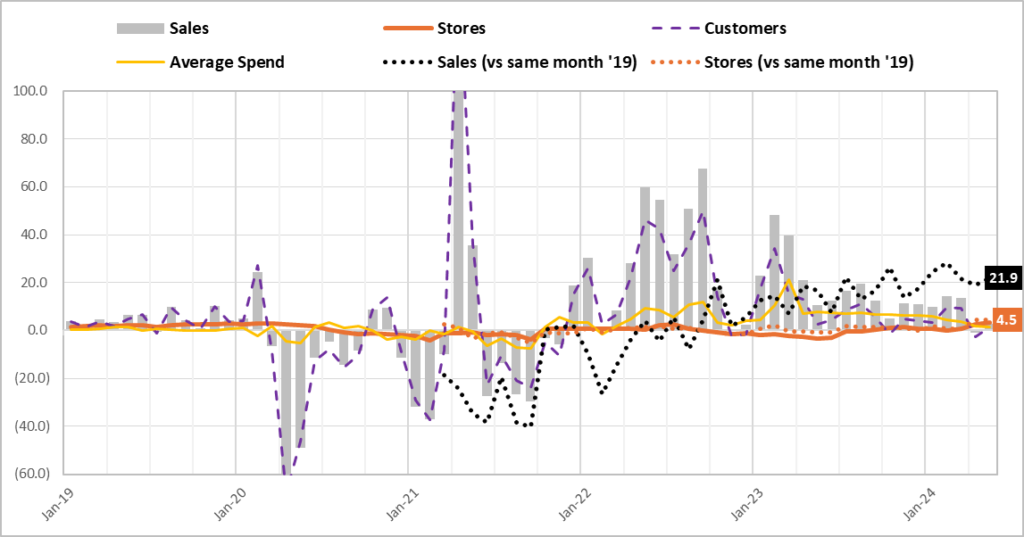
Of the 4 selected subsectors, casual dining Chinese and Yakiniku are up sharply
As mentioned earlier, a key feature of JF Food Service Industry Market Trend Survey Results Reports is the inclusion of comparisons versus same month of 2019 (pre-pandemic), to help gauge the level of the recovery by stripping out the high volatility of YoY comparisons. The dotted black line is for sales versus same month 2019, and the dotted orange line is for no. of stores versus same month 2019. No. of stores vs 2019 for both sub-sectors below are up.
JF Food Service Industry Market Trend Survey Monthly Results Reports – Family Restaurants, Chinese
JF Food Service Industry Market Trend Survey Monthly Results Reports – Family Restaurants, Yakiniku (Korean BBQ)
Peak repayment of COVID “zero-zero loans” for SMEs in 2024
TENPO INNOVATION expects a full-fledged recovery for the restaurant industry, including pub restaurants shown below where the recovery has been delayed, with the normalization of customer movement, including inbound traffic. However, in addition to difficult conditions for operators including the worsening labor shortage, and soaring utility and raw materials costs, repayment of zero-zero loans (effectively zero interest with no collateral) to SMEs during COVID is set to peak in 2024, and some restaurant operators may decide to exit.
JF Food Service Industry Market Trend Survey Monthly Results Reports – Pub Restaurants, Izakaya
JF Food Service Industry Market Trend Survey May-2024 Results Report
TENPO INNOVATION subleased store properties are uncorrelated with the market
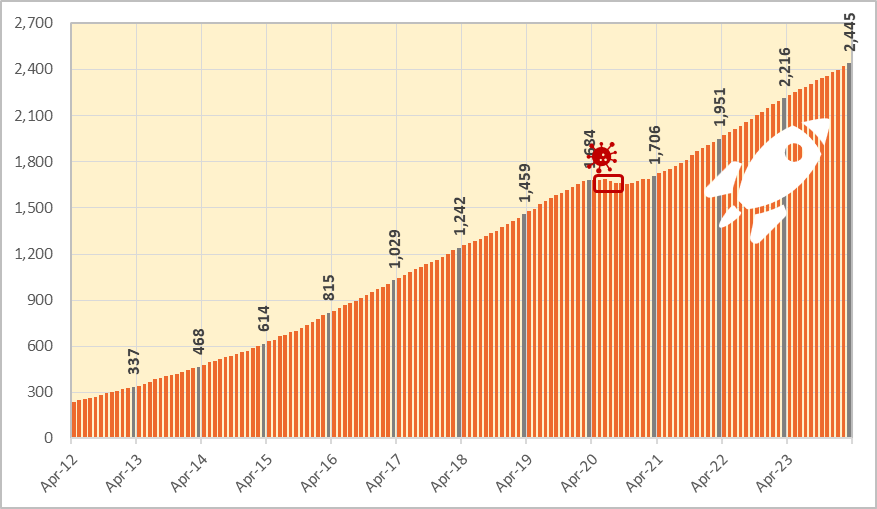
Even during the height of COVID-19 in 2020, active subleased stores only dipped slightly, closing up YOY for the fiscal year. We examine strengths of the business model in Part 2, but the bottom line is careful selection of store properties mainly in central Tokyo (①the store property is on the 1F facing a street (regardless of station proximity), ②monthly rent is affordable in absolute terms (averaging around ¥400k/mo.), and ③the property is a vacated-furnished store (lowers the initial investment cost)) are ALWAYS in high demand. Average turnover has been quite consistent over time, equivalent to roughly 10% every year, or 50% every 5 years. Relative to Mar-2019, TI active subleased store properties increased +67.6% (or +10.9% CAGR over 5 years), versus JF all formats down -8.6%!
Monthly trend of subleased store properties: stable and sustainable high growth
Source: compiled by Omega Investment from company IR results briefing materials.
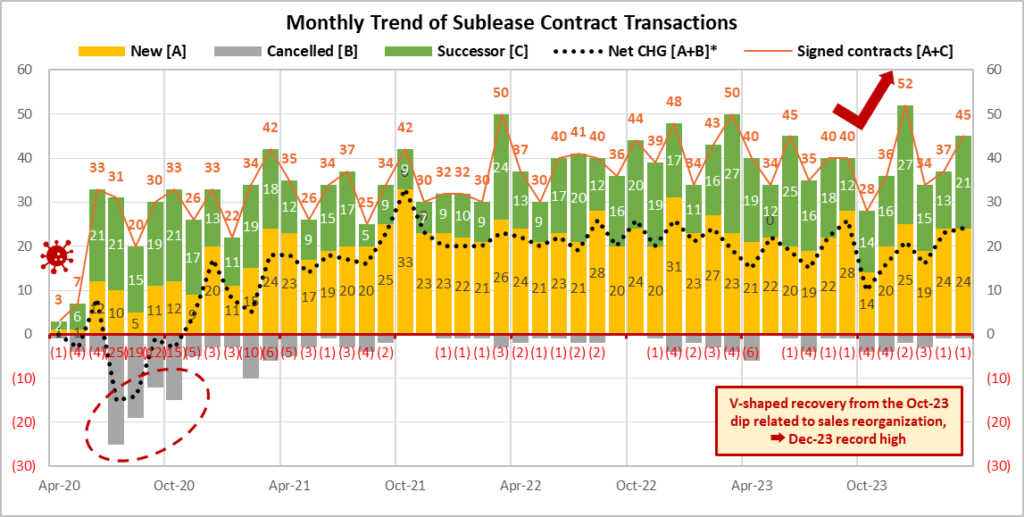
Source: compiled by Omega Investment from company IR results briefing materials. *Note: net change = “New – Cancelled” as well as reflects transfer from “sublease to leasehold” and “leasehold to sublease” (Dec 2021: -2; Jan 2022: -1; Oct 2021: +2; Nov 2022: +1; Dec 2022: -1; Aug-23 +1; Sep-23 -1, Dec-23 -2, Mar-24 +1).
PART ② BUSINESSOVERVIEW
Business description and strengths / attractive features of the business model
When you go to the Company’s website and open the home page, you are presented with an aerial view of central Tokyo. Then if you click on the lower right-hand corner, a 1:24 minute flashy YouTube video with a catchy soundtrack starts playing, highlighting some headline bullet points about the attractiveness of the Tokyo restaurant market.
TOKYO × TENPO INNOVATION
Grab Tokyo.
The world’s largest number of passengers Shinjuku Station: 3.59 million
The world’s largest number of restaurants Metropolitan Tokyo: 79,601
The world’s top gastronomic city No. of Michelin-star restaurants: 226
We compete in this city with the highest potential.
The world’s most traversed pedestrians Shibuya
The world’s best subculture district Akihabara
There is more we can do.
99% untapped market.
We will not stop and will keep pushing forward.
It will become a big swell and envelop this city.
From because we can do it → to so we will do it.
TENPO INNOVATION: Restaurant store property subleasing specialist
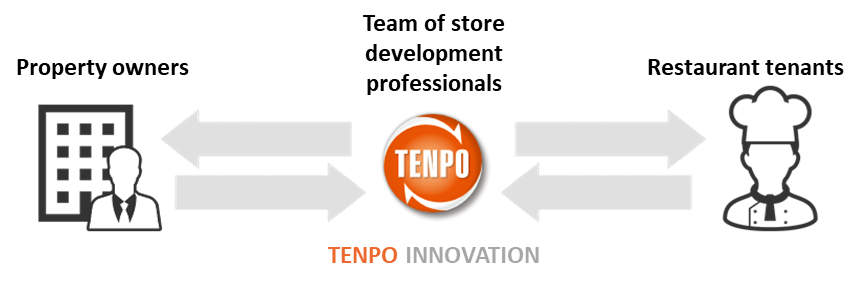
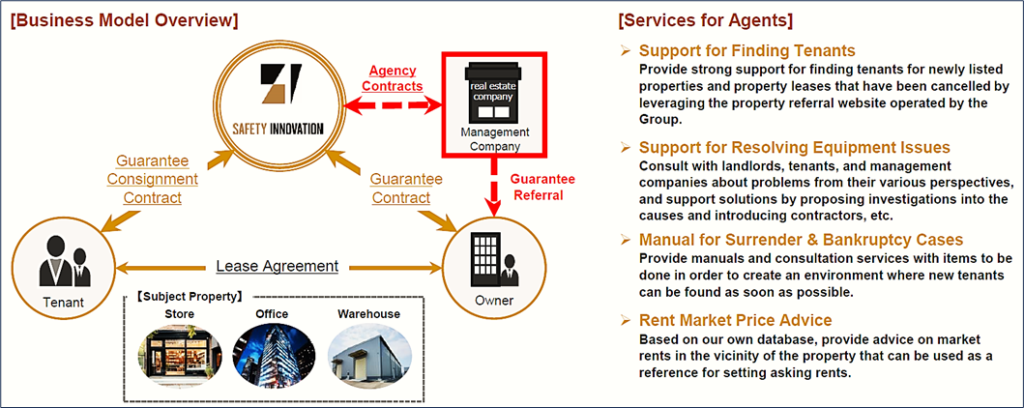
TENPO INNOVATION is a real estate company, but it does not handle agency brokerage business and management business as in the case of a general real estate company. Further, TENPO INNOVATION is a real estate company specializing in stores. General real estate companies handle residential properties, offices, warehouses, parking lots, among others. The Company doesn’t handle any of these, and only specializes in store properties. And roughly 90-95% of contracts are for restaurants, so the Company is a specialist in store subleasing business for restaurants.
The Company leases mainly vacated-furnished store properties from real estate owners, and then subleases them to restaurant operators. According to the Company, the standard format of lease contracts with owners stipulates 3-months notice required to cancel a contract, and it is automatically granted a lease right, whereby unless the Company cancels a contract, in principle it can continue to renew the lease. This lease right is a key factor in the long-term stability of the Company’s subleasing business, as demonstrated in the exhibits on P10. Standard sublease contracts with restaurant operators stipulate 7-months notice required to cancel a contract. Store operators are required to give a deposit equivalent to 10-months rent, provide a co-signer on the lease, and enter a rent fulfillment guarantee agreement, now handled mainly in-house, as described on the following page.
Revenue from store subleasing business is divided into “initial” and “running.” Initial revenue consists of 1) non-refundable “key money,” a custom specific to the Japanese market, which is a mandatory payment from a new tenant to a landlord, and is not returned when the lease is cancelled, and 2) proceeds from the sale of fixtures to the new tenant entering a vacated-furnished property. Running revenue consists of monthly rent payments from store tenants. According to the Company, the breakdown is roughly 10% from initial revenue and 90% from running. While the restaurant industry itself is known to be plagued with a relatively high number of failures, making average contract length effectively immaterial, the Company says average turnover has been quite consistent over time, equivalent to roughly 10% every year, or 50% every 5 years.
Expertise in finding and subleasing relatively small, low rent, vacated- furnished restaurant store properties, mainly in central Tokyo.
Store rent guarantee business of Safety Innovation CO., LTD.
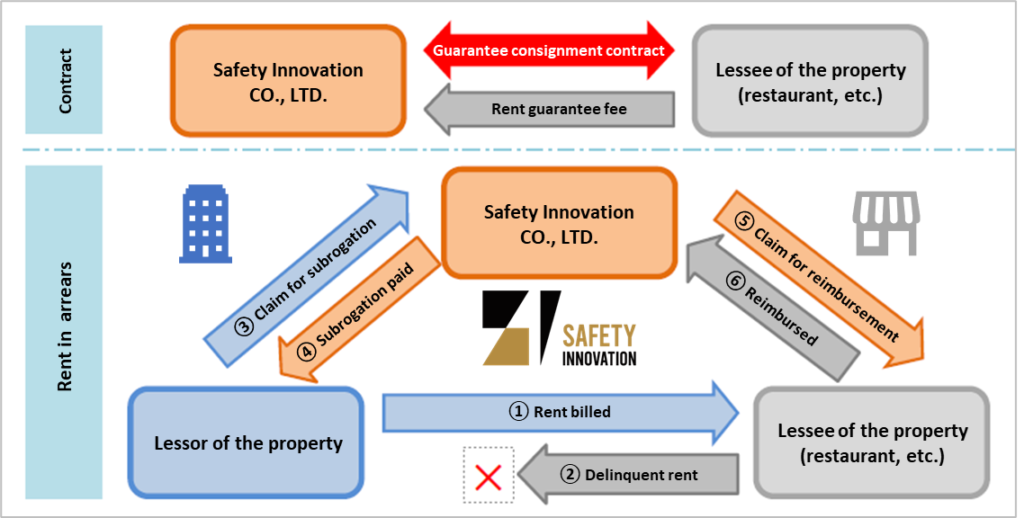
Since the Revised Civil Code went into effect from April 2020, rent guarantees for store lease properties are expanding socially as a system that benefits both property landlords and tenants. In the past, the Company had tenants enter a rent guarantee contract automatically upon application, and the business was consigned to outside providers of rent guarantees. However, with over 17 years experience in subleasing over 2,000 restaurant store properties, and unique screening know-how, the Company is fully capable of assessing the risk of its subleased properties. The Board of Directors resolved on March 24, 2022 to establish a wholly-owned subsidiary with the aim of keeping this income stream in-house.
According to the Company, every contract signed requires entering a rent guarantee agreement, and the rent guarantee fee is equivalent to roughly 1 month’s rent. The majority of these contracts are handled by the newly established Safety Innovation CO., LTD., while a portion deemed high-risk is outsourced. Thus, the number of contracts signed exceeds 100 per quarter, the majority of which directly contribute to the Group’s profit each quarter. This business carries a virtual 100% OPM, and growth is linked directly to signed contracts. Along with the rise in profitable successor contracts, store rent guarantee business will be a structural driver of margins going forward.
*Note: The trade name was changed from Tenpo Safety Inc. to Safety Innovation CO., LTD. in February 2024.
Safety Innovation CO., LTD. Store Rent Guarantee Business Overview
The company is also engaged in real estate trading business, which is revenue recorded from the sale of real estate for sale, etc. For subleasing business, procuring attractive store properties is a key point, and real estate agents are a prime source of good information on viable candidate properties meeting the Company’s requirements. However, from a real estate agent’s point a view, one month’s rent, or roughly 200-300,000 yen, is the standard commission to find a tenant, which is not a significant amount of money. At the same time, commission on the purchase or sales of a property can be several million yen up to 10,000,000 yen.
Since real estate agents have valuable information on subleased properties, the intent is to strengthen relationships with real estate agents and to meet the real estate transaction needs of clients. Since the average purchase price of real estate is small, around 80 million yen, and the properties are quickly resold, the average holding period is about 7.5 months (sometimes more than a year), and the average gross profit margin is about 35%, and properties procured as vacant units are sometimes leased within the Group and then sold at a higher value. Next, we look at the typical workflow for the 3 main areas of operation for mainstay restaurant store subleasing business.
Store property leasing from owners (procurement)
Through sales activities to real estate agents by sales representatives assigned by major train station areas, introductions from business partners and existing store operators, etc., as well as through in-house website “TENPOKAITORI.com,” (‘Store buy-backs’.com) which specializes in store purchases, the Company collects information on stores that are considering withdrawing from the market, and proceeds to research properties to be handled by the Company. TENPO INNOVATION has accumulated expertise in property evaluation based on lengthy experience in handling store properties and subsequent verification and analysis of such properties.
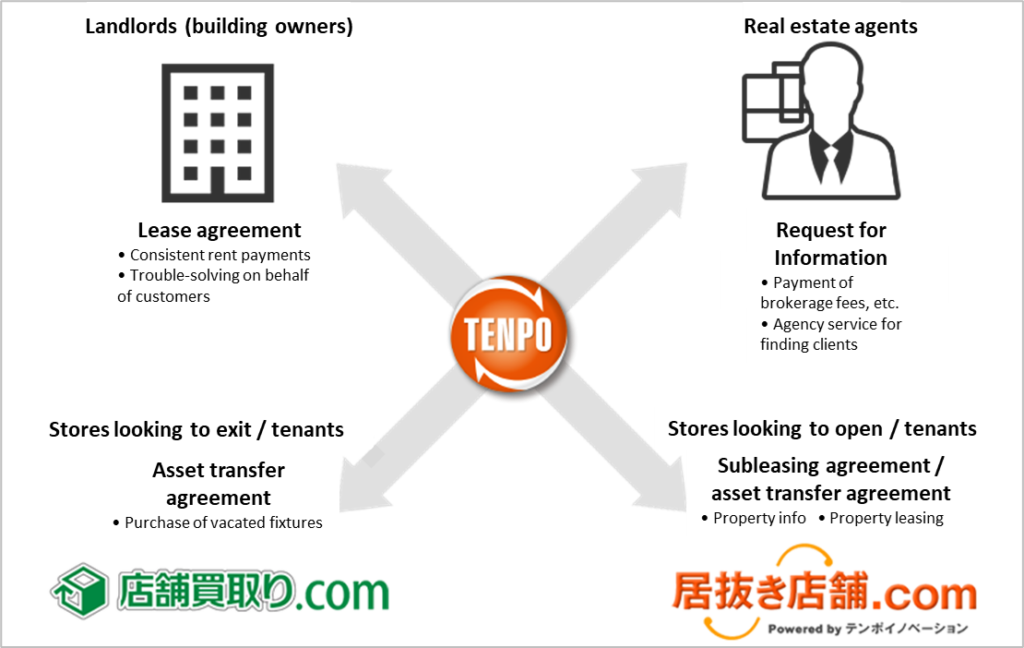
Note: TENPOKAITORI.com (‘Store buy-backs’.com) and INUKITENPO.com (‘Vacated-furnished stores’.com) are websites operated by the Company.
INUKITENPO.com website specialized in vacated-furnished store properties
As of the writing of this report, there were 100,617 members (registered applicants to open stores), with a cumulative record of listing 84,280 properties, currently listing 2,680 properties, mainly in Tokyo’s 23 Wards, but including Greater Tokyo, Kanagawa, Saitama and Chiba Prefectures, leveraging direct introductions from RE brokers to identify hidden gem vacated-furnished store properties not yet on the market.
In addition, each property survey is conducted based on the know-how cultivated through the experience and expertise of our procurement staff, which supports the handling of properties. After the property survey, we negotiate with the lender or real estate agent of the candidate property, negotiate the details of the lease agreement, pay the deposit and other contractual fees, and conclude the lease agreement between the property owner and the Company.
Store property subleasing to tenants
For store properties for which we have concluded lease contracts, we solicit prospective tenants by using real estate agents as intermediaries and by introducing them to members of our website “INUKITENPO.com” (‘Vacated-furnished stores’.com), which provides information mainly on vacated-furnished store properties, a mechanism that facilitates those who wish to open stores to search for properties. The site enhances the value of information by quickly posting and updating property information obtained daily, which is one of the Company’s strengths in matching prospective tenants with stores. After receiving an application for a property from a prospective tenant, staff conduct a credit screening, negotiate the details of a sublease agreement, receive a security deposit and other contractual payments, and conclude a sublease agreement with the tenant.
Store property management
In property management work, TENPO INNOVATION is utilizing its accumulated know-how to address issues such as rent collection and troubleshooting that plague real estate owners and property management companies, performing the work itself on their behalf. In addition, in order to prevent problems or detect and deal with them at an early stage, it checks properties, collects information, and builds relationships with store operators, etc.
TENPO INNOVATION Corporate History
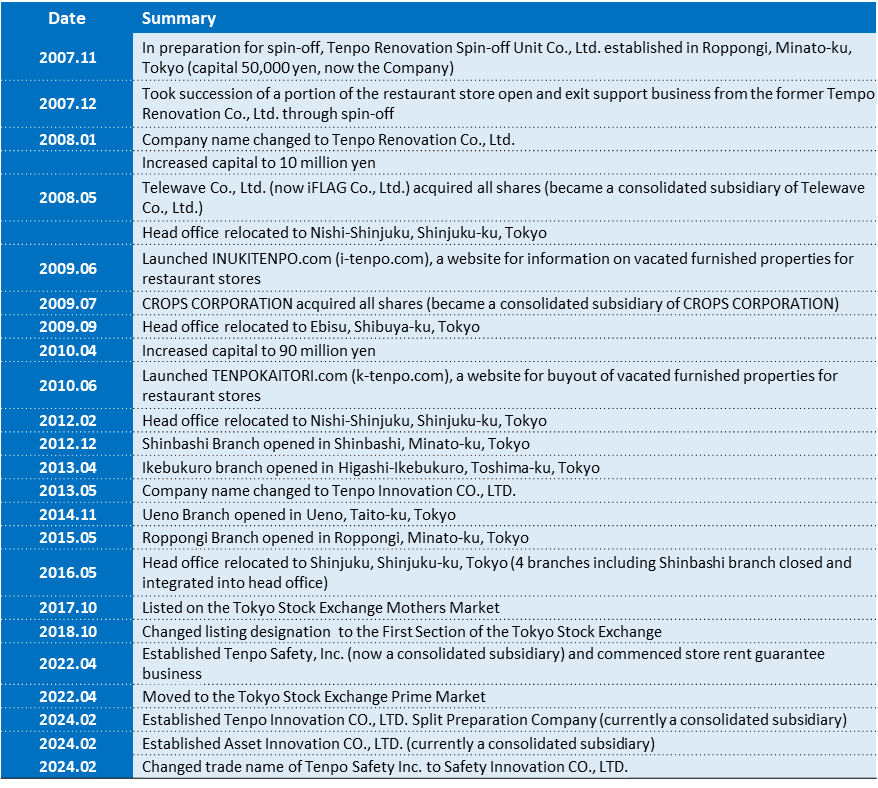
Source: compiled by Omega Investment from FY24/3 Annual Securities Report (YUHO financial statements).
Property Management
Property management is based on the results of on-site surveys of subleased properties. The survey of each property is based on the know-how cultivated through the experience and expertise of the Company’s procurement staff, and this supports the handling of properties. The company focuses on preventing problems before they occur, and from the property procurement stage, a detailed inspection record is prepared for each property, including leaks and equipment problems.
Screening management is conducted according to the nature and stage of the problem, and an organizational structure has been established to respond to the problem in the shortest possible time and to do everything possible to prevent serious problems. The number of properties handled by each property management staff member is approximately 140, and the department is dispatched more than 1,000 times a year.
Corporate history
In November 2007, the Company was established as Tenpo-Renovation Inc. to prepare for the spin-off of Tenpo-Renovation Inc. in December 2007, and took over a part of the restaurant exit support business (introduction of properties and support for those who wish to open new restaurants, and purchase of restaurant facilities and support for those who wish to exit) from Tebpo-Renovation.
The former Tenpo-Renovation Inc. was established in October 2001 as a subsidiary of REINS International Inc. for the purpose of managing restaurants (the trade name at the time of incorporation was Rayfields Corporation, with brands such as “Gyu-Kaku,” the largest yakiniku chain in Japan, as well as Izakaya and Shabu-Shabu restaurants).
In April 2005, the company started a new restaurant opening/closing support business (the actual beginning of the present Company’s business activities). At the time of the corporate spin-off in December 2007, the restaurant opening/closing support business was divided into the business related to REINS International properties and the business related to properties other than REINS International properties, and the Company took over the business related to properties other than those related to REINS International properties.
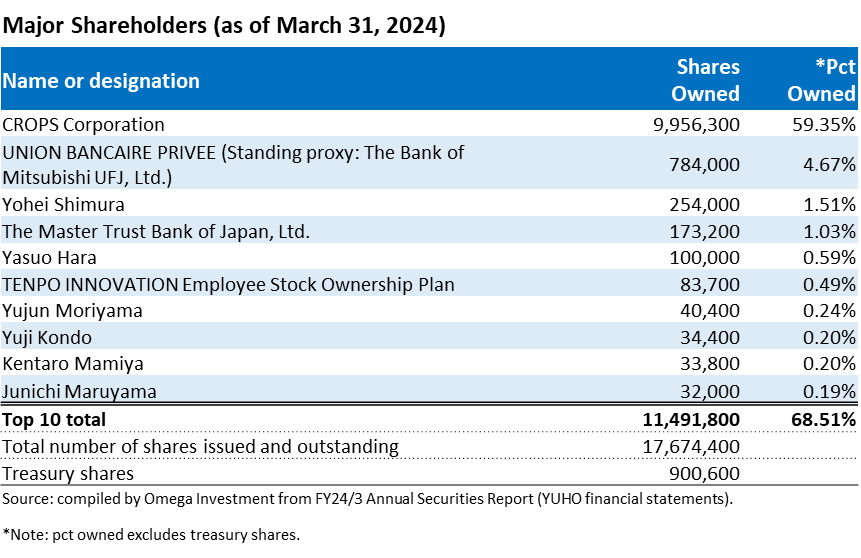
It became a consolidated subsidiary of Telewave (now iFlag) in the same year, a consolidated subsidiary of CROPS CORPORATION (9428) in 2009, and changed the Company’s name to TENPO INNOVATION in 2013.
Origin of TENPO INNOVATION’s current attractive business model
When the Company was originally established in 2007, it was not real estate business, rather, consulting business to support restaurant store exiting and opening. The only thing that had been decided was to engage in business related to restaurant store openings in Tokyo, but it was not clear in what form the business would be monetized. The most important focus at that time was not only handling restaurant store properties, but also introducing the business model of prosperous restaurants in the form of franchises, undertaking construction work on store properties, consulting work for unprofitable restaurants to help them improve their sales, etc., however, the Company stopped all of these activities when demand was low and the business was unprofitable. Management found the highest demand was for introductions to vacated-furnished store properties in good locations in Tokyo, and accordingly focused efforts in that area.
TI converted its consulting business into real estate business in order to earn recurring stock income from subleasing. This was a critical turning point for the Company. It would likely have been difficult for professionals well-versed in real estate to be successful in this area. The market for store properties is quite small and highly specialized, even within the real estate industry. Management’s background was in a company that operated “Gyu-Kaku” yakiniku restaurants, and they were admittedly amateurs in the real estate field. However, they did have professional expertise in restaurant business, and significant accumulated store property know-how.
Management’s aim was to engage in a unique business specializing in store properties rather than plan to engage in the real estate business in a comprehensive manner. It took a while to find the right model, but this put the Company on a sustainable growth path.
Subleasing store property selection criteria, general policy on tenant selection
There are 3 main criteria when selecting properties to lease for the purpose of subleasing: 1) The store is on the ground floor facing a street, 2) rent is affordable in absolute terms, and 3) it is a vacated-furnished store. Conventional wisdom is that a “good store property” has high pedestrian traffic, is near a station and/or is located on a main street. For fast food and other major restaurant chain stores, that is likely a requirement. However, for individual or small business restaurant operators, the corresponding high rents for those store properties is simply a non-starter economically, considering initial start-up costs in addition to running costs. In TI’s accumulated experience, there is always high demand for store properties with low rent and that are vacated-furnished stores, even if the location is slightly further away from a station. Similar to low rent, the key point about vacated-furnished properties is lowering the initial investment cost.
According to the Company, there are actually not many requirements when selecting prospective tenants. The Company is quite strict in selecting store properties to procure for subleasing, however in the case of prospective tenants, after undergoing a routine credit screening, incoming tenants are required to put down a 10-month security deposit, have a co-signer on the lease as guarantor, and enter a rent guarantee agreement. In the end, it is very difficult to judge whether a new tenant will have a successful restaurant business or not, since the restaurant industry itself has a high open and close ratio, and many restaurants are prone to failure. TENPO INNOVATION’s business model is designed such that, even if a tenant opens a restaurant that fails, if the store property meets the aforementioned criteria, the Company can simply recruit the next tenant, as these store properties are always in high demand.
Attributes of prospective tenants that work in their favor would include having existing store (s) with a good track record, as well as being able to fund the opening without taking out a loan. Regarding type of restaurant format, TENPO INNOVATION’s portfolio reflects general trends in the overall market. For example, there are a large number of Izakaya (Japanese-style pubs) and ramen (Chinese noodles) shops as tenants.
Reasons TENPO INOVATION’s business model can deliver both growth and stability
Regarding stability, a key point is the lease right automatically granted when TI leases a store property from an owner. In principle, unless the Company cancels the lease contract, it can continue to renew it. In the case of the global outbreak of COVID-19 from Feb-2020, confronted with declarations of a state of emergency, stay-at-home orders and shortened/suspended business hours for restaurants by the Governor of Tokyo, out of an abundance of caution, TI decided to give 3-months notice on a certain number of lease contracts in April, resulting in the pickup in contract cancellations in July through October of that year. However, strong underlying demand for TI’s carefully selected store properties supported a rapid turnaround.
Regarding growth, there is the growth achieved from steadily increasing the number subleased store properties. However, there is also a less understood structural growth element from rising profit margins on store subleasing business. Specifically, there are initial acquisition costs associated with entering a new lease agreement, including one-time costs of non-refundable key money, contract-related costs, etc. Annual subleasing contract cancellations have been consistent over time, averaging 10% every year, or 50% every 5 years. When one of TI’s existing tenants exits the business, and a new tenant is recruited, the aforementioned acquisition costs of the store property were sunk on the first subleasing contract, and from the second contract onward, key money and other initial income are effectively pure profits, without an associated acquisition cost. Roughly 35% of current sublease contracts have been replaced by successor tenants, but this ratio is steadily rising over time, resulting in a steady structural increase in profit margins going forward.
Transition to a Holdings Company Structure
The Group has decided to begin preparations for the transition to a holding company structure in order to optimize the allocation of management resources, to promote the development of the next generation of management personnel, and to create a structure that will enable flexible decision-making and flexible responses to changes in business conditions in order to promote business expansion by focusing more on each of the Group’s businesses. By transitioning to a holding company structure, the holding company will oversee the management of the entire Group, while each subsidiary will focus on promoting its own business, thereby maximizing the corporate value of the Group.
The business to be divested will be transferred to a wholly owned subsidiary (split preparation company) through a company split (absorption-type split) with the Company as the splitting company, and the split preparation company as the successor company. In addition, the Company will continue to be listed as a holding company on the TSE Prime market. The 18th Annual General Meeting of Shareholders held on June 17, 2024 approved the absorption-type split agreement and partial amendment to the Articles of Incorporation to change the trade name to Innovation Holdings CO.,LTD. (effective date of the absorption-type split: October 1, 2024). Details of the new holding company structure, new trade names/corporate logos, etc., are outlined in the exhibit below.
Schedule of the company split
1)Board of Directors’ meeting resolved to approve the establishment of the successor split preparation company: February 2, 2024
2)Establishment of the successor split preparation company, Tenpo Innovation Split Preparation Company: February 9, 2024
3)Board of Directors’ meeting resolved to approve the transition to a holding company structure: May 17, 2024
4)Board of Directors’ meeting resolved to approve the absorption-type split agreement: May 17, 2024
5)Conclusion of absorption-type split agreement: May 17, 2024
6)General Meeting of Shareholders approved the absorption-type split agreement and partial amendment to the Articles of Incorporation to change the trade name to Innovation Holdings CO.,LTD.: June 17, 2024
7)Effective date of the absorption-type split: October 1, 2024 (planned)
New Group Holdings Company Structure from October 1, 2024
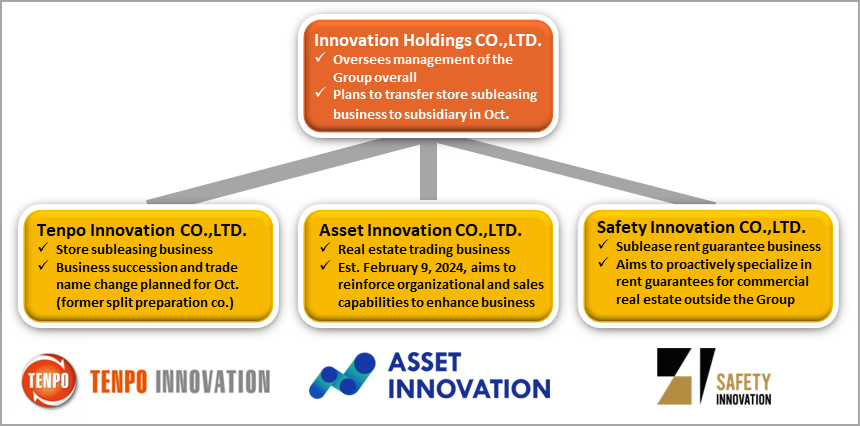
Source: compiled by Omega Investment from IR results briefing materials and related press releases regarding the transition to a holdings company structure.
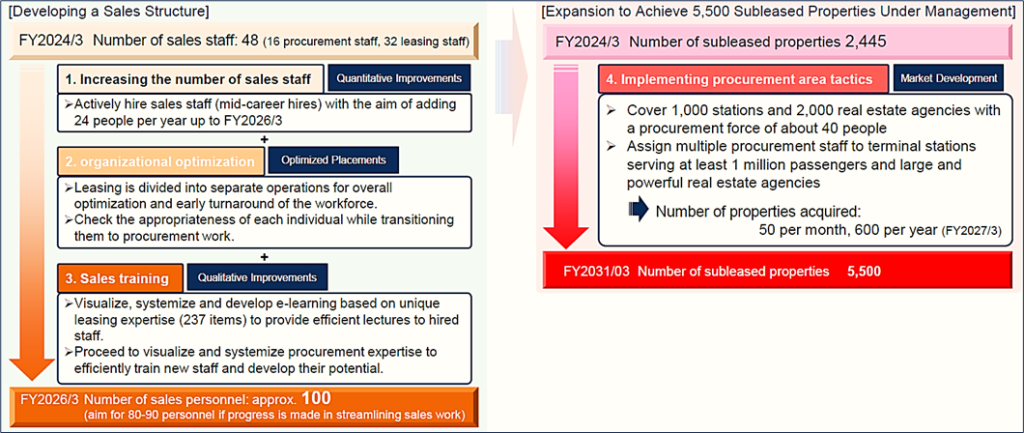
FY25/3 Business expansion initiatives under the new holdings company structure
Numerical targets for the new Medium-term Management Plan under the new holdings company structure are shown in in the table on P2. During the first year of the new MTP in FY25/3, while net sales are forecast to increase +18.1% YoY, driven by robust increases in signed contracts (new + successor) 466 → 570 (+22.3% YoY) and active sublease store properties 2,445 → 2,757 (+12.8% YoY), operating profit is forecast to decline another -6.9% YoY due to the impact of higher SG&A expenses accompanying the increase in headcount for aggressive expansion of each business. As year one of the new MTP, FY25/3 is positioned as a transition phase toward accelerating growth going forward, and while profits will remain under pressure from upfront investments to strengthen the sales organization, the growth opportunity going forward is substantial.
Tenpo Innovation CO., LTD. – Store subleasing business
Vision: Change business practices in the subleasing industry and create a new standard for store properties
① Sales
- Measures to expand purchasing opportunities (Property Development Department) and division of labor and specialization of leasing operations (Sales Department)
- Along with increasing procurement, establish procurement channels centered on web-based purchasing and implement measures to build relationships with leading suppliers
- Shift from traditional all-in-one leasing to a division of labor by business, pursuing total optimization and specialization
② Training
- Training system to quickly turn inexperienced sales representatives into an effective force
- Efficient education through active use of e-learning tools such as videos
- Establish and disseminate mission, vision, and values for each department, and organize and manualize procurement know-how
③ Recruitment
- Continue to actively recruit based on the previous year’s results (23 sales hires)
- Established the “Recruitment Promotion Department” to succeed the Sales Development Department of the previous fiscal year, and plans to actively recruit property management staff in addition to sales staff
- Aiming to maximize the number of applicants, while increasing efficiency and reducing costs
④ In-house websites
- Improve the appeal and presence of our websites “INUKITENPO.com” (finding tenants for vacated-furnished stores) and “TENPOKAITORI.com” (purchase of vacated equipment)
- Expand the range of properties handled by “INUKITENPO.com” and improve convenience by using search engine optimization (SEO) measures and use of LINE, etc.; expand the range of properties handled by “TENPOKAITORI.com” and increase awareness through advertising, begin operations by a specialized team
Safety Innovation CO., LTD. – Rent guarantee business
Vision: Become No. 1 in the rent guarantee industry in terms of the number of commercial real estate rent guarantee contracts
① Startup preparations
- Initially, place priority on approaching Group business partners, with full-scale recruiting activities beginning in the second half of the fiscal year
- Conduct sales activities to real estate companies (on the scale of 1,000 companies) that deal with subleasing business to increase awareness in the Tokyo metropolitan area
- Full-scale recruiting activities are scheduled to begin in the 2H of the current fiscal year (planning to hire approximately 15 employees), and planning to establish a branch in the Tokyo metropolitan area
② Business flow
- Proactively utilize IT while improving workflow and manuals, and establish a training / education system
- Proactive use of cloud services and OCR to develop workflows and manuals for making contracts, screening, and collection
- Improve convenience and reduce the burden on clients, while improving operational efficiency and training systems
Actively acquire projects outside the Group through rent guarantees specializing in commercial real estate properties. Expand business through synergies by leveraging store property know-how and providing added value to agents.
Asset Innovation CO., LTD. – Real estate trading business
Vision: Become a leading company in commercial real estate distribution
① Developing customers
- Taking the opportunity of the company’s establishment, strengthen organizational and sales capabilities, and actively collect information and cultivate customers
- Strengthen sales and marketing for purchasing to Yamanote Line and surrounding stations (plan to add 2 sales staff this fiscal year) and develop sales channels other than RE agents
- Strengthen purchasing capabilities through direct mailings to RE agents and property owners
② Training and collaboration
- Start compiling know-how and creating manuals, and hold study sessions for Group cooperation
- Through organizing know-how and creating manuals, aim to increase human resource short-term competitiveness
- Hold study sessions for Group companies twice a year to share information on purchases and sales
PART ③ EARNINGS REVIEW
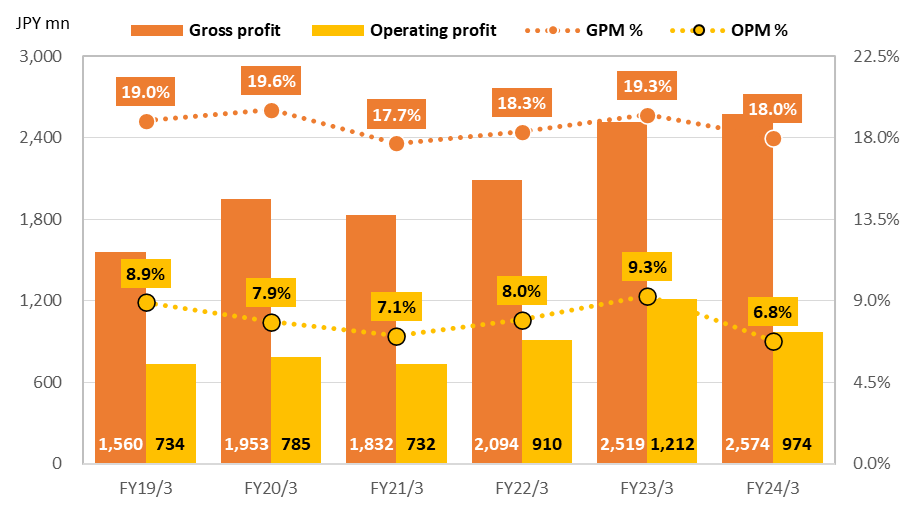
FY24/3 consolidated net sales +9.1% and OP -19.6%
As described in Part 1, restaurant industry sales in 2023 increased for the second consecutive year, driven by steady normalization of customer traffic with the downgrade of COVID to Class 5 and lifting of immigration restrictions around golden week, prompting a recovery of inbound tourists. However, while total sales for all formats increased +14.1% YoY, a large component was the 7.3% increase in average spend reflecting inflation. The environment for restaurant operators was extremely challenging with soaring utility and raw materials costs, exacerbated by the worsening labor shortage. By formats, the recovery of Izakaya (Japanese pubs) was delayed due to the -9.7% YoY decline in the number of stores (-33.6% versus 2019).
Against this backdrop, TENPO INNOVATION still achieved net sales growth of +9.1% YoY, driven by the +10.3% increase in active store sublease properties to 2,445. While the number of signed contracts (new + successor contracts) dipped slightly by -3.3% YoY, in part due to the reorganization of sales in Oct-2023 (see P10), the quarterly average of 116.5 contracts was still a high level. Ultimately, as described in Part 2, the strength of the business model of adhering to strict proven criteria when selecting store properties for subleasing ALWAYS results in being able to find demand in an industry known for constant turnover.
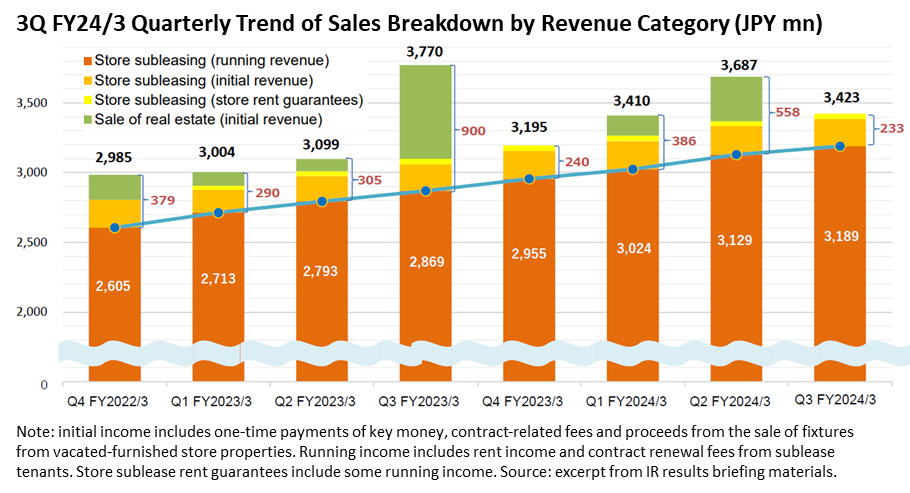
4Q FY24/3 Quarterly Trend of Sales Breakdown by Revenue Category (JPY mn)
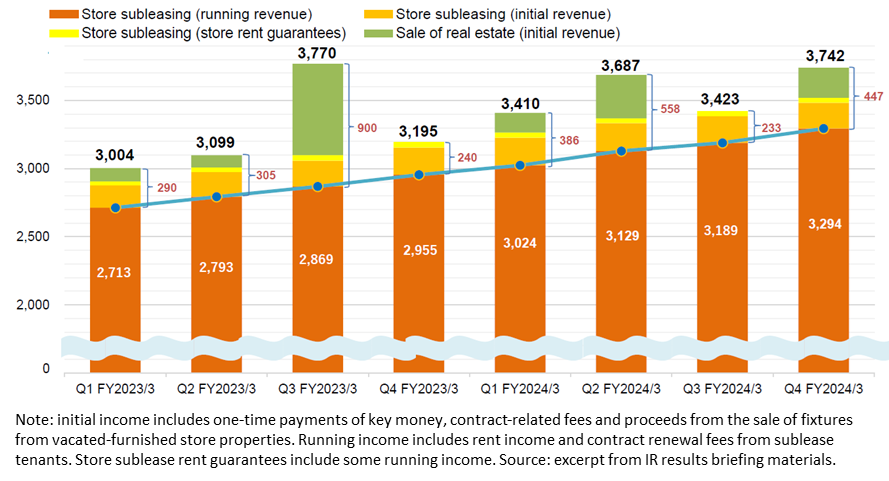
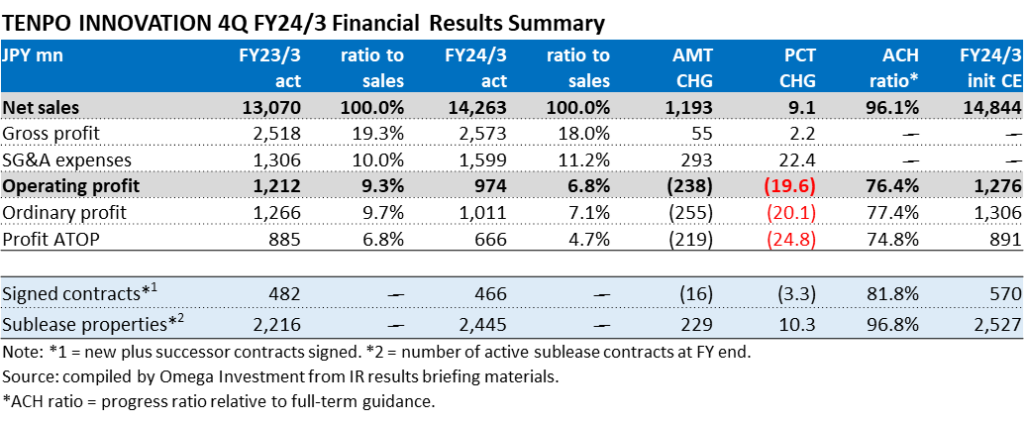
Despite the increase in net sales, GPM declined 1.3pp as costs increased due to aggressive purchasing of subleasing properties (vacancy rents, construction, commissions, etc.) and the disappearance of the sale of several large and highly profitable properties in the real estate trading business in the previous fiscal year. OP declined -19.6% YoY mainly due to a higher ratio of SG&A to sales from increased salary and recruiting expenses, executive compensation linked to the previous year’s strong performance, and DX system investments such as the move to electronic contracts, etc. Initial forecasts for FY25/3 are shown below. Net sales are forecast to increase +18.1% YoY (16th consecutive YoY gain), mainly driven by the resumption of double-digit growth in signed contracts following the reorganization of sales last term, and forecast +12.8% YoY increase in active store subleases. However OP is forecast to decline -6.9% YoY, a second consecutive YoY decline, due to the impact of higher SG&A expenses accompanying the increase in headcount for aggressive expansion of each business under the new holdings company structure to take effect from October 1, 2024. As year one of the new MTP, FY25/3 is positioned as a transition phase toward accelerating growth going forward, and while profits will remain under pressure from upfront investments to strengthen the sales organization, the growth opportunity going forward is substantial.
From FY24/3, the Company announced a change to its dividend policy, effectively raising the target payout ratio from the 30% level to the 40% level. As can be seen from the left-hand graph, along with making proactive upfront investments to capture the significant growth opportunity, over the last 7 fiscal years since listing in Oct-2017 through FY24/3, total cash dividends have grown at +31.5% CAGR, with DOE topping 10% in FY24/3, and the payout ratio forecast to exceed 50% for the second consecutive year in FY25/3 (see table below). The current DY of 2.36% is trading 75% above its historical average (see graph on P29).

QUARTERLY RESULTS REFERENCE:
・FY23/3 4Q
・FY24/3 1Q – 3Q
FY23/3 consolidated net sales +14.5% and OP +33.2%
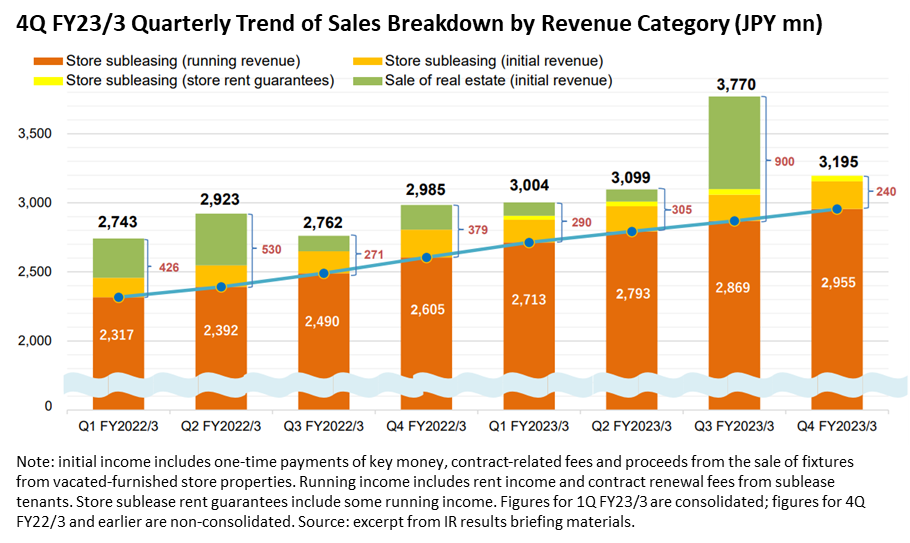
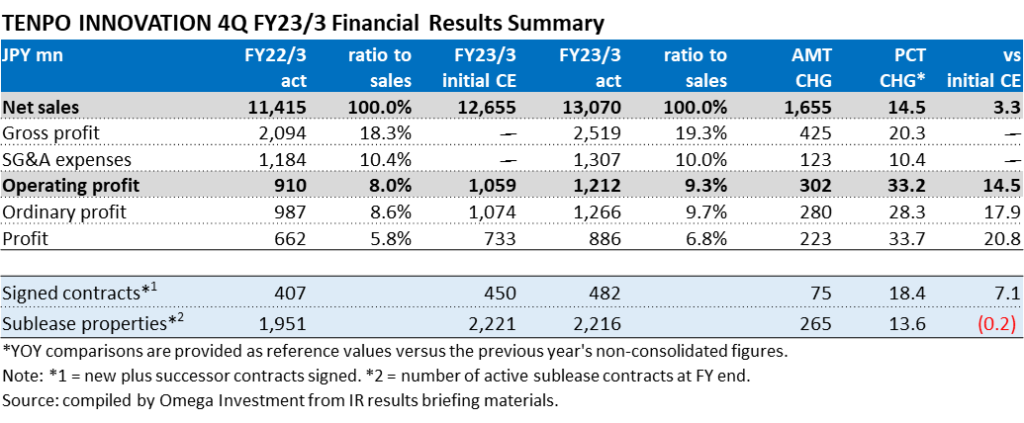
Since the Company began consolidating the accounts of newly established wholly-owned subsidiary Tenpo Safety Inc. from FY23/3, YoY figures are provided for reference versus non-consolidated results the previous term. Net sales increased +14.5% YoY, OP increased +33.2% YoY, GPM rose from 18.3% → 19.3%, and OPM rose from 8.0% → 9.3%. In addition to the contribution from new high-margin rent guarantee business, store subleasing business got a boost from the increase in new successor contracts from 135 → 197 (+45.9% YoY). Store subleasing sales increased +16.7% (sublease properties rose to 2,216, +13.6%), and store subleasing OP of ¥962mn increased +32.9%.
Real estate trading business got a boost from the sale of 5 properties which included several large-scale profitable properties (see graph below). In FY23/3, 5 properties were sold and 8 properties were acquired (Q4-only: 0 properties sold, 3 properties acquired), bringing the number of properties held by the Company to 6 at the end of FY23/3. Real estate trading sales declined -9.6%, however real estate trading OP of ¥251mn increased +34.7%. Although the primary objective of this business was to maintain a good relationship with RE brokers by paying meaningful commissions in return for good information on sublease candidates, the Company has recently also received interest from existing owner landlords to purchase properties, enhancing a stable supply pipeline without referrals, and this is now a full-fledged business.
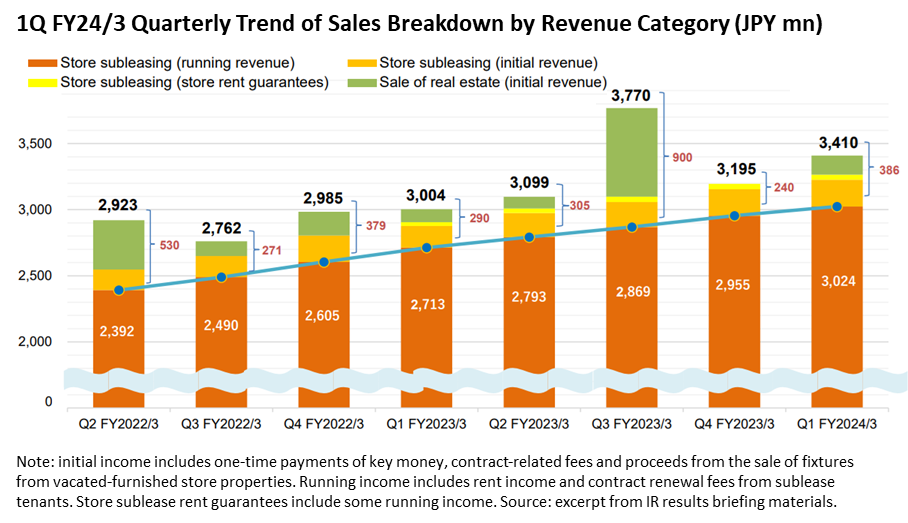
1Q FY24/3 consolidated net sales +13.5% and OP -14.6%
While the environment for the restaurant industry continued to gradually improve during the 1Q given the first Golden Week with COVID restrictions on movement lifted and resumption of inbound tourism, restaurant operators faced headwinds from the sharp rise in meal ingredients and utilities costs, as well as chronic labor shortage. Nevertheless, interest remained strong among individual and small restaurant business operators for the Company’s relatively small, ground floor facing, affordable rent and vacated-furnished subleasing store properties. Store subleasing sales increased +12.4% (sublease properties rose to 2,272, +12.8%). However, store subleasing OP declined -14.0% due to GPM declining 1.8pp on the increase in vacant rents due to aggressive procurement of new sublease store properties, while the ratio of SG&A to sales deteriorated 0.5pp on increased salary and recruiting expenses, executive compensation linked to the previous year’s strong performance, and DX system investments such as the move to electronic contracts, etc.
Real estate trading business sold 2 properties and acquired 5, bring the total inventory to 9 as of the end of June. While sales increased +44.3%, OP declined -18.4% on lower margins reflecting the weak market. Although the table below shows the 1Q progress ratio for OP was slightly behind at only 19.2%, the key takeaway from 1Q results is that margins were depressed due to aggressive procurement of new sublease stores and recruitment, which the Company expects to leverage over the next 9 months.

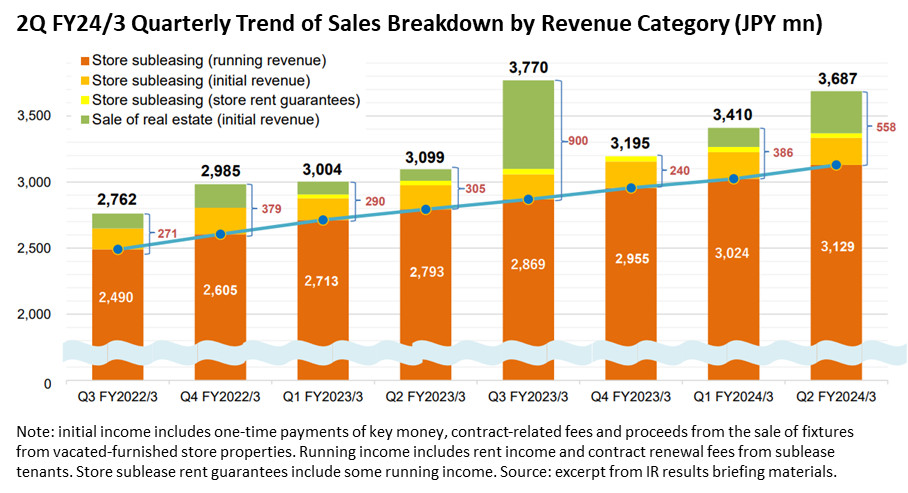
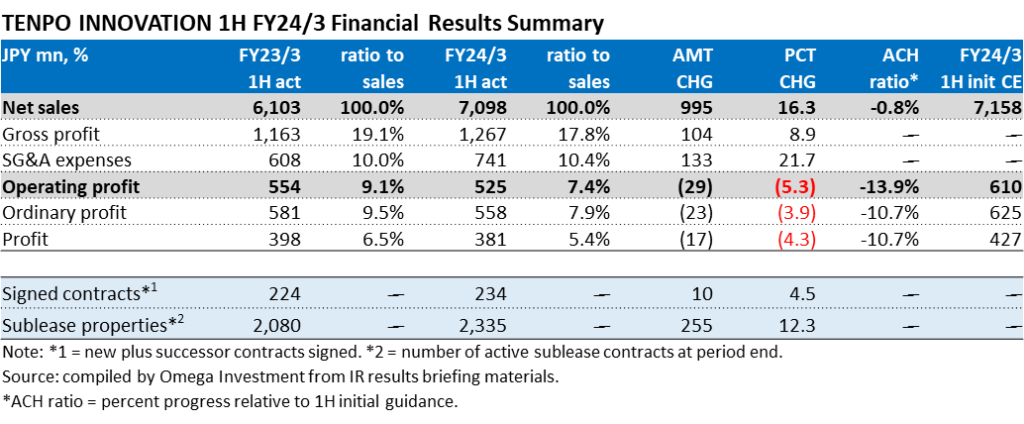
1H FY24/3 consolidated net sales +16.3% and OP -5.3%
In the restaurant industry, sales and the number of customers increased due to the first summer holidays since the downgrade of COVID-19 to “category 5,” an increase in demand for eating out due to the extremely hot summer, and a recovery in inbound sales supported by the weak yen. For drinking establishments, the number of customers during late hours and the demand for large banquets gradually returned, but overall recovery was delayed due to the decrease in the number of establishments. Store subleasing sales increased +12.2% (sublease properties rose to 2,335, +12.3%). Although the number of contracts signed remained at a high level of 115 (2Q), the pace is expected to slow slightly in the near term due to reorganization of the sales organization. Store subleasing OP declined -17.3% due to GPM declining 1.3pp on the increase in costs (vacancy rent, construction, commissions, etc.) associated with aggressive sublease property purchases, while the ratio of SG&A to sales deteriorated 0.4pp on increased salary and recruiting expenses, executive compensation linked to the previous year’s strong performance, and DX system investments such as the move to electronic contracts, etc.
Real estate trading business sold 6 properties and acquired 6 as the wait-and-see trend in the market diminished with the normalization of economic and social activities (2Q-only 4 sold, 1 acquired), bringing total inventory to 6 as of the end of September. Net sales increased +39.1%, and OP increased +35.0%. Although the table below shows a slight shortfall to 1H profits, the key takeaway from 1H results is that margins were depressed due to aggressive procurement of new sublease stores and recruitment, which the Company expects to leverage in the 2H.
★1H hiring of sales staff achieved success
The biggest risk to achieving medium-term targets lies in successful execution of its sales force recruitment • training •assignment plan, particularly for sublease store property procurement. The number of procurement staff increased by 2 in 2Q, from 14 at the end of March to 16 at the end of September. The effect of the transfer of purchasing authority is expected to be realized from 2H into the next fiscal year.
The newly established “Sales Development Department” specializing in sales recruitment (headed by a sales executive) hired 15 new sales staff during the 1H.
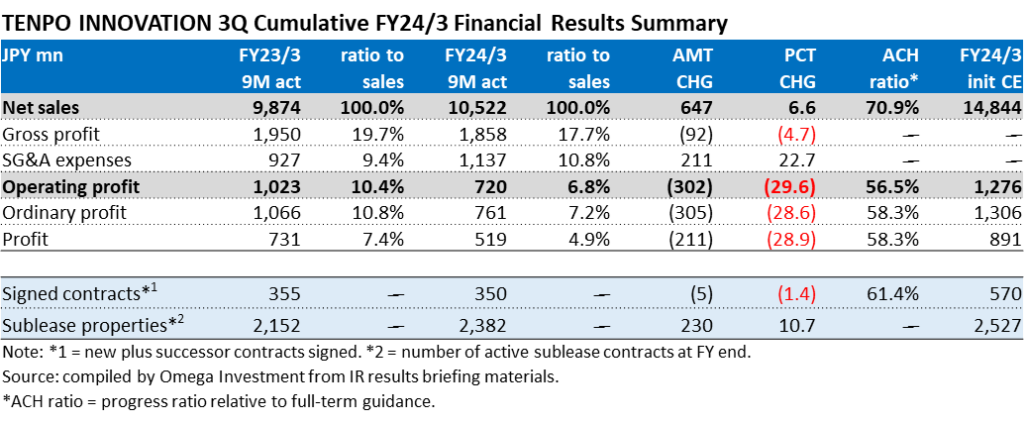
9M FY24/3 consolidated net sales +6.6% and OP -29.6%
In the restaurant industry, sales and the number of customers increased due an increase in demand for eating out due to the extremely hot summer, and a recovery in inbound sales supported by the weak yen. For drinking establishments, the number of customers during late hours and the demand for large banquets gradually returned, but overall recovery was delayed due to the lower number of establishments in the wake of COVID-19. Store subleasing sales increased +11.6% (sublease properties rose to 2,382, +10.7%). Although the number of contracts signed remained at a high level of 116 (3Q), the pace dipped from 40 to 28 in Oct. due to reorganization of the sales organization, subsequently posting a V-shaped rebound to 52 in Dec., a record high (see graph on P2). Store subleasing OP declined -15.6% due to GPM declining on the increase in costs (vacancy rents, construction, commissions, etc.) associated with aggressive sublease property purchases as well as a higher ratio of SG&A to sales from increased salary and recruiting expenses, executive compensation linked to the previous year’s strong performance, and DX system investments such as the move to electronic contracts, etc.
Real estate trading business sold 6 properties and acquired 8 as the wait-and-see trend in the market diminished with the normalization of economic and social activities (3Q-only 0 sold, 2 acquired), bringing total inventory to 8 as of the end of December. Net sales declined -45.2%, and OP declined -69.5% on postponed timing of property sales. The key takeaway from the graph below is the lack of property sales in the 3Q due to timing, expected to rebound in the 4Q, bringing an associated rebound in 4Q profits. Full-term forecasts were left unchanged.
PART ④ SHARE PRICE INSIGHTS
7-Year Monthly Share Price Chart, 6M/12M/24M MA, Volume and Valuation Trends
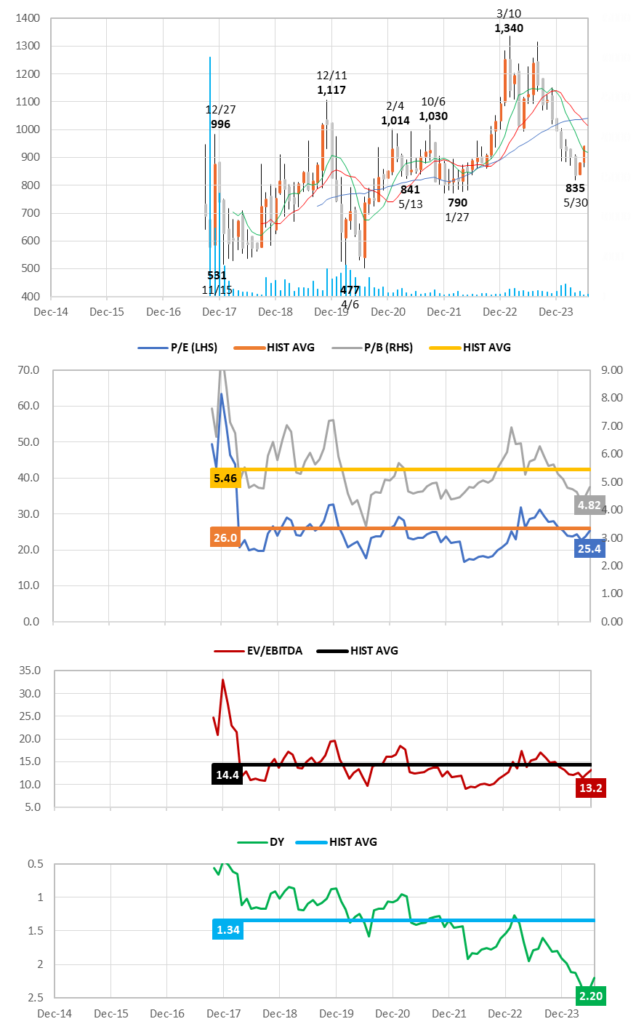
Source: compiled by Omega Investment from historical price data. Forecast values based on current Company estimates
Key takeaways:
❶ The current P/E and P/B are trading on discounts of 2.3% and 11.5%, respectively, to their historical averages. EV/EBITDA is trading on an 8.1% discount. Importantly, DY is trading 63.9% above its historical average.
❷ The equity ratio on the surface may appear low at 24.2%, however this reflects the fact that the B/S is comprised of a large amount of deposits paid and received (see B/S on P31). The Company is debt-free, and the B/S is extremely healthy.
❸ Following the revised dividend policy from FY24/3 raising target payout effectively from the 30% level → to the 40% level, DOE topped 10% for FY24/3, and the payout ratio is on course for a second consecutive year above 50% in FY25/3.
10-Year Monthly Relative Share Price Performance and Trend of GPM/OPM
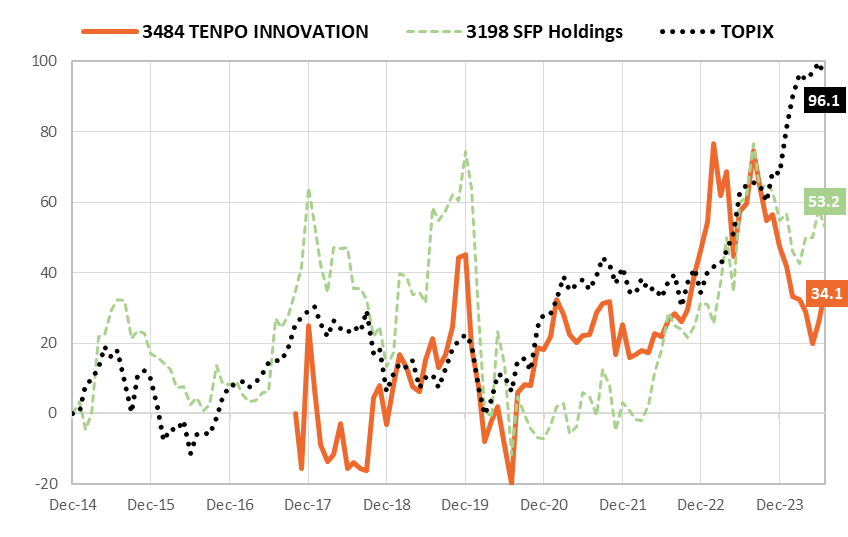
Sharp underperformance over the last three quarters can clearly be attributed to discounting margin deterioration in the short-term from leading upfront investments to capture the substantial growth opportunity going forward under the new holdings company structure.
While a second consecutive year of OP declining YoY is disappointing, the share price decline would seem to largely have discounted that, lowering expectations and leaving room for upside positive surprises as the enhanced sales organization goes into full swing.
Consolidated Balance Sheets
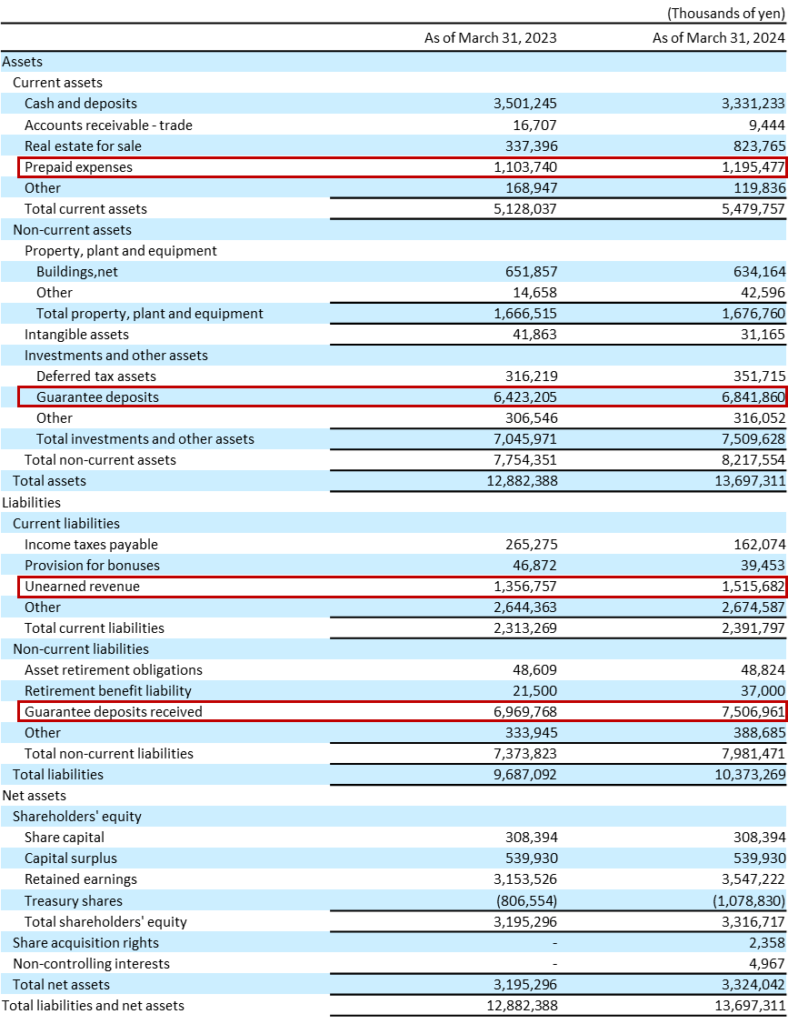
Source: compiled by Omega Investment from FY24/3 Annual Securities Report (YUHO financial statements).