2026-03-12
Home
Japanese

Omega Investment Co., Ltd.
Itoki (Company note – 2Q update)

| Share price (8/26) | ¥1,345 | Dividend Yield (24/12 CE) | 4.09 % |
| 52weeks high/low | ¥1,062/2,200 | ROE(23/12 act) | 11.28 % |
| Avg Vol (3 month) | 349 thou shrs | Operating margin (23/12 act) | 6.4 % |
| Market Cap | ¥71.8 bn | Beta (5Y Monthly) | 0.67 |
| Enterprise Value | ¥79.98 bn | Shares Outstanding | 53.38 mn shrs |
| PER (24/12 CE) | 9.32 X | Listed market | TSE Prime |
| PBR (23/12 act) | 1.41 X |
| Click here for the PDF version of this page |
| PDF Version |
2Q operating profit and ordinary profit in line with company expectations. Good visibility towards consecutive highest profits.
◇ FY12/2024 2Q financial highlights: operating profit and ordinary profit down slightly but in line with expectations
Itoki’s financial results for Q2 FY12/2024, announced on 5 August 2024, showed a slight YoY decline in operating profit and ordinary profit, although net sales and interim net profit attributable to owner of parent reached an all-time high. On a cumulative basis, sales were 72.51 billion yen (+6% YoY), operating profit was 6.86 billion yen (-2% YoY), ordinary profit was 6.83 billion yen (-3% YoY), and net profit attributable to owners of parent was 5.08 billion yen (+8% YoY). The company states that these are in line with its expectations.
Compared to the extremely strong first quarter, the current results appear weaker. However, there are many positive aspects to evaluate. The company is steadily increasing revenues in response to rising demand from customers for office renovations and relocations; it is expanding strategic expenditure to raise wages, recruit specialist personnel and strengthen its IT infrastructure, and is planting the seeds for future growth; operating profit and recurring profit are only slightly down YoY; the decline in gross profit margin is not due to a fall in profitability in each business, but to a change in the composition of sales. There is no need to regard these results as dampening the growth strategy.
Note that in PL, there was an extraordinary gain from the sale of non-business real estate and an extraordinary loss from the provision for related losses, while in BS, there are many points of interest, such as increasing short-term borrowings to acquire treasury shares and shorten the site for payables, and acquiring shares in a logistics subsidiary.
Another factor compensating for the slight decline in operating profit and ordinary profit is the increase in the dividend. It was announced that the dividend per share will be 55 yen, compared to 42 yen in the previous year and 52 yen in the initial forecast for the current year. The dividend payout ratio will be 38.4% for the current financial year, compared to 32.2% in the previous year, bringing the payout ratio close to the target of 40%. The dividend increase is a favorable decision for the company, which aims to pay a sustainable and stable dividend and shows its growing confidence in its business. The dividend yield is now approximately 4.3%, making the company more appealing to investors looking for a high dividend yield and stable growth.
◇ Full-year forecasts: company forecasts unchanged, with consecutive record profits.
The company’s full-year forecasts remain unchanged and call for sales of 137.5 billion yen (+3% YoY), operating profit of 10.0 billion yen (+17% YoY), ordinary profit of 10.0 billion yen (+16% YoY) and net profit attributable to owner of parent of 7.0 billion yen (+18% YoY) – in other words, the highest earnings in consecutive years.
Compared with the second half of the previous year, an increase of approximately 300 million yen in sales and 1.6 billion yen in operating profit would be required, but in terms of sales, demand for office renewals has strengthened nationwide, and the amount of business held is 4.8 percentage points higher than initially expected. In terms of profit, in addition to efforts to improve the gross margin, the effect of the price revision implemented in July is also expected, and the build-up of strategic expenditure that began in the second half of the previous year is also likely to run its course. At present, visibility for the full-year forecast is good.
◇ Additional points of interest presented at the results briefing
The names of 20 individual companies that have introduced Data Trekking, which embodies Office 3.0, were introduced. Next, it was explained that, as part of the supply chain reform, Itoki Engineering Service was integrated on 1 July, that the creation of a system to create projects from the upstream would progress, and that, concerning this, the company had won its first major project, which was expected to start contributing to earnings in 4Q. Finally, as examples of new market entries, the release of a dispensing picking system and special doors for disaster prevention shelters is scheduled for the next fiscal year.
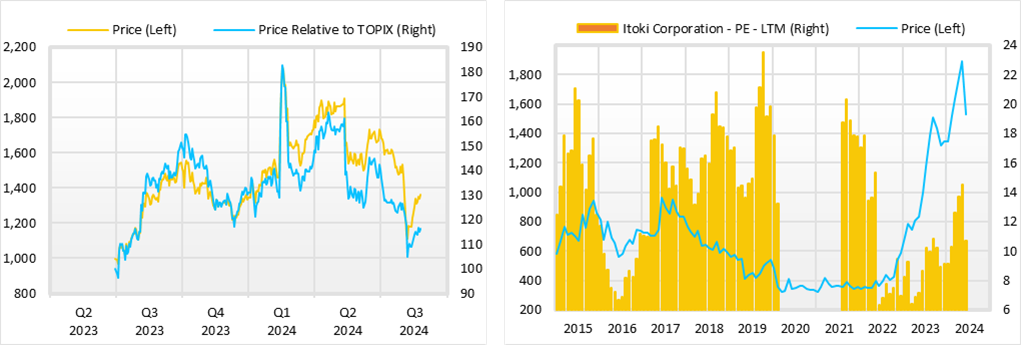
◇ Share price trends and future points of interest
The company’s share price has been on an upward trend since President Minato took over but entered an adjustment phase during the year under review.
However, the enthusiasm for investment in human capital due to the shortage of working people in Japan is qualitatively changing the way offices are being used, and the company’s efforts to respond to this by providing enhanced customer value remain firm in the company’s approach. The share price will likely return to an uptrend as it becomes more confident that the company will meet its forecasts for the current fiscal year and that its growth strategy for the next fiscal year and beyond will take shape.
Company profile
Itoki Corporation (Itoki) is an office furniture manufacturer that designs tomorrow’s “workstyles”. It was founded in 1890. In addition to office furniture manufacturing, the company is also involved in construction and interior decoration. In 2022, Koji Minato was appointed president, and the company’s corporate structure has been transformed under his leadership. The company has advocated Office DX and Office 3.0 and is working to add high value. Under its three-year medium-term management plan, RISE TO GROWTH 2026, which ends in FY2026, the company is promoting the priority strategy ‘7 Flags’ and ESG strategies under the theme of ‘enhancing sustainable growth’. The plan aims to achieve sales of 150 billion yen, operating profit of 14 billion yen and ROE of 15% in FY2026.
Key financial data
| Unit: million yen | 2019/12 | 2020/12 | 2021/12 | 2022/12 | 2023/12 | 2024/12 CE |
| Sales | 122,174 | 116,210 | 115,905 | 123,324 | 132,985 | 137,500 |
| EBIT (Operating Income) | 686 | 1,585 | 2,561 | 4,582 | 8,524 | 10,000 |
| Pretax Income | 938 | 1,277 | 1,523 | 8,372 | 8,378 | |
| Net Profit Attributable to Owner of Parent | -550 | -235 | 1,166 | 5,294 | 5,905 | 7,000 |
| Cash & Short-Term Investments | 17,030 | 18,246 | 17,451 | 26,976 | 24,795 | |
| Total assets | 108,778 | 105,096 | 103,898 | 115,288 | 117,437 | |
| Total Debt | 17,308 | 17,308 | 17,308 | 17,308 | 17,308 | |
| Net Debt | -7,487 | -7,487 | -7,487 | -7,487 | -7,487 | |
| Total liabilities | 62,940 | 60,901 | 58,818 | 65,374 | 62,434 | |
| Total Sharehjolders’ Equity | 54,960 | 54,960 | 54,960 | 54,960 | 54,960 | |
| Net Operating Cash Flow | 3,586 | 4,561 | 2,774 | 5,804 | 6,321 | |
| Capital Expenditure | 3,316 | 3,316 | 3,316 | 3,316 | 3,316 | |
| Net Investing Cash Flow | -3,221 | -1,152 | -1,170 | 4,923 | -4,012 | |
| Net Financing Cash Flow | 0 | -2,267 | -2,658 | -1,426 | -4,148 | |
| Free Cash Flow | 3,005 | 3,005 | 3,005 | 3,005 | 3,005 | |
| ROA (%) | -0.51 | -0.22 | 1.12 | 4.83 | 5.08 | |
| ROE (%) | -1.19 | -0.53 | 2.63 | 11.17 | 11.27 | |
| EPS (Yen) | -12.1 | -5.2 | 25.8 | 117.0 | 130.3 | |
| BPS (Yen) | 995.8 | 970.4 | 993.9 | 1,101.3 | 1,212.0 | |
| Dividend per Share (Yen) | 13.00 | 13.00 | 15.00 | 37.00 | 42.00 | |
| Shares Outstanding (Milion shrs) | 53.38 | 53.38 | 53.38 | 53.38 | 53.38 |
Source: Omega Investment from company data, rounded to the nearest whole number.
Share price
Quarterly topics
【Analysis of factors contributing to changes in operating profit in the first half of the year】
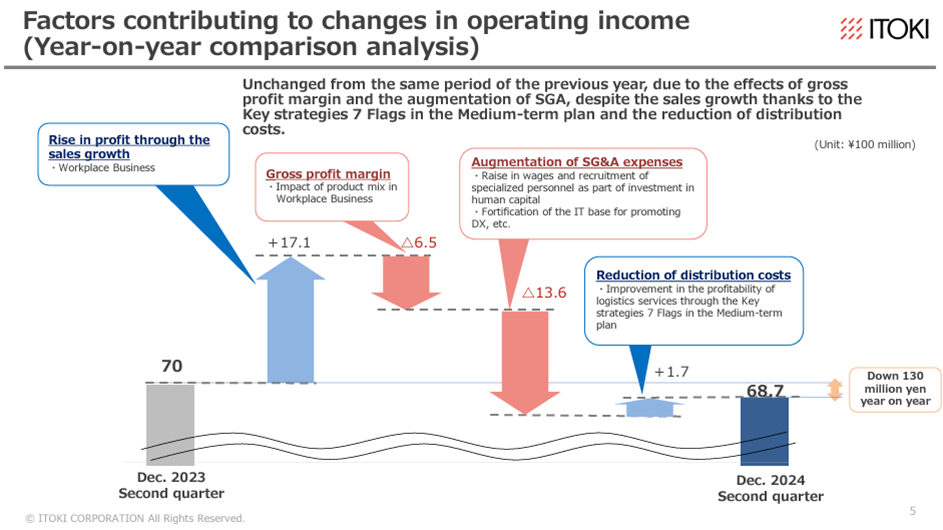
Source: Omega Investment from company materials
【Status of business negotiations in FY2024】
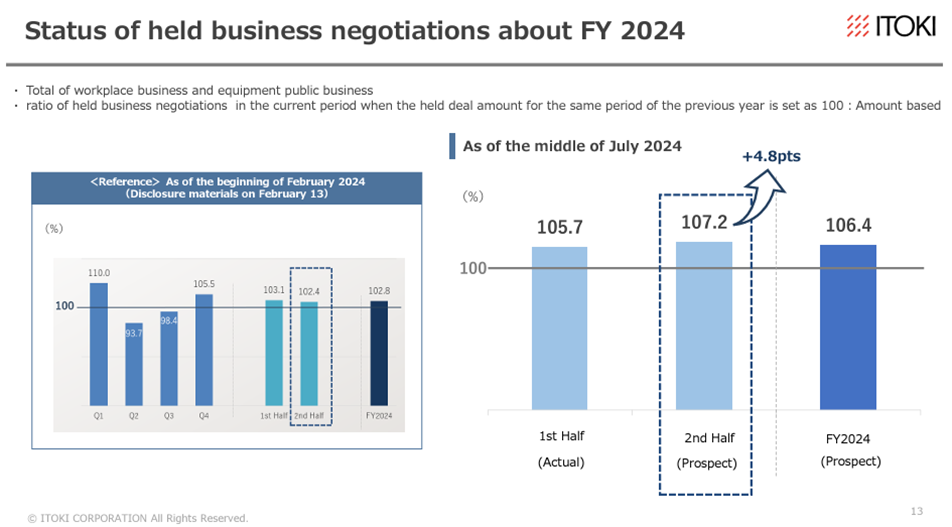
Source: Omega Investment from company materials
【Analysis of factors behind the increase/decrease in operating profit forecast for the second half of the year】
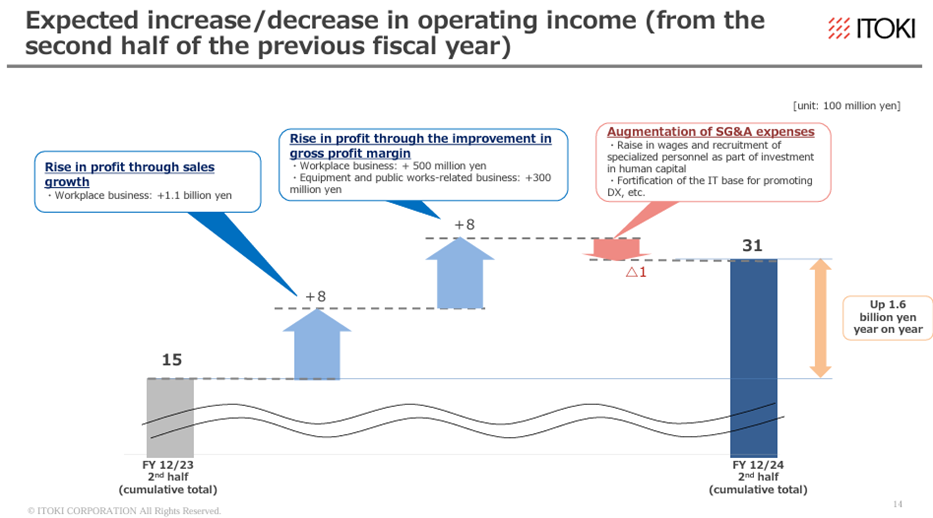
Source: Omega Investment from company materials
【Progress of the 7 Flags, the key strategies of the medium-term management plan】
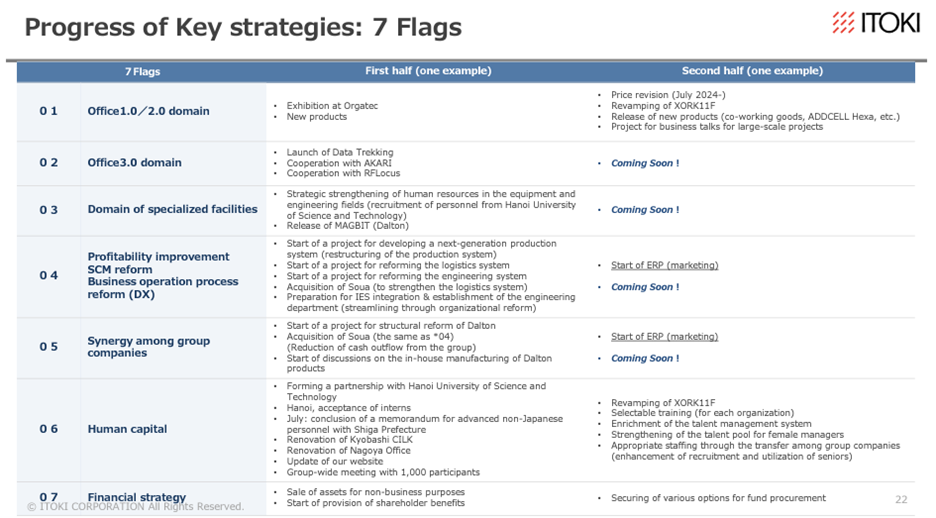
Source: Omega Investment from company materials
Financial data (quarterly basis)
| Unit: million yen | 2022/12 | 2023/12 | 2024/12 | ||||||
| 2Q | 3Q | 4Q | 1Q | 2Q | 3Q | 4Q | 1Q | 2Q | |
| (Income Statement) | |||||||||
| Sales | 28,411 | 26,205 | 33,363 | 36,965 | 31,225 | 28,667 | 36,128 | 40,918 | 31,592 |
| Year-on-year | -3.6% | 16.9% | 4.7% | 4.6% | 9.9% | 9.4% | 8.3% | 10.7% | 1.2% |
| Cost of Goods Sold (COGS) | 18,030 | 16,679 | 21,384 | 22,216 | 18,955 | 17,483 | 22,090 | 24,545 | 19,888 |
| Gross Income | 10,381 | 9,526 | 11,979 | 14,749 | 12,270 | 11,184 | 14,038 | 16,373 | 11,704 |
| Gross Income Margin | 36.5% | 36.4% | 35.9% | 39.9% | 39.3% | 39.0% | 38.9% | 40.0% | 37.0% |
| SG&A Expense | 9,973 | 9,812 | 11,484 | 9,970 | 10,047 | 11,006 | 12,694 | 10,333 | 10,878 |
| EBIT (Operating Income) | 408 | -286 | 495 | 4,779 | 2,223 | 178 | 1,344 | 6,040 | 826 |
| Year-on-year | -68.0% | -77.0% | -40.3% | 20.5% | 444.9% | -162.2% | 171.5% | 26.4% | -62.8% |
| Operating Income Margin | 1.4% | -1.1% | 1.5% | 12.9% | 7.1% | 0.6% | 3.7% | 14.8% | 2.6% |
| EBITDA | 1,189 | 556 | 1,342 | 5,522 | 2,906 | 910 | 2,079 | 6,753 | 1,582 |
| Pretax Income | 516 | -211 | 3,351 | 4,804 | 2,275 | 363 | 936 | 6,006 | 1,328 |
| Consolidated Net Income | 269 | -190 | 1,767 | 3,297 | 1,411 | 202 | 997 | 4,104 | 985 |
| Minority Interest | -18 | -32 | -10 | 1 | 0 | 0 | 0 | 2 | 1 |
| Net Income ATOP | 288 | -159 | 1,777 | 3,296 | 1,411 | 202 | 996 | 4,101 | 985 |
| Year-on-year | -17.2% | -89.0% | 462.3% | -2.7% | 389.9% | -227.0% | -44.0% | 24.4% | -30.2% |
| Net Income Margin | 1.0% | -0.6% | 5.3% | 8.9% | 4.5% | 0.7% | 2.8% | 10.0% | 3.1% |
| (Balance Sheet) | |||||||||
| Cash & Short-Term Investments | 20,173 | 17,238 | 26,976 | 20,908 | 24,788 | 23,292 | 24,795 | 24,751 | 28,513 |
| Total assets | 111,492 | 108,000 | 115,288 | 115,841 | 111,693 | 111,573 | 117,437 | 127,459 | 120,701 |
| Total Debt | 19,150 | 19,004 | 19,487 | 18,387 | 17,361 | 17,342 | 17,308 | 38,662 | 41,566 |
| Net Debt | -1,023 | 1,766 | -7,489 | -2,521 | -7,427 | -5,950 | -7,487 | 13,911 | 13,053 |
| Total liabilities | 63,154 | 59,831 | 65,374 | 64,090 | 58,270 | 57,730 | 62,434 | 81,595 | 73,584 |
| Total Sharehjolders’ Equity | 48,254 | 48,117 | 49,871 | 51,709 | 53,379 | 53,800 | 54,960 | 45,818 | 47,068 |
| (Profitability %) | |||||||||
| ROA | 2.37 | 3.66 | 4.83 | 4.49 | 5.67 | 6.09 | 5.08 | 5.52 | 5.41 |
| ROE | 5.48 | 8.28 | 11.17 | 10.45 | 12.45 | 13.12 | 11.27 | 13.76 | 12.51 |
| (Per-share) Unit: JPY | |||||||||
| EPS | 6.4 | -3.5 | 39.2 | 72.8 | 31.1 | 4.5 | 22.0 | 85.7 | 19.1 |
| BPS | 1,067.4 | 1,062.6 | 1,101.3 | 1,141.9 | 1,177.1 | 1,186.4 | 1,212.0 | 933.1 | 956.6 |
| Dividend per Share | 15.00 | 15.00 | 37.00 | 37.00 | 37.00 | 37.00 | 42.00 | 42.00 | 42.00 |
| Shares Outstanding (milion shrs) | 45.66 | 45.66 | 45.66 | 45.66 | 45.66 | 45.66 | 45.66 | 53.38 | 53.38 |
Source: Omega Investment from company materials
Financial data (full-year basis)
| Unit: million yen | 2013/12 | 2014/12 | 2015/12 | 2016/12 | 2017/12 | 2018/12 | 2019/12 | 2020/12 | 2021/12 | 2022/12 | 2023/12 |
| (Income Statement) | |||||||||||
| Sales | 103,461 | 102,993 | 106,516 | 101,684 | 108,684 | 118,700 | 122,174 | 116,210 | 115,905 | 123,324 | 132,985 |
| Year-on-year | -1.9% | -0.5% | 3.4% | -4.5% | 6.9% | 9.2% | 2.9% | -4.9% | -0.3% | 6.4% | 7.8% |
| Cost of Goods Sold | 67,182 | 66,858 | 68,424 | 65,071 | 70,012 | 77,479 | 80,712 | 74,536 | 74,186 | 77,575 | 80,744 |
| Gross Income | 36,279 | 36,135 | 38,092 | 36,613 | 38,672 | 41,221 | 41,462 | 41,674 | 41,719 | 45,749 | 52,241 |
| Gross Income Margin | 35.1% | 35.1% | 35.8% | 36.0% | 35.6% | 34.7% | 33.9% | 35.9% | 36.0% | 37.1% | 39.3% |
| SG&A Expense | 32,204 | 33,711 | 33,949 | 33,862 | 35,761 | 39,336 | 40,776 | 40,089 | 39,158 | 41,167 | 43,717 |
| EBIT (Operating Income) | 4,075 | 2,424 | 4,143 | 2,751 | 2,911 | 1,885 | 686 | 1,585 | 2,561 | 4,582 | 8,524 |
| Year-on-year | 20.7% | -40.5% | 70.9% | -33.6% | 5.8% | -35.2% | -63.6% | 131.0% | 61.6% | 78.9% | 86.0% |
| Operating Income Margin | 3.9% | 2.4% | 3.9% | 2.7% | 2.7% | 1.6% | 0.6% | 1.4% | 2.2% | 3.7% | 6.4% |
| EBITDA | 6,735 | 5,055 | 6,551 | 5,316 | 5,551 | 4,615 | 4,436 | 5,603 | 6,148 | 7,821 | 11,417 |
| Pretax Income | 4,872 | 3,171 | 4,246 | 2,918 | 3,401 | 3,083 | 938 | 1,277 | 1,523 | 8,372 | 8,378 |
| Consolidated Net Income | 3,995 | 2,355 | 4,631 | 1,850 | 2,442 | 1,744 | -579 | -355 | 933 | 5,181 | 5,907 |
| Minority Interest | 85 | 195 | 101 | -56 | 40 | 19 | -28 | -119 | -233 | -113 | 1 |
| Net Income ATOP | 3,910 | 2,160 | 4,530 | 1,907 | 2,402 | 1,725 | -550 | -235 | 1,166 | 5,294 | 5,905 |
| Year-on-year | 44.7% | -44.8% | 109.7% | -57.9% | 26.0% | -28.2% | -131.9% | -57.3% | -596.2% | 354.0% | 11.5% |
| Net Income Margin | 3.8% | 2.1% | 4.3% | 1.9% | 2.2% | 1.5% | -0.5% | -0.2% | 1.0% | 4.3% | 4.4% |
| (Balance Sheet) | |||||||||||
| Cash & Short-Term Investments | 19,630 | 22,132 | 21,533 | 19,839 | 19,977 | 16,529 | 17,030 | 18,246 | 17,451 | 26,976 | 24,795 |
| Total assets | 95,261 | 96,721 | 98,175 | 95,681 | 102,451 | 108,710 | 108,778 | 105,096 | 103,898 | 115,288 | 117,437 |
| Total Debt | 19,285 | 18,916 | 18,927 | 19,931 | 17,892 | 16,834 | 22,166 | 21,742 | 20,091 | 19,487 | 17,308 |
| Net Debt | -345 | -3,216 | -2,606 | 92 | -2,085 | 305 | 5,136 | 3,496 | 2,640 | -7,489 | -7,487 |
| Total liabilities | 52,235 | 53,532 | 50,864 | 50,275 | 54,997 | 61,200 | 62,940 | 60,901 | 58,818 | 65,374 | 62,434 |
| Total Shareholders’ Equity | 41,079 | 41,632 | 45,677 | 44,949 | 46,863 | 46,857 | 45,370 | 43,812 | 44,931 | 49,871 | 54,960 |
| (Cash Flow) | |||||||||||
| Net Operating Cash Flow | 3,162 | 5,715 | 4,522 | 5,073 | 3,565 | 1,384 | 3,586 | 4,561 | 2,774 | 5,804 | 6,321 |
| Capital Expenditure | 2,800 | 1,400 | 1,114 | 1,641 | 1,333 | 3,477 | 3,226 | 1,729 | 2,110 | 4,145 | 3,316 |
| Net Investing Cash Flow | -1,978 | -1,742 | -803 | -4,044 | -2,971 | -3,094 | -3,221 | -1,152 | -1,170 | 4,923 | -4,012 |
| Net Financing Cash Flow | 51 | -2,179 | -3,807 | -2,571 | -706 | -2,463 | 0 | -2,267 | -2,658 | -1,426 | -4,148 |
| Free Cash Flow | 362 | 4,315 | 3,408 | 3,664 | 2,342 | -1,924 | 635 | 2,832 | 664 | 1,659 | 3,005 |
| (Profitability %) | |||||||||||
| ROA | 4.24 | 2.25 | 4.65 | 1.97 | 2.42 | 1.63 | -0.51 | -0.22 | 1.12 | 4.83 | 5.08 |
| ROE | 10.15 | 5.22 | 10.38 | 4.21 | 5.23 | 3.68 | -1.19 | -0.53 | 2.63 | 11.17 | 11.27 |
| (Per-share) Unit: JPY | |||||||||||
| EPS | 78.2 | 42.8 | 91.6 | 40.1 | 52.7 | 37.8 | -12.1 | -5.2 | 25.8 | 117.0 | 130.3 |
| BPS | 814.8 | 825.8 | 953.5 | 986.8 | 1,028.9 | 1,027.4 | 995.8 | 970.4 | 993.9 | 1,101.3 | 1,212.0 |
| Dividend per Share | 13.00 | 13.00 | 13.00 | 13.00 | 13.00 | 13.00 | 13.00 | 13.00 | 15.00 | 37.00 | 42.00 |
| Shares Outstanding (milion shrs) | 52.14 | 52.14 | 52.14 | 52.14 | 52.14 | 45.61 | 45.66 | 45.66 | 45.66 | 45.66 | 45.66 |
Source: Omega Investment from company materials