2026-04-02
Home
Japanese

Omega Investment Co., Ltd.
Cosmo Bio (Company note – 2Q update)

| Share price (8/30) | ¥1,100 | Dividend Yield (24/12 CE) | 4.6 % |
| 52weeks high/low | ¥888/1,122 | ROE(23/12) | 5.4 % |
| Avg Vol (3 month) | 8.9 thou shrs | Operating margin (23/12) | 5.6 % |
| Market Cap | ¥6.65 bn | Beta (5Y Monthly) | 0.3 |
| Enterprise Value | ¥3.33 bn | Shares Outstanding | 6.048 mn shrs |
| PER (24/12 CE) | 20.7 X | Listed market | TSE Standard |
| PBR (23/12 act) | 0.7 X |
| Click here for the PDF version of this page |
| PDF Version |
Cumulative 2Q results exceeded the plan despite higher revenues and lower profits. Long-awaited measures to increase corporate value materialise. First, a full-year dividend increase has been announced.
◇ Financial highlights for the second quarter of 2024
Cosmo Bio’s 2Q FY12/2024 results, announced on August 5, 2024, showed an increase in sales and a decrease in profits but were above the company’s forecasts. On a cumulative basis, sales were 5.12 billion yen (+6% YoY), operating profit 320 million yen (-29% YoY), ordinary profit 330 million yen (-38% YoY) and interim net profit attributable to owner of parent 250 million yen (-28% YoY).
Sales exceeded the forecast due to solid reagent sales and a recovery in contract services and consumables. However, the yen/US dollar exchange rate of 149 yen (14 yen lower than the previous year) caused the gross profit margin to decline, and an increase in personnel and other costs resulted in a decline in profit. There was no significant change in the consolidated balance sheet, but investment securities increased due to higher share prices and the IPO of Kohjin Bio Co., Ltd.
◇ Forecasts for the full year ending 31 December 2024
The company has left its full-year forecasts unchanged from the beginning of the year. Assuming an exchange rate of 150 yen to the dollar in the second half of the year, the company forecasts net sales of 9.80 billion yen (+4% YoY), operating profit of 390 million yen (-25% YoY), ordinary profit of 450 million yen (-31% YoY) and net profit attributable to owner of parent of 310 million yen (-30% YoY).
Despite better-than-expected Q2 results and a weaker-than-expected yen, the company does not believe it is necessary to make any changes to its initial forecasts, given the uncertainty in the foreign exchange market.
◇ Announcement of measures to enhance corporate value and dividend increase
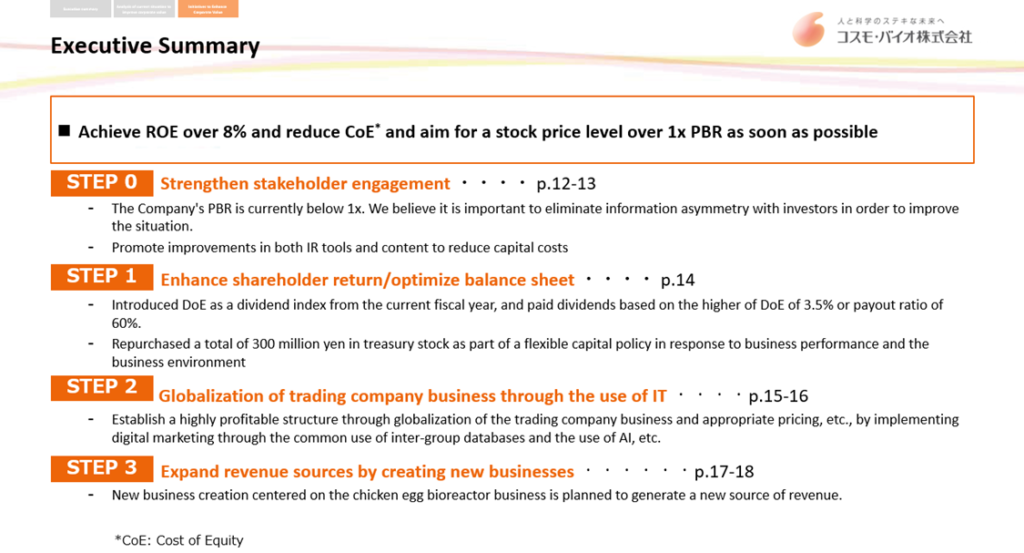
In conjunction with announcing these results, the company disclosed its policy on initiatives to enhance corporate value, entitled ‘Towards achieving management that is conscious of the cost of capital and share price’. This is a step forward from the already disclosed medium-term management plan and is directly linked to enhancing corporate value.
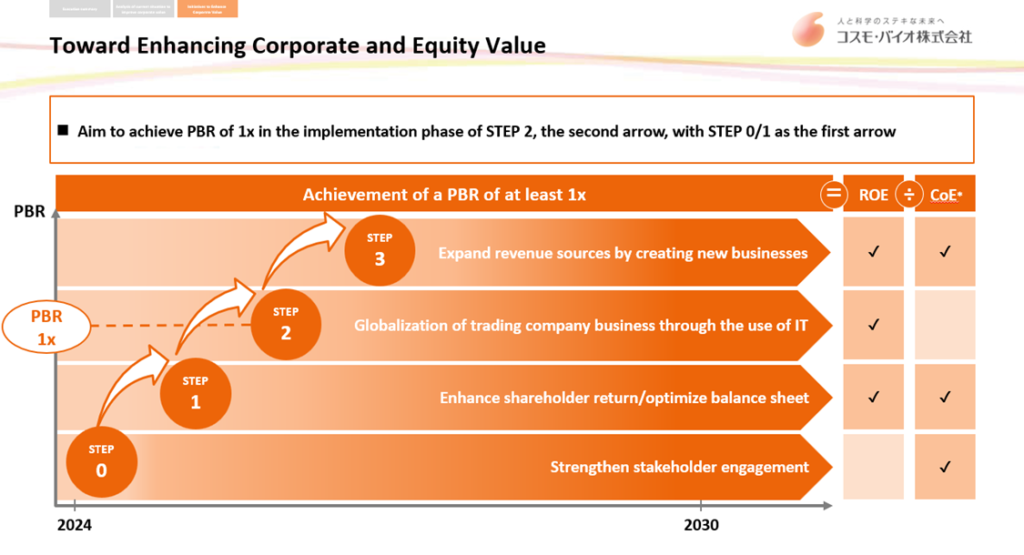
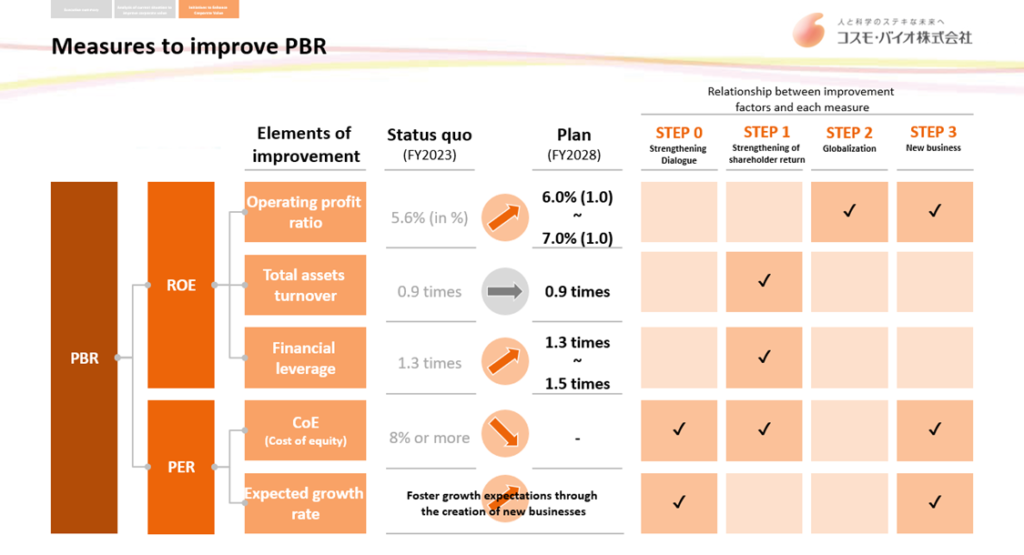
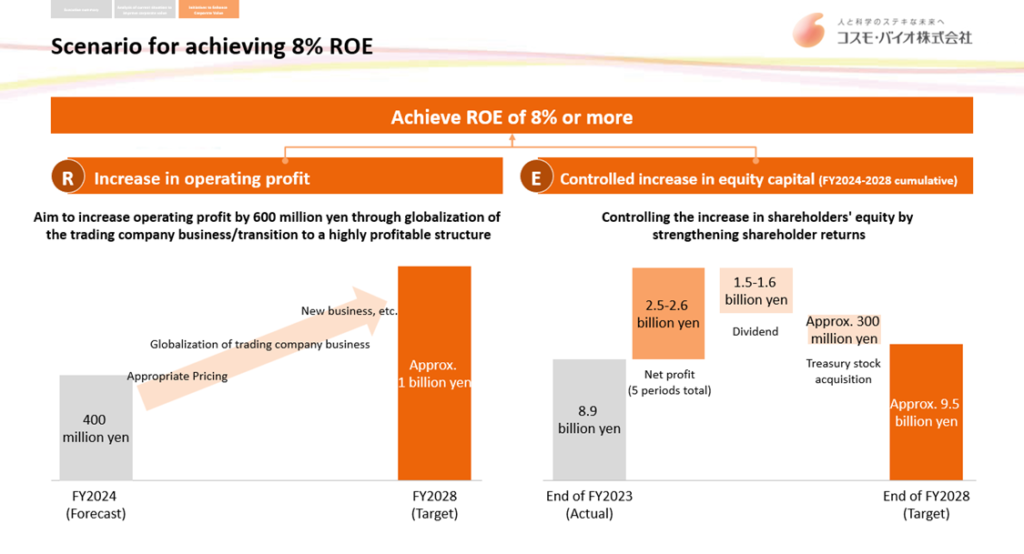
The framework of this plan is to build a business structure that consistently achieves an ROE of 8%, even in a weak yen environment, while recognising that the cost of equity is over 8% and promoting efforts to reduce it, resulting in a PBR in excess of 1x.
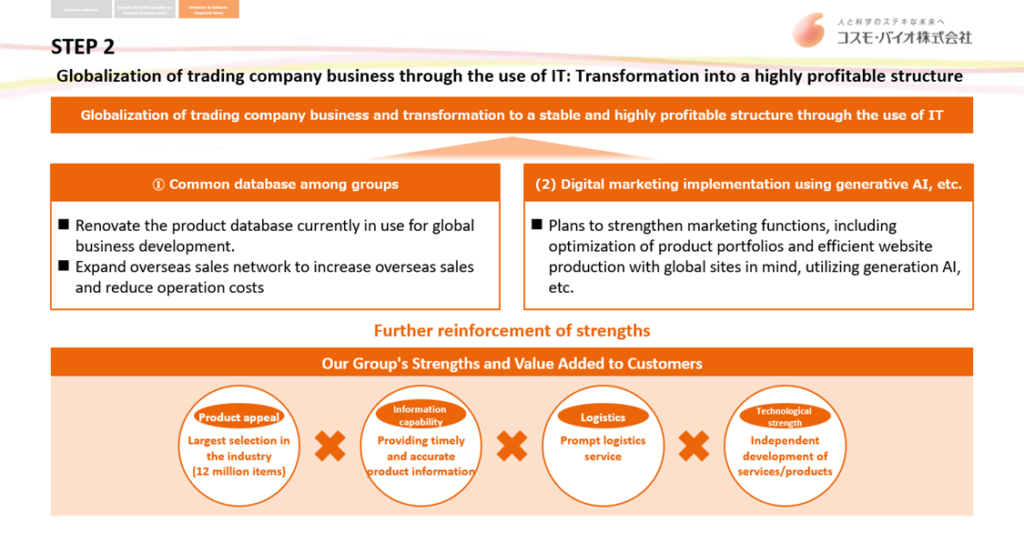
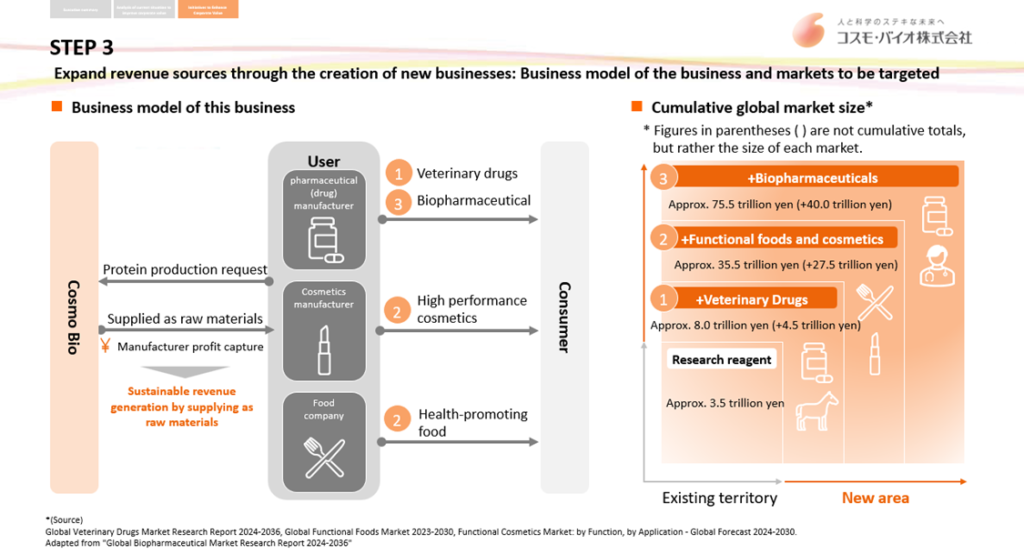
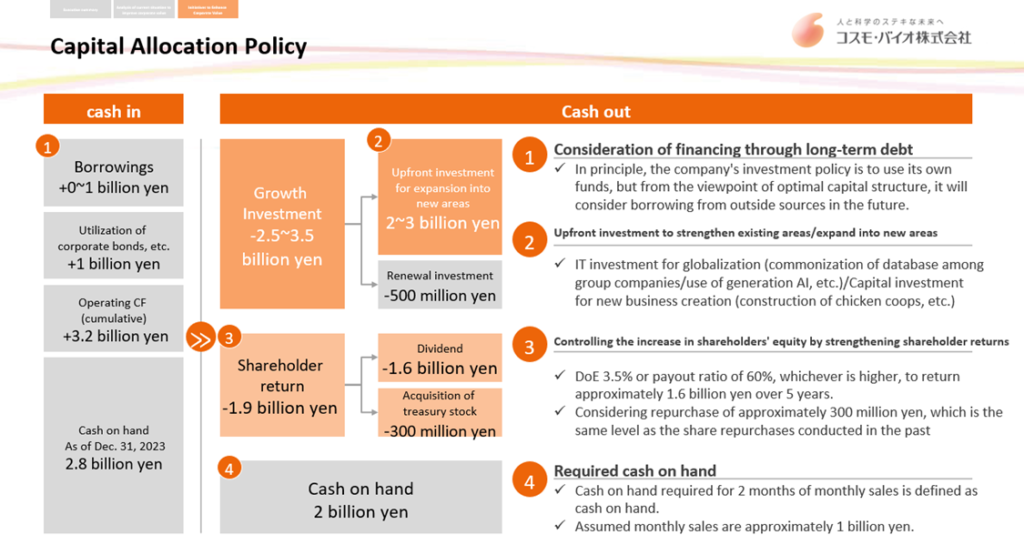
Specifically, this will be achieved in four steps. Firstly, strengthening engagement with stakeholders; secondly, boosting shareholder returns and optimising the balance sheet; furthermore, globalising the trading company business through IT (increasing profits and reducing foreign exchange risks by strengthening exports), and creating new businesses.
The company immediately introduced the dividend on equity (DoE) indicator and decided to pay dividends based on a higher of DoE of 3.5% or a payout ratio of 60% until the ROE exceeds 8%. The full-year dividend was immediately raised from 30 yen a share to 50 yen. The company has also announced a share buyback of up to 300 million yen, which is highly noteworthy as it demonstrates its commitment to achieving an ROE of 8% as quickly as possible by controlling the denominator of the ROE.
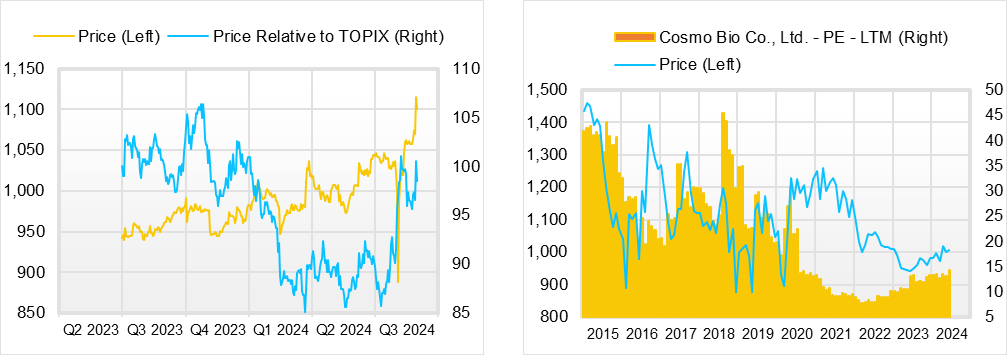
◇ Share price trends and future points of interest
The company’s share price was affected by the aftermath of the sharp fall in the overall stock market in early August 2024. However, in general, the share price has been rising over the past year, and a tendency has been formed for the share price to rise when the yen is strong, factoring in the benefit of this to the earnings.
The shares are valued roughly at a PER of 20x, PBR of 0.7x and expected dividend yield of 4.7%. There is little downside risk to the share price, while the company has just shown a path to medium-term earnings growth and ROE improvement, and if the yen remains strong, profits are expected to rise. Hence, the investor Interest in the company’s shares as one of the changing Japanese corporates is likely to increase.
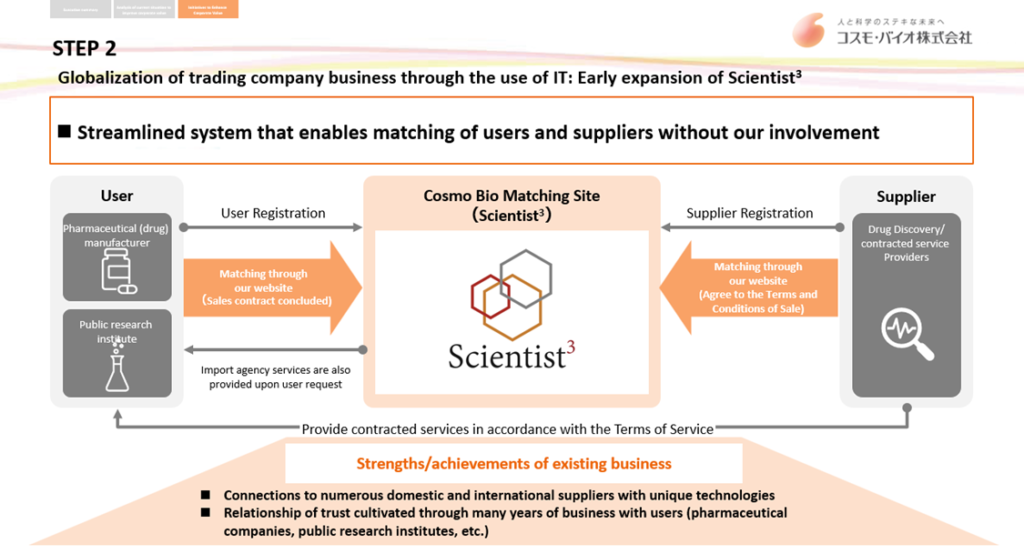
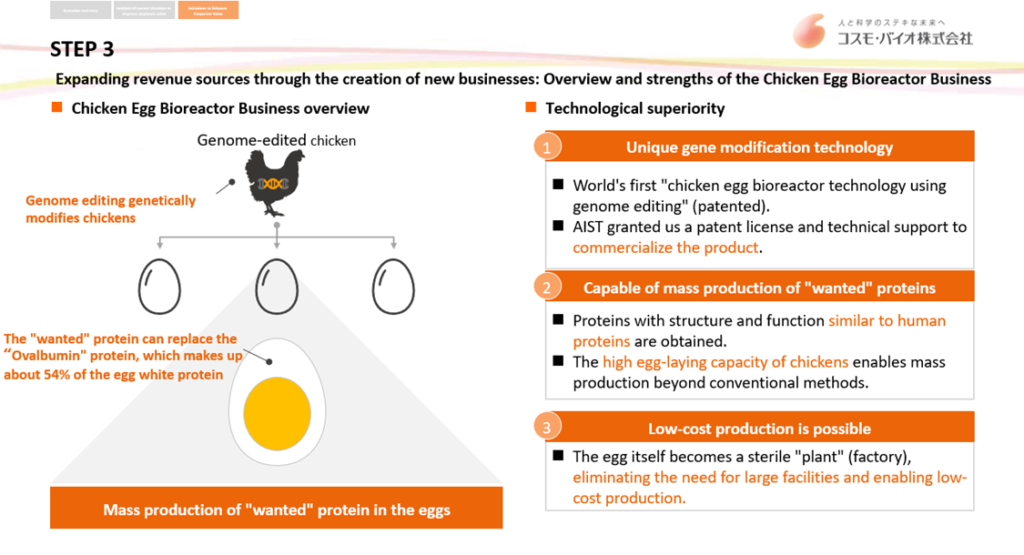
The focus will be on whether the yen’s depreciation will end and how the profit growth strategy will gradually take hold. In particular, we look forward to the globalisation of the trading company business, the launch of Scientist3, a matching website for contracted services, and the visualisation of the potential of the egg bioreactor business.
Company profile
Cosmo Bio Co., Ltd. is a trading company specialising in biotechnology with the objective of ‘contributing to the advancement of life science’. It is one of the leading providers of life science research reagents, offering as many as 12 million items from approximately 500 manufacturers worldwide. In recent years, it has expanded its trading company functions globally and entered into contract services and proprietary manufacturing and sales business. Expectations are high for this contribution to earnings, improved capital efficiency and higher PBR.
Key financial data
| Unit: million yen | 2019/12 | 2020/12 | 2021/12 | 2022/12 | 2023/12 | 2024/12CE |
| Sales | 7,590 | 8,092 | 9,231 | 9,553 | 9,340 | 9,800 |
| EBIT (Operating Income) | 406 | 753 | 1,050 | 817 | 521 | 390 |
| Pretax Income | 388 | 1,008 | 1,099 | 790 | 653 | 450 |
| Net Profit Attributable to Owner of Parent | 237 | 674 | 737 | 517 | 442 | 310 |
| Cash & Short-Term Investments | 2,516 | 3,259 | 3,555 | 3,036 | 3,025 | |
| Total assets | 8,890 | 9,640 | 10,072 | 10,313 | 10,872 | |
| Total Debt | 25 | 25 | 25 | 25 | 25 | |
| Net Debt | -3,000 | -3,000 | -3,000 | -3,000 | -3,000 | |
| Total liabilities | 1,566 | 1,776 | 1,750 | 1,693 | 1,844 | |
| Total Shareholders’ Equity | 8,445 | 8,445 | 8,445 | 8,445 | 8,445 | |
| Net Operating Cash Flow | 569 | 803 | 648 | 306 | 744 | |
| Capital Expenditure | 120 | 120 | 120 | 120 | 120 | |
| Net Investing Cash Flow | -135 | 42 | -145 | -313 | -766 | |
| Net Financing Cash Flow | -85 | -97 | -420 | -236 | -201 | |
| Free Cash Flow | 677 | 677 | 677 | 677 | 677 | |
| ROA (%) | 2.74 | 7.27 | 7.48 | 5.07 | 4.17 | |
| ROE (%) | 3.55 | 9.49 | 9.73 | 6.53 | 5.36 | |
| EPS (Yen) | 40.0 | 113.7 | 126.9 | 89.1 | 75.8 | |
| BPS (Yen) | 1,154.4 | 1,241.2 | 1,344.5 | 1,385.1 | 1,447.2 | |
| Dividend per Share (Yen) | 14.00 | 34.00 | 36.00 | 36.00 | 30.00 | |
| Shares Outstanding (Million shrs) | 6.05 | 6.05 | 6.05 | 6.05 | 6.05 |
Source: Omega Investment from company data, rounded to the nearest whole number.
Share price
Key points in ‘Towards cost of capital and share price conscious management’
Source: Omega Investment from company materials
Source: Omega Investment from company materials
Source: Omega Investment from company materials
Source: Omega Investment from company materials
Source: Omega Investment from company materials
Source: Omega Investment from company materials
Source: Omega Investment from company materials
Source: Omega Investment from company materials
Source: Omega Investment from company materials
Financial data (quarterly basis)
| Unit: million yen | 2022/12 | 2023/12 | 2024/12 | ||||||
| 2Q | 3Q | 4Q | 1Q | 2Q | 3Q | 4Q | 1Q | 2Q | |
| (Income Statement) | |||||||||
| Sales | 2,064 | 2,016 | 2,426 | 2,828 | 1,999 | 2,050 | 2,463 | 2,943 | 2,186 |
| Year-on-year | 5.5% | -1.5% | 3.2% | -7.2% | -3.1% | 1.7% | 1.5% | 4.1% | 9.4% |
| Cost of Goods Sold (COGS) | 1,345 | 1,305 | 1,576 | 1,789 | 1,273 | 1,350 | 1,678 | 1,956 | 1,460 |
| Gross Income | 719 | 711 | 850 | 1,039 | 726 | 700 | 785 | 987 | 726 |
| Gross Income Margin | 34.8% | 35.3% | 35.0% | 36.7% | 36.3% | 34.1% | 31.9% | 33.5% | 33.2% |
| SG&A Expense | 672 | 635 | 736 | 638 | 668 | 711 | 712 | 681 | 708 |
| EBIT (Operating Income) | 47 | 76 | 114 | 401 | 58 | -11 | 73 | 306 | 18 |
| Year-on-year | -72.0% | -57.5% | -26.0% | -30.9% | 23.4% | -114.5% | -36.0% | -23.7% | -69.0% |
| Operating Income Margin | 2.3% | 3.8% | 4.7% | 14.2% | 2.9% | -0.5% | 3.0% | 10.4% | 0.8% |
| EBITDA | 81 | 112 | 153 | 435 | 94 | 28 | 112 | 336 | 50 |
| Pretax Income | 55 | 70 | 100 | 416 | 136 | 2 | 99 | 353 | 37 |
| Consolidated Net Income | 40 | 51 | 76 | 279 | 98 | 1 | 83 | 240 | 27 |
| Minority Interest | -2 | 5 | 13 | 15 | 1 | -5 | 8 | 10 | -2 |
| Net Income ATOP | 41 | 47 | 63 | 264 | 97 | 5 | 76 | 230 | 28 |
| Year-on-year | -73.9% | -62.4% | -48.4% | -27.9% | 136.6% | -89.4% | 20.6% | -12.9% | -71.1% |
| Net Income Margin | 2.0% | 2.3% | 2.6% | 9.3% | 4.9% | 0.2% | 3.1% | 7.8% | 1.3% |
| (Balance Sheet) | |||||||||
| Cash & Short-Term Investments | 3,570 | 3,347 | 3,036 | 3,026 | 3,852 | 3,637 | 3,025 | 2,813 | 3,224 |
| Total assets | 10,315 | 10,098 | 10,313 | 10,695 | 10,852 | 10,773 | 10,872 | 11,594 | 11,739 |
| Total Debt | 131 | 136 | 27 | 183 | 228 | 219 | 25 | 316 | 418 |
| Net Debt | -3,439 | -3,211 | -3,009 | -2,843 | -3,624 | -3,418 | -3,000 | -2,497 | -2,806 |
| Total liabilities | 1,762 | 1,565 | 1,693 | 1,865 | 1,762 | 1,772 | 1,844 | 2,101 | 1,953 |
| Total Sharehjolders’ Equity | 8,004 | 7,979 | 8,052 | 8,250 | 8,509 | 8,426 | 8,445 | 8,903 | 9,197 |
| (Profitability %) | |||||||||
| ROA | 6.56 | 5.79 | 5.07 | 3.91 | 4.44 | 4.12 | 4.17 | 3.66 | 3.01 |
| ROE | 8.44 | 7.34 | 6.53 | 5.13 | 5.69 | 5.24 | 5.36 | 4.76 | 3.84 |
| (Per-share) Unit: JPY | |||||||||
| EPS | 7.1 | 8.1 | 10.8 | 45.4 | 16.6 | 0.9 | 13.0 | 39.4 | 4.8 |
| BPS | 1,376.4 | 1,372.3 | 1,385.1 | 1,419.2 | 1,458.0 | 1,443.9 | 1,447.2 | 1,525.8 | 1,569.7 |
| Dividend per Share | 36.00 | 36.00 | 36.00 | 36.00 | 36.00 | 36.00 | 30.00 | 30.00 | 30.00 |
| Shares Outstanding(million shrs) | 6.05 | 6.05 | 6.05 | 6.05 | 6.05 | 6.05 | 6.05 | 6.05 | 6.05 |
Source: Omega Investment from company materials
Financial data (full-year basis)
| Unit: million yen | 2014/12 | 2015/12 | 2016/12 | 2017/12 | 2018/12 | 2019/12 | 2020/12 | 2021/12 | 2022/12 | 2023/12 |
| (Income Statement) | ||||||||||
| Sales | 7,235 | 7,357 | 7,427 | 7,068 | 7,261 | 7,590 | 8,092 | 9,231 | 9,553 | 9,340 |
| Year-on-year | 2.6% | 1.7% | 1.0% | -4.8% | 2.7% | 4.5% | 6.6% | 14.1% | 3.5% | -2.2% |
| Cost of Goods Sold | 4,811 | 4,976 | 4,655 | 4,535 | 4,607 | 4,710 | 4,940 | 5,572 | 6,112 | 6,090 |
| Gross Income | 2,424 | 2,381 | 2,772 | 2,533 | 2,654 | 2,880 | 3,152 | 3,659 | 3,441 | 3,250 |
| Gross Income Margin | 33.5% | 32.4% | 37.3% | 35.8% | 36.6% | 37.9% | 39.0% | 39.6% | 36.0% | 34.8% |
| SG&A Expense | 2,262 | 2,181 | 2,257 | 2,339 | 2,330 | 2,474 | 2,399 | 2,609 | 2,624 | 2,729 |
| EBIT (Operating Income) | 162 | 200 | 515 | 194 | 324 | 406 | 753 | 1,050 | 817 | 521 |
| Year-on-year | -40.2% | 23.5% | 157.5% | -62.3% | 67.0% | 25.3% | 85.5% | 39.4% | -22.2% | -36.2% |
| Operating Income Margin | 2.2% | 2.7% | 6.9% | 2.7% | 4.5% | 5.3% | 9.3% | 11.4% | 8.6% | 5.6% |
| EBITDA | 248 | 279 | 600 | 350 | 507 | 613 | 928 | 1,216 | 958 | 669 |
| Pretax Income | 330 | 407 | 456 | 400 | 403 | 388 | 1,008 | 1,099 | 790 | 653 |
| Consolidated Net Income | 200 | 249 | 276 | 250 | 278 | 246 | 701 | 768 | 552 | 461 |
| Minority Interest | -1 | 19 | 22 | 12 | 17 | 8 | 27 | 31 | 35 | 19 |
| Net Income ATOP | 201 | 230 | 254 | 237 | 260 | 237 | 674 | 737 | 517 | 442 |
| Year-on-year | -35.8% | 14.4% | 10.4% | -6.7% | 9.7% | -8.8% | 184.4% | 9.3% | -29.9% | -14.5% |
| Net Income Margin | 2.8% | 3.1% | 3.4% | 3.4% | 3.6% | 3.1% | 8.3% | 8.0% | 5.4% | 4.7% |
| (Balance Sheet) | ||||||||||
| Cash & Short-Term Investments | 1,482 | 1,498 | 1,948 | 1,483 | 2,268 | 2,516 | 3,259 | 3,555 | 3,036 | 3,025 |
| Total assets | 8,161 | 7,790 | 7,934 | 8,126 | 8,485 | 8,890 | 9,640 | 10,072 | 10,313 | 10,872 |
| Total Debt | 20 | 20 | 20 | 20 | 20 | 20 | 20 | 28 | 27 | 25 |
| Net Debt | -1,462 | -1,478 | -1,928 | -1,463 | -2,248 | -2,496 | -3,239 | -3,527 | -3,009 | -3,000 |
| Total liabilities | 1,629 | 1,412 | 1,350 | 1,286 | 1,430 | 1,566 | 1,776 | 1,750 | 1,693 | 1,844 |
| Total Sharehjolders’ Equity | 6,050 | 5,951 | 6,135 | 6,381 | 6,581 | 6,843 | 7,358 | 7,787 | 8,052 | 8,445 |
| (Cash Flow) | ||||||||||
| Net Operating Cash Flow | 297 | 129 | 573 | 294 | 909 | 569 | 803 | 648 | 306 | 744 |
| Capital Expenditure | 70 | 175 | 252 | 546 | 152 | 182 | 76 | 156 | 119 | 120 |
| Net Investing Cash Flow | -227 | -263 | 99 | -440 | -186 | -135 | 42 | -145 | -313 | -766 |
| Net Financing Cash Flow | -122 | -151 | -107 | -109 | -85 | -85 | -97 | -420 | -236 | -201 |
| Free Cash Flow | 244 | 80 | 444 | -185 | 858 | 428 | 767 | 617 | 251 | 677 |
| (Profitability %) | ||||||||||
| ROA | 2.45 | 2.88 | 3.23 | 2.96 | 3.14 | 2.74 | 7.27 | 7.48 | 5.07 | 4.17 |
| ROE | 3.25 | 3.83 | 4.20 | 3.80 | 4.03 | 3.55 | 9.49 | 9.73 | 6.53 | 5.36 |
| (Per-share) Unit: JPY | ||||||||||
| EPS | 33.9 | 38.8 | 42.8 | 40.0 | 43.9 | 40.0 | 113.7 | 126.9 | 89.1 | 75.8 |
| BPS | 1,020.6 | 1,003.9 | 1,034.9 | 1,076.4 | 1,110.2 | 1,154.4 | 1,241.2 | 1,344.5 | 1,385.1 | 1,447.2 |
| Dividend per Share | 20.00 | 16.00 | 18.00 | 14.00 | 14.00 | 14.00 | 34.00 | 36.00 | 36.00 | 30.00 |
| Shares Outstanding(million shrs) | 6.05 | 6.05 | 6.05 | 6.05 | 6.05 | 6.05 | 6.05 | 6.05 | 6.05 | 6.05 |
Source: Omega Investment from company materials