2026-03-12
Home
Japanese

Omega Investment Co., Ltd.
Kidswell Bio (Company note – 1Q update)

| Share price (9/4) | ¥123 | Dividend Yield (25/3 CE) | – % |
| 52weeks high/low | ¥120/129 | ROE(24/3 act) | -166.5 % |
| Avg Vol (3 month) | 626 thou shrs | Operating margin (24/3 act) | -54.9 % |
| Market Cap | ¥4.9 bn | Beta (5Y Monthly) | N/A |
| Enterprise Value | ¥5.6 bn | Shares Outstanding | 39.721 mn shrs |
| PER (25/3 CE) | – X | Listed market | TSE Growth |
| PBR (24/3 act) | 8.6 X |
| Click here for the PDF version of this page |
| PDF version |
The biosimilar business recorded a profit. A contract with a partner company for the development of SHED is awaited.
◇ 1Q of FY2025/3 Financial Highlights: Consolidated financial results announced
Effective the beginning of the current fiscal year, Kidswell Bio spun off its cell therapy business into a wholly-owned subsidiary, S-Quatre Corporation, and the company (Kidswell Bio on a non-consolidated basis) transitioned to a structure that focuses mainly on the biosimilar business.
The company announced its first quarter results for FY2025/3 on August 14, 2024, with sales of 480 million yen, operating loss of 150 million yen, ordinary loss of 170 million yen, and quarterly net loss attributable to owners of the parent of 170 million yen. As the company has just started consolidating its accounts, year-on-year comparisons are not shown in the earnings report. However, the company commented that the results were in line with its expectations.
The balance sheet shows that the company requires increased working capital in line with the growth of its biosimilar business. In response, the company is in discussions with partner development companies and is implementing measures to improve cash flow and profitability. The company manages working capital flexibly and appropriately in response to increasing demand.
◇ Topics: Turning the biosimilar business profitable, forming a partnership with Chiome Bioscience in the same business, and continuing negotiations with SHED development partner companies
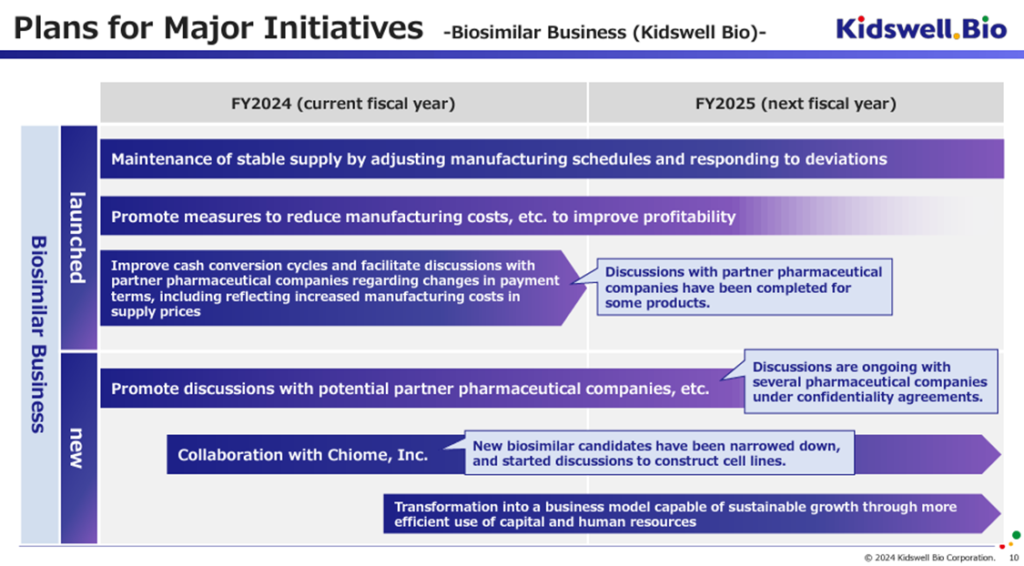
First, the company’s biosimilar business recorded a profit, with sales of 480 million yen, gross profit of 220 million yen, operating profit of 30 million yen, ordinary profit of 10 million yen, and quarterly net profit of 10 million yen. According to the company, deliveries of the four biosimilars it supplies have all been on schedule, and demand for GBS-007 and GBS-010, in particular, which have no competing biosimilars, has been extremely strong. The fact that the company has achieved a profit in the face of continued cost pressures due to rising manufacturing costs in overseas markets and the depreciation of the yen is significant.
Second, to further expand its biosimilar business, the company has formed a business alliance with Chiome Bioscience, Inc. (hereafter, Chiome). By sharing the human resources and know-how of both companies, which are well versed in biotechnology, it is expected that the efficiency and speed of development of the fifth and subsequent products will be improved.
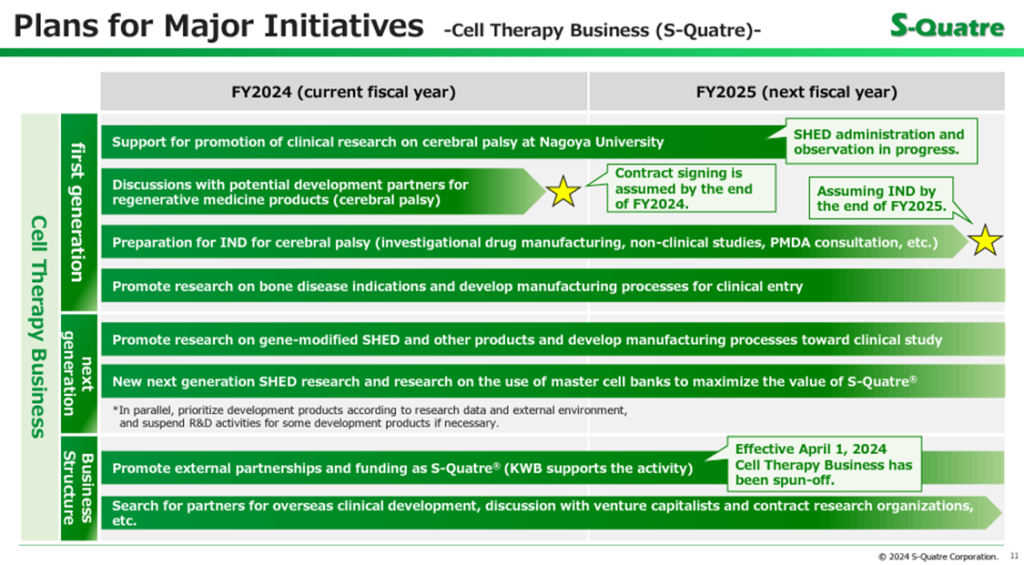
Third, the clinical research on cerebral palsy using autologous SHED, initiated in the previous fiscal year and led by Nagoya University, is progressing smoothly. In addition, preparations for manufacturing the investigational product and consultations with the Pharmaceuticals and Medical Devices Agency are progressing for the clinical trial of allogeneic SHED for cerebral palsy (chronic stage) in Japan, and contract negotiations are progressing with the development partner company that will lead this clinical trial.
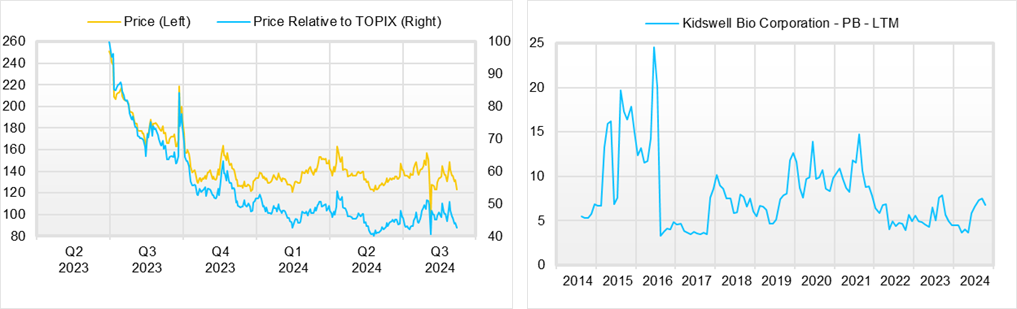
◇Stock Price Trends and Points to Watch in the Future
Since last autumn, the company’s share price has generally fluctuated between 120 and 160 yen, with a mid-point of 140 yen. When the stock market fell sharply in early August this year, the company’s share price also fell sharply, but it quickly recovered to 130 yen.
This is believed to reflect the company’s track record of steadily monetizing the growth opportunities in its biosimilar business, which is less susceptible to economic trends (while also addressing increased working capital and exchange rate fluctuations), and linking this to corporate value, the fact that a path for further earnings and corporate value growth is beginning to emerge, and the expectation that the company’s contract with its development partner for SHED in the cell therapy business will be concluded within the fiscal year ending March 2025, as the company has anticipated. As these points progress, the value of each business will become visible, and at the same time, the means of raising funds will become more optimized, and the company will be able to break away from its traditional financial structure, which has seen continuous dilution of the shares. For this reason, the company is attracting much attention in the stock market.
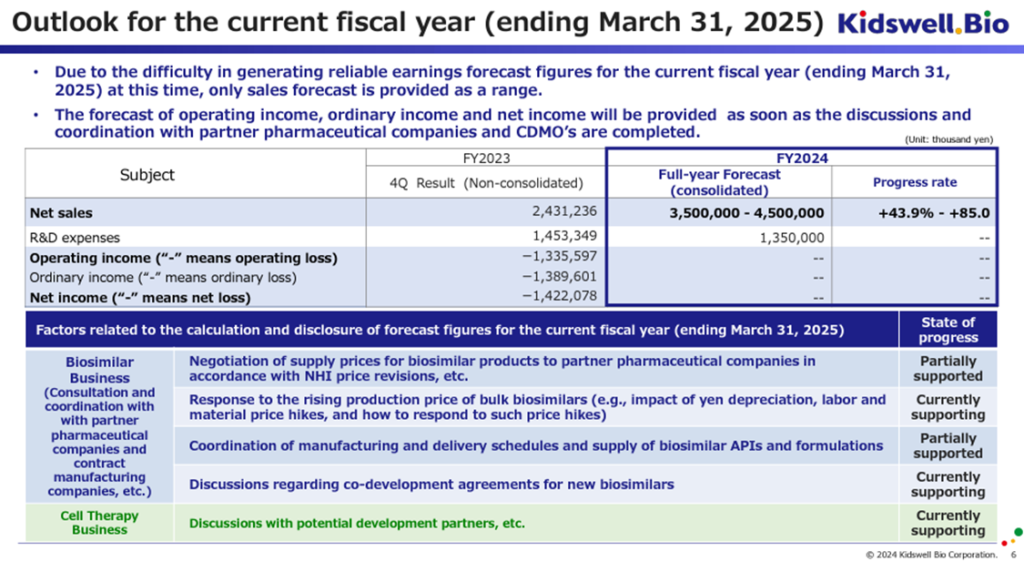
The main points to watch are whether the company will be able to improve the accuracy of its full-year sales guidance of 3.5-4.5 billion yen; whether the company will disclose its profit forecast, which it has not disclosed to date, and whether it will be positive; whether the company will be able to ensure stable supply and profitability of the biosimilars it has already launched, and the optimization of cash flow, the progress of the development of new biosimilars and the results of the collaboration with Chiome Bioscience, and the conclusion of a contract with a development partner in the cell therapy business as mentioned above during the current fiscal year as planned by the company. We should also pay attention to the fact that a weaker yen will lead to cost reductions.
Company profile
Kidswell Bio Inc. (hereafter, the company) is a drug discovery venture company that originated at Hokkaido University. It is a pioneer in the biosimilar business, has obtained approval for, and supplies four products.
The company is also promoting a cell therapy business (regenerative medicine) that utilizes Stem cells from Human Exfoliated Deciduous teeth (SHED), and clinical research using autologous SHED for cerebral palsy (in the chronic stage) led by Nagoya University has already begun. To begin clinical trials of allogeneic SHED for cerebral palsy (in the chronic phase) in Japan, preparations are underway for the manufacture of the trial product, consultations are being held with the Pharmaceuticals and Medical Devices Agency, and it is planned that a contract will be concluded with the development partner company that will lead this clinical trial during FY2025/3. Preparations for international expansion are also underway.
In FY2025/3, SHED development was transferred to the newly established wholly-owned subsidiary S-Quatre Corporation, and the company became a structure that mainly specializes in the biosimilar business. As a result, it became possible to visualize the two businesses’ business values and take the most appropriate financial strategy for each business.
Key financial data
| Unit: million yen | 2019/3 | 2020/3 | 2021/3 | 2023/3 | 2024/3 | 2025/3 CE |
| Sales | 1,078 | 997 | 1,569 | 2,776 | 2,431 | 3,500 ~4,500 |
| EBIT (Operating Income) | -1,161 | -970 | -976 | -551 | -1,336 | |
| Pretax Income | -7,314 | -1,000 | -550 | -656 | -1,421 | |
| Net Profit Attributable to Owner of Parent | -7,316 | -1,001 | -551 | -657 | -1,422 | |
| Cash & Short-Term Investments | 2,033 | 1,461 | 1,161 | 1,067 | 2,231 | |
| Total assets | 3,592 | 3,934 | 3,470 | 3,895 | 5,086 | |
| Total Debt | 2,575 | 2,575 | 2,575 | 2,575 | 2,575 | |
| Net Debt | 344 | 344 | 344 | 344 | 344 | |
| Total liabilities | 2,105 | 2,324 | 1,767 | 2,661 | 4,254 | |
| Total Shareholders’ Equity | 831 | 831 | 831 | 831 | 831 | |
| Net Operating Cash Flow | -1,325 | -1,267 | -1,170 | -1,421 | -454 | |
| Net Investing Cash Flow | -137 | -22 | 527 | -29 | 0 | |
| Net Financing Cash Flow | 1,222 | 718 | 369 | 1,356 | 1,618 | |
| Free Cash Flow | -1,327 | -1,267 | ||||
| ROA (%) | -216.99 | -26.61 | -14.88 | -17.85 | -31.67 | |
| ROE (%) | -346.86 | -64.66 | -33.25 | -44.78 | -137.73 | |
| EPS (Yen) | -264.7 | -34.8 | -17.9 | -20.8 | -40.2 | |
| BPS (Yen) | 53.8 | 54.4 | 54.2 | 38.5 | 21.4 | |
| Dividend per Share (Yen) | 0.00 | 0.00 | 0.00 | 0.00 | 0.00 | |
| Shares Outstanding (Million shares) | 27.65 | 29.06 | 31.44 | 31.90 | 37.31 |
Source: Omega Investment from company data, rounded to the nearest whole number.
Share price
Quarterly topics
Source: Omega Investment from company materials
Source: Omega Investment from company materials
Source: Omega Investment from company materials
Source: Omega Investment from company materials
Financial data (quarterly basis)
| Unit: million yen | 2023/3 | 2024/3 | 2025/3 | ||||||
| 1Q | 2Q | 3Q | 4Q | 1Q | 2Q | 3Q | 4Q | 1Q | |
| (Income Statement) | |||||||||
| Sales | 611 | 505 | 611 | 1,049 | 46 | 536 | 985 | 864 | 483 |
| Year-on-year | 101.4% | 15.5% | -5.0% | 464.2% | -92.5% | 6.1% | 61.3% | -17.6% | 950.4% |
| Cost of Goods Sold (COGS) | 293 | 128 | 233 | 597 | 1 | 351 | 352 | 688 | 259 |
| Gross Income | 318 | 377 | 378 | 453 | 45 | 185 | 633 | 176 | 224 |
| Gross Income Margin | 52.1% | 74.6% | 61.8% | 43.2% | 98.1% | 34.5% | 64.3% | 20.4% | 46.3% |
| SG&A Expense | 356 | 328 | 524 | 868 | 500 | 449 | 580 | 845 | 383 |
| EBIT (Operating Income) | -38 | 49 | -147 | -415 | -455 | -265 | 53 | -669 | -159 |
| Year-on-year | -87.7% | -134.7% | -915.9% | 90.4% | 1097.7% | -638.6% | -135.9% | 60.9% | -65.1% |
| Operating Income Margin | -6.2% | 9.7% | -24.0% | -39.6% | -989.7% | -49.4% | 5.3% | -77.3% | -32.9% |
| EBITDA | -38 | 49 | -146 | -415 | -455 | -264 | 53 | -668 | -159 |
| Pretax Income | -81 | 39 | -152 | -462 | -470 | -309 | 35 | -676 | -176 |
| Consolidated Net Income | -81 | 38 | -152 | -463 | -471 | -310 | 33 | -675 | -177 |
| Minority Interest | 0 | 0 | 0 | 0 | 0 | 0 | 0 | 0 | |
| Net Income ATOP | -81 | 38 | -152 | -463 | -471 | -310 | 33 | -675 | -177 |
| Year-on-year | -74.2% | -125.6% | -141.3% | 1.3% | 481.4% | -909.1% | -121.6% | 45.9% | -62.5% |
| Net Income Margin | -13.3% | 7.6% | -24.9% | -44.1% | -1023.6% | -57.8% | 3.3% | -78.0% | -36.6% |
| (Balance Sheet) | |||||||||
| Cash & Short-Term Investments | 1,532 | 1,875 | 1,500 | 1,067 | 625 | 622 | 2,187 | 2,231 | 1,167 |
| Total assets | 4,305 | 4,260 | 4,173 | 3,895 | 3,044 | 3,194 | 5,199 | 5,086 | 4,609 |
| Total Debt | 1,700 | 2,175 | 2,075 | 1,950 | 1,850 | 1,775 | 2,275 | 2,575 | 2,402 |
| Net Debt | 168 | 300 | 575 | 883 | 1,225 | 1,153 | 88 | 344 | 1,235 |
| Total liabilities | 2,661 | 2,560 | 2,485 | 2,661 | 2,276 | 2,119 | 3,755 | 4,254 | 3,895 |
| Total Shareholders’ Equity | 1,643 | 1,700 | 1,688 | 1,234 | 769 | 1,075 | 1,444 | 831 | 714 |
| (Profitability %) | |||||||||
| ROA | -8.12 | -3.21 | -16.14 | -17.85 | -28.50 | -37.43 | -25.82 | -31.67 | -29.48 |
| ROE | -19.31 | -7.05 | -34.05 | -44.78 | -86.81 | -100.55 | -77.27 | -137.73 | -152.15 |
| (Per-share) Unit: JPY | |||||||||
| EPS | -2.6 | 1.2 | -4.8 | -14.4 | -14.7 | -9.3 | 0.9 | -17.5 | -4.5 |
| BPS | 52.3 | 54.0 | 52.7 | 38.5 | 24.0 | 30.0 | 37.6 | 21.4 | 18.1 |
| Dividend per Share | 0.00 | 0.00 | 0.00 | 0.00 | 0.00 | 0.00 | 0.00 | 0.00 | 0.00 |
| Shares Outstanding(million shares) | 31.44 | 31.45 | 31.90 | 32.06 | 32.06 | 37.09 | 37.31 | 38.43 | 39.41 |
Source: Omega Investment from company materials
Financial data (full-year basis)
| Unit: million yen | 2014/3 | 2015/3 | 2016/3 | 2017/3 | 2018/3 | 2019/3 | 2020/3 | 2021/3 | 2022/3 | 2023/3 | 2024/3 |
| (Income Statement) | |||||||||||
| Sales | 301 | 61 | 1,161 | 1,089 | 1,060 | 1,022 | 1,078 | 997 | 1,569 | 2,776 | 2,431 |
| Year-on-year | 397.8% | -79.9% | 1817.7% | -6.2% | -2.7% | -3.6% | 5.5% | -7.5% | 57.5% | 76.9% | -12.4% |
| Cost of Goods Sold | 142 | 15 | 501 | 398 | 423 | 413 | 653 | 120 | 553 | 1,251 | 1,393 |
| Gross Income | 159 | 45 | 660 | 692 | 637 | 609 | 425 | 877 | 1,017 | 1,525 | 1,038 |
| Gross Income Margin | 52.8% | 74.5% | 56.9% | 63.5% | 60.1% | 59.6% | 39.4% | 88.0% | 64.8% | 54.9% | 42.7% |
| SG&A Expense | 672 | 403 | 1,480 | 1,876 | 1,551 | 1,414 | 1,586 | 1,847 | 1,992 | 2,076 | 2,374 |
| EBIT (Operating Income) | -512 | -358 | -820 | -1,184 | -913 | -806 | -1,161 | -970 | -976 | -551 | -1,336 |
| Year-on-year | 43.1% | -30.1% | 129.1% | 44.4% | -22.9% | -11.8% | 44.2% | -16.5% | 0.6% | -43.5% | 142.4% |
| Operating Income Margin | -170.0% | -591.6% | -70.7% | -108.7% | -86.2% | -78.8% | -107.8% | -97.3% | -62.2% | -19.8% | -54.9% |
| EBITDA | -512 | -358 | -820 | -1,184 | -913 | -805 | -1,161 | -969 | -973 | -550 | -1,335 |
| Pretax Income | -517 | -374 | -786 | -1,222 | -903 | -854 | -7,314 | -1,000 | -550 | -656 | -1,421 |
| Consolidated Net Income | -519 | -377 | -788 | -1,225 | -905 | -856 | -7,316 | -1,001 | -551 | -657 | -1,422 |
| Minority Interest | 0 | 0 | 0 | 0 | 0 | 0 | 0 | 0 | 0 | 0 | 0 |
| Net Income ATOP | -519 | -377 | -788 | -1,225 | -905 | -856 | -7,316 | -1,001 | -551 | -657 | -1,422 |
| Year-on-year | 37.7% | -27.4% | 108.9% | 55.5% | -26.1% | -5.3% | 754.4% | -86.3% | -45.0% | 19.3% | 116.3% |
| Net Income Margin | -172.3% | -622.9% | -67.9% | -112.4% | -85.4% | -83.8% | -678.9% | -100.5% | -35.1% | -23.7% | -58.5% |
| (Balance Sheet) | |||||||||||
| Cash & Short-Term Investments | 1,610 | 887 | 817 | 2,380 | 1,891 | 2,009 | 2,033 | 1,461 | 1,161 | 1,067 | 2,231 |
| Total assets | 1,887 | 922 | 1,694 | 3,706 | 3,025 | 3,151 | 3,592 | 3,934 | 3,470 | 3,895 | 5,086 |
| Total Debt | 775 | 0 | 810 | 0 | 0 | 0 | 1,225 | 1,100 | 700 | 1,950 | 2,575 |
| Net Debt | -835 | -887 | -7 | -2,380 | -1,891 | -2,009 | -808 | -361 | -461 | 883 | 344 |
| Total liabilities | 834 | 34 | 1,291 | 206 | 421 | 420 | 2,105 | 2,324 | 1,767 | 2,661 | 4,254 |
| Total Shareholders’ Equity | 1,053 | 888 | 403 | 3,500 | 2,604 | 2,731 | 1,487 | 1,610 | 1,703 | 1,234 | 831 |
| (Cash Flow) | |||||||||||
| Net Operating Cash Flow | -730 | -305 | -607 | -1,759 | -438 | -860 | -1,325 | -1,267 | -1,170 | -1,421 | -454 |
| Capital Expenditure | 0 | 0 | 2 | 0 | 0 | 0 | 2 | 3 | 0 | 0 | 0 |
| Net Investing Cash Flow | -2 | -0 | -122 | -150 | -50 | -0 | -137 | -22 | 527 | -29 | 0 |
| Net Financing Cash Flow | 1,454 | 907 | 947 | 3,472 | 0 | 978 | 1,222 | 718 | 369 | 1,356 | 1,618 |
| (Profitability %) | |||||||||||
| ROA | -36.97 | -26.84 | -60.21 | -45.35 | -26.88 | -27.73 | -216.99 | -26.61 | -14.88 | -17.85 | -31.67 |
| ROE | -53.51 | -38.85 | -122.00 | -62.74 | -29.64 | -32.10 | -346.86 | -64.66 | -33.25 | -44.78 | -137.73 |
| (Per-share) Unit: JPY | |||||||||||
| EPS | -60.0 | -59.6 | -75.7 | -68.5 | -47.3 | -43.8 | -264.7 | -34.8 | -17.9 | -20.8 | -40.2 |
| BPS | 110.4 | 106.7 | 34.9 | 182.9 | 136.1 | 134.3 | 53.8 | 54.4 | 54.2 | 38.5 | 21.4 |
| Dividend per Share | 0.00 | 0.00 | 0.00 | 0.00 | 0.00 | 0.00 | 0.00 | 0.00 | 0.00 | 0.00 | 0.00 |
| Shares Outstanding (million shrs) | 8.59 | 9.54 | 10.85 | 18.74 | 19.14 | 19.68 | 27.65 | 29.06 | 31.44 | 31.90 | 37.31 |
Source: Omega Investment from company materials